A Monthly Double-Blind Peer Reviewed Refereed Open Access International e-Journal - Included in the International Serial Directories.
GE-International Journal of Engineering Research (GE-IJER) ISSN: (2321-1717)
39 | P a g e
GE-International Journal of Engineering Research
Vol. 4, Issue 3, March 2016 IF- 4.721 ISSN: (2321-1717)© Associated Asia Research Foundation (AARF) Publication
Website: www.aarf.asia Email : [email protected] , [email protected]
DESIGN OF EMBEDDED SYSTEM BASED RAPID SENSING AC
ELECRICAL CAPACITANCE TOMOGRAPHY
K. Manikandan
Department of Electronics and Instrumentation Engineering, J.J. College of Engineering and Technology,
Anna University of Technology, Tiruchirappalli, India.
S. Sathiyamoorthy
Department of Electronics and Instrumentation Engineering, College of Engineering and Technology,
Tiruchirappalli, India.
ABSTRACT
An electrical capacitance tomography (ECT) sensor consists of eight electrodes,
usually mounted outside on insulating pipe. The principle difficulties to predict the real time
data from the ECT sensor are permittivity distribution between the plate and capacitance is
nonlinear; the electric field is distorted by the material present and is also sensitive to
measurement errors and noise. This paper describes rapid sensing an AC ECT system and
interface has been developed with embedded system. The combinational electrodes are fast
switching by programming in the embedded system. The development of new method of this
system is to increase the measurement accuracy, signal processing speed and reduce the
signal-to-noise ratio.
KEYWORDS–ELECTRICAL CAPACITANCE TOMOGRAPHY, ELCTRODES,
EMBEDDED SYSTEM, REAL TIME SYSTEM, PERMITTIVITY.
1.INTRODUCTION
An ECT sensor consists of multiple electrodes, usually mounted outside an insulating
pipe, the capacitance measured from the multiple electrode sensors. The changes in
A Monthly Double-Blind Peer Reviewed Refereed Open Access International e-Journal - Included in the International Serial Directories.
GE-International Journal of Engineering Research (GE-IJER) ISSN: (2321-1717)
40 | P a g e
material distribution in the process [1]. ECT is one of the imaging techniques most likely to
provide quantitative flow visualization flow rate information in industrial flows. It has
particularly used in two-phase oil/gas and gas/solid flows typical of petroleum and process
industry [3-5]. The ECT can be obtained the internal information is valuable for
understanding complicated process, verifying computational fluid dynamic models,
measurement and control can be compared with other industrial tomography models. ECT
offer more advantages of rapid response, no radiation, non-intrusive and non-invasive,
withstanding high temperature and pressure and low cost. This technique is also used for
biomedical field applications instead of CT and X-rays, because the ray has more radiation
[6-8]. It has been used for many industrial applications such as gas, oil, water flows in wet
gas separators, oil pipelines, pneumatic conveyors, cyclone separators and fluidized beds.
This is used to oil field industries for monitoring the bubbles in oil flow based on the
difference in their dielectric processes. In the fluidized beds, pharmaceutical industry is
operated by trial and error, because of the lack of online measurement tools. The operation of
the pharmaceutical fluidized beds cannot be optimized; the low operation efficiency and
product quality cannot be guranteed.ECT has been used in pharmaceutical fluidized beds
successfully [9-12]. The technique is capable of monitoring, both continuously and
simultaneously, the local and global dynamic behavior of the gas bubbles and the solid
particles in a noninvasive manner Electrical capacitance tomography (ECT) has prospective
uses for applications to real chemical processes, since mostly they are using organic liquids,
which are nonconductive, rather than widely used water as model liquid in laboratory [15].
In this paper, discusses about the voltage flow in the ECT system. The most commonly
used data predicted from ECT system are micro processor or microcontroller based system.
But the response time for the single measurement is approximately 10.4- sec. the time to
reconstruct one image was measured was to be approximately 8.48 msec. This paper
describes an intelligent interface has been developed with vital role of embedded system. The
in-homogeneity of sensors sensitivity distribution and medium distribution are fully
considered. The sensor is designed and constructed based on ac triangle wave as input signal
with 20 kHz. The sensitivity of the measurement is up to 0.3 femto farads the minimum speed
of measurement is brought to 1500 frames per second.
2.PRINCIPLEOFACECTSYSTEM
The AC ECT system sensor is mounted equally around the cross-section of the pipe,
A Monthly Double-Blind Peer Reviewed Refereed Open Access International e-Journal - Included in the International Serial Directories.
GE-International Journal of Engineering Research (GE-IJER) ISSN: (2321-1717)
41 | P a g e
the capacitance electrodes used depends on the application. A larger number of electrodes
will give a higher resolution image but the measurement sensitivity will be low. The
sensitivity can be increased by using longer electrodes but this will lower the axial resolution.
If high axial resolution is required, a small number of short electrodes can be used together
with separately excited axial guard electrodes, which prevent the electric field from spreading
excessively at each end of the sensor electrodes. The sensor with N-measuring electrodes,
there are N (N-1)/2 electrode pairs and thus N (N-1)/2 independent capacitances are
measured. These measurements for 8 electrodes are suitable, so the sensor is connected in
excitation signal and suddenly started the current flow in the electrodes. The current flow is
dependent on distance between two electrodes and permittivity of the medium inside the tube.
The parameters of ECT sensors can be summarized as follows [2]:
1. Thickness and the material of the wall between the electrodes and the sensing
zone.
2. Thickness and the material of the wall between the electrodes and the screen.
3. Size of the electrodes.
While designing the electrodes, the electrodes the insulation lining between the
electrodes is the greater importance.The area and distance between the plates are constant. In
these technique the current values will detected in the system. It will depend on the
permittivity value of the material located between the electrodes.The figure1 shows the block
diagram AC ECT system.
A Monthly Double-Blind Peer Reviewed Refereed Open Access International e-Journal - Included in the International Serial Directories.
GE-International Journal of Engineering Research (GE-IJER) ISSN: (2321-1717)
42 | P a g e 3. METHODOLOGY
3.1 CAPACITANCE MEASUREMENT
The resolution of the ECT system depends upon the how fast the transducer senses the
small change in capacitance with higher degree of accuracy and the number of electrode
plates used in the system. The number of sensor electrodes that can be used depends on the
range of values of inter-electrode capacitances and the upper and lower measurement limits
of the capacitance measurement circuit. The pulse generator provides required excitation
(pulse with well- defined fall and raise times) signal to the active differentiator capacitance
transducer. At the output of the active differentiator a positive and a negative peak result.
These peaks are separated using a peak-to-peak detector and are summed by a differential
amplifier. The micro controller generates control signals to control of CMOS switches to
select the excitation and detection electrodes, control of the multiplexer to select the DC
signals, in turn, from the capacitance measuring circuit; and control the gain of the amplifier
to make full use of the measurement range of the ADC and stores all the inter- electrode
capacitances which will be used for image reconstruction. The time during which the
capacitor charges from 1/3 Vcc to 2/3 Vcc is equal to the time the output is high and is given
by
TC= 0.69(RA+RB) C (1)
Similarly, the time during which the capacitor discharges from 2/3 Vcc to 1/3 Vcc is equal to
the time the output is low and is given by
TD= 0.69 RBC (2)
Thus the total period of the output waveform is
T = 0.69(RA +2 RB) C (3)
This in turn, gives frequency of oscillation as
FO = 1/T =1.45/ (RA+2RB) C (4)
Thus varying RA, RB and C can vary the frequency of the pulse generator. Varying RA and C can vary the pulse width.
3.2 DESIGNING OF EMBEDDED SYSTEM FOR FAST SWITCHING
The word ‘tomography’ represents image slicing. The image is obtained by rotating
A Monthly Double-Blind Peer Reviewed Refereed Open Access International e-Journal - Included in the International Serial Directories.
GE-International Journal of Engineering Research (GE-IJER) ISSN: (2321-1717)
43 | P a g e
Electrical capacitance tomography is a very high-speed technique to capture the real time
data of the turbulent fluctuation in the flow field. So the charging and discharging of the
electrodes are should be fast, which can be done by CMOS switches. The CMOS switches
should be controlled fast, that can be done by the micro controller. When a pair of electrodes
is selected, one of them is known as the active electrode is continuously charged and
discharged by the multiplexer’s switches. The active electrode is charged to voltage Vc, and
to the input of the current detector potential via the multiplexer’s switches. The micro
controller controlled the selection of the source electrode and the detecting electrode. The
microcontroller ports can control the 0 and 1 pins in the multiplexers. The two ports from the
micro controller are used for this purpose. The micro controller sends the control signals to
the multiplexers at the micro second ranges. The design of driving circuit is shown in figure2.
Figure 2. Circuit Diagram for Driving Circuit
4. EXPRIMENTAL RESULTS
The pulse generating circuit is designed for 1 micro second pulse width and 400
nanosecond rise and fall time. The outputs are obtained through embedded system with
necessary supporting circuits. The output signal of the differentiator output for different
capacitance is measured. The output shows that differentiating output having the noise with
the amplitude of 0.2v. The practical output results for programmable gain amplifier are taken
for the 3.9 Pf, and the corresponding output voltage is 1V. The results and the response for
A Monthly Double-Blind Peer Reviewed Refereed Open Access International e-Journal - Included in the International Serial Directories.
GE-International Journal of Engineering Research (GE-IJER) ISSN: (2321-1717)
44 | P a g e
The circuit for the driving circuit is constructed as per the design. The performance is
demonstrated with ECT sensor with full air medium and for different switching signals. Thus
the sequence observed at low frequency switching pulses validates the logic used for driving
the electrode status. The gain selection for the programmable gain amplifier is checked.
[image:6.595.217.419.200.333.2]
Figure 3. Programmable Gain amplifier response
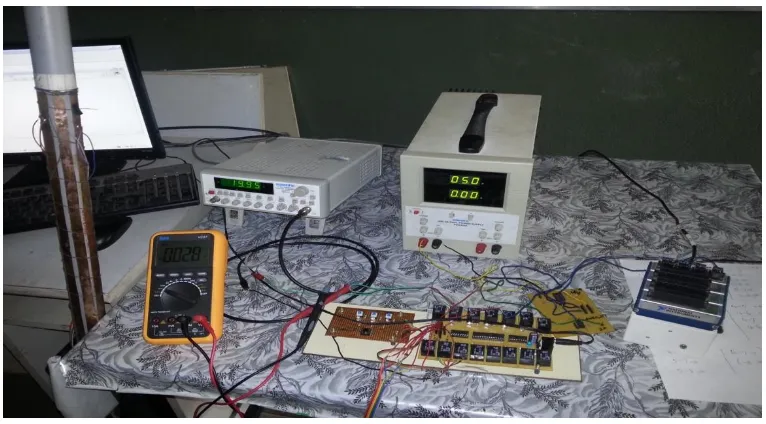
Figure 4. Experimental work
CONCLUSIONS
In this paper we present high-speed data processing system for AC ECT sensor. This
concept is analyzed, considering sensing speed, noise level and accuracy. A signal
conditioning circuits can be able to measure a small inter-electrode capacitance in the
[image:6.595.109.492.368.580.2]A Monthly Double-Blind Peer Reviewed Refereed Open Access International e-Journal - Included in the International Serial Directories.
GE-International Journal of Engineering Research (GE-IJER) ISSN: (2321-1717)
45 | P a g e
differentiator mainly depends on the unknown capacitance, feedback resistor and excitation
voltage. The analog multiplexers can be switched by using interface with programming. The
multiplexers are operated with very high speed according to the channel selection by the
controller. The embedded system can be operated in the nanoseconds range.
REFERENCES
[1] Gao Yan-li, Zhang Yongga, Designing High-speed Hardware for Electrical
Capacitance Tomography System, International Form on Computer Science Technology
and Application, 2009, pp.(332-335)
[2] Kjell Joar Alme and Saba Mylvaganam, Electrical Capacitance Tomography— Sensor Models, Design, Simulations, and Experimental Verification, IEEE Sensor Journal, Vol 6, October 2006, PP.(1256-1265)
[3] Warsito Warsito, Qussai Marashdeh, Liang-Shih Fan, Electrical Capacitance Volume Tomography, IEEE sensors journal, Vol. 7, No. 4, April 2007.
[4] Qi Wang, Huaxiang Wang, Kuihong Hao, and Peng Dai, Two-Phase Flow Regime Identification Based on Cross-Entropy and Information Extension Methods for Computerized Tomography, IEEE transactions on Instrumentation and measurements, Vol. 60, No.2, February 2011.
[5] S.M.Huang,C.G.Xie,R.Thorn.D.Snowden.M.S.Beck, Design of sensor Electronics for Electrical Capacitance Tomography, IEE Proceedings-G,Vol.139,1992, PP (83-88)
[6] S.Sathyamoorthy and J.Sarachandrababu, Design of High-Speed Pulse Input Based Capacitance Measurement for Electrical Capacitance Tomography, Sensors & Transducers Journal, Vol.75, Issue 1, January 2007.
[7] Zhaoyan Fan ,Robert X. Gao, A New Sensing Method for Electrical Capacitance Tomography, IEEE, 2010
[8] Ji ying, Design and implementation of hardware system for electrical Capacitance Tomography, First international workshop on education technology and computer science, 2009, pp.(588-594)
[9] Li Lanying, Gao Ming and Chen Deyun, A Novel Multiple Electrodes Excitation Method For Electrical Capacitance tomography System. 2011, PP.(1167-1171)
[10] Zhaoyan Fan, Robert X-Gao A Frequency selection scheme for increased Imaging speed in ECT , IEEE 2012
[11] L. F. M. Moura,E. Cenedeseand A. C. AzevedoFilho, Numerical study of a capacitive tomography system for multiphase flow Thermal engineering vol.8.no.02.December 2007
[12] Lijun xu , Halil zhou ,Zhang cao and wuqiang yang, A Digital switching demodulator for electrical capacitance tomography, IEEE transactions on Instrumentation and measurements, Vol. 62, No.5, May 2013.
[13] Samir Teniou , Mahmoud Meribout, and Khaled Belarbi Real-Time Reconstruction of Moving Objects in an Electrical Capacitance Tomography System Using Inter-Frame Correlation, IEEESensors Journal, Vol.12, No.7, July 2012.
[14] Xia Li, Zhiyao Huang, Baoliang Wang, and Haiqing Li, A New Method for the Online
Voidage Measurement of the Gas–Oil Two-Phase Flow IEEE transaction on
A Monthly Double-Blind Peer Reviewed Refereed Open Access International e-Journal - Included in the International Serial Directories.
GE-International Journal of Engineering Research (GE-IJER) ISSN: (2321-1717)
46 | P a g e [15] W. Q. Yang, A. L. Stott, and J. C. Gamio, Analysis of the Effect of Stray Capacitance on
an AC-Based Capacitance Tomography Transducer, IEEE transaction on