IJPSR (2014), Vol. 5, Issue 11 (Research Article)
Received on 22 April, 2014; received in revised form, 23 July, 2014; accepted, 31 July, 2014; published 01 November, 2014
A VALIDATED RP-HPLC METHOD FOR SIMULTANEOUS ESTIMATION OF ASPIRIN AND PRASUGREL IN TABLET DOSAGE FORM
P. Vivek Sagar *1, T. Samidha 1, M. Vamshi Krishna 1 and S. Shobha Rani 2
Department of Pharmaceutical Analysis, Care College of pharmacy 1, Oglapur (v), Atmakur (M), Warangal, Telangana, India.
Department of Pharmaceutical Analysis, Jawaharlal Nehru Technological University 2, Kukatpally, Hyderabad, Telangana, India.
ABSTRACT: Aim of the present work is to develop a rapid, simple, precise, accurate and reproducible reverse phase high performance liquid chromatographic method for simultaneous determination of Aspirin and Prasugrel in tablet dosage form. The estimation was carried out on a HIBAR (Lichrospher C-18) column with the dimensions of 250mm x 4.6mm, 5µm. Combination of Acetonitrile and 0.5% Potassium dihydrogen phosphate buffer (adjusted to pH-3 using orthophosphoric acid) in the ratio of 60: 40 was used as mobile phase. The flow rate is set at 1.0ml/min and eluents were monitored at 220 nm. Both drugs were properly resolved having run time of 3.3 min and 4.8 min for Aspirin and Prasugrel, respectively. The method was validated as a final verification of method development with respect to Precision, Linearity, Accuracy, Ruggedness and Robustness. Linearity for Aspirin and Prasugrel was in the range of 10-450μg/ml and 10-500μg/ml respectively. The mean recoveries obtained for Aspirin and Prasugrel were within the range of 98-102%.
INTRODUCTION: Aspirin (ASP), 2-acetoxy benzoic acid is cyclooxygenase inhibitor. The molecular formula is C9H8O4 and the molecular weight is 180.16 gm/mole. It is a Non-steroidal Anti-inflammatory drug and inhibits Platelet aggregation. Prasugrel chemically is 5-[2-cyclopropyl-1-(2-fluorophenyl)-2-oxoethyl]-4, 5, 6, 7-tetrahydrothienol [3, 2- c] pyridin-2-ylacetate. The molecular formula is C20H20FNO3Sand the molecular weight is 373.442gm/mole.
QUICK RESPONSE CODE
DOI:
10.13040/IJPSR.0975-8232.5(11).4858-64
Article can be accessed online on:
www.ijpsr.com
DOI link: http://dx.doi.org/10.13040/IJPSR.0975-8232.5(11).4858-64
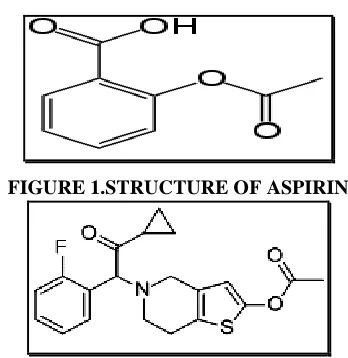
[image:1.612.350.524.545.724.2]It inhibits adenosine diphosphate induced platelet aggregation and used in the treatment of coronary artery disease. Structures for aspirin and Prasugrel were given in Figures 1 and 2.
[image:1.612.49.298.633.721.2]FIGURE 1.STRUCTURE OF ASPIRIN
FIGURE 2.STRUCTURE OF PRASUGREL
Keywords:
Aspirin, Prasugrel, RP- HPLC, Validation
Correspondence to Author:
P. Vivek Sagar
Care College of Pharmacy Oglapur (v), Atmakur (M), Warangal, Telangana, India
Literature survey revealed that only few analytical methods (3- 18) such as HPLC, LC-MS, UV, and HPTLC have been reported for the determination of PRASU and ASP individually and in combination with other drugs. Only two methods (1-2) were reported till date using RP-HPLC which suffers with some drawbacks like high retention time, asymmetric peak shape and low range of linearity. The present study focuses on development of simple, rapid, sensitive, precise, accurate and cost effective analytical method for estimation of Aspirin and Prasugrel in Tablet dosage form.
MATERIALS AND METHODS: Reagents and chemicals:
The bulk drug of Prasugrel was obtained as a gift sample from MSN Laboratories, Hyderabad. HPLC grade Acetonitrile, Orthophosphoric acid and
Potassium dihydrogen phosphate, sodium
hydroxide were obtained from Merck and Milli-Q water of HPLC grade was used for the experiment.
Stock solution and standards:
25mg of Aspirin and Prasugrel were accurately weighed and transferred in to a 25ml volumetric flask and required quantity of mobile phase was added to dissolve the drugs. Then volume was made up to the mark with mobile phase. This gives the standard stock solution of Aspirin and Prasugrel having concentration of 1000µg/ml. working standard solutions were prepared by transferring suitable aliquots of standard solution in to 10ml volumetric flask and made up to mark with mobile phase.
Apparatus and Chromatographic conditions: HPLC analysis was performed on SHIMADZU 20-AD HPLC outfitted with dual head reciprocating pump with a manually operating Rheodyne injector of 20µl sample loop and a SPD-20A UV-Vis detector. The software equipped was LC solution
software. The Chromatographic column,
Lichrospher C-18 (250mm x4.6mm, 5µm) was used as a stationary phase. Acetonitrile and 0.5% potassium dihydrogen phosphate (pH-3) in the ratio of 60:40 was used as mobile phase. The pump flow rate was set at 1.0ml/min. The eluent was detected at 220nm and run time was 7min.
Preparation of sample solution:
Twenty tablets were weighed accurately and crushed to form a fine powder. Accurately weighed quantity of powder equivalent to 75 mg of Aspirin, and 10mg of Prasugrel were transferred in to a 100 ml of volumetric flask, 50ml of mobile phase was added.
[image:2.612.317.561.333.469.2]The volume was made up to mark with mobile phase and then sonicated for 5min. This solution was then filtered through whatmann filter paper. Suitable aliquot of the filtrate was pipetted in to 10ml volumetric flask and volume made up with mobile phase to obtain concentration in the range of linearity previously determined. This solution was filtered through a 0.45µ membrane filter and sonicated for 2 min. This was marked as Test solution.
TABLE.1. SYSTEM SUITABILITY DATA FOR
ASPIRIN AND PRASUGREL
System suitability
Parameters Aspirin Prasugrel
Retention time (Rt) 3.364 4.832 Peak area 2239644 1823730 USP plate count (N) 6978.447 7719.533 USP tailing factor (T) 1.2545 1.321833 Resolution factor (Rs) 8.404 7.670 Relative retention time
(RRT) 0 1.468
% RSD of(n= 6)
Assay of Marketed Formulation:
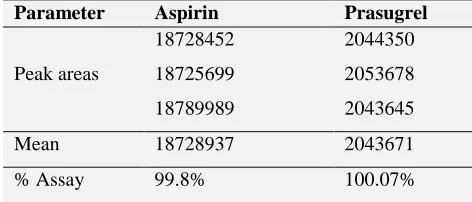
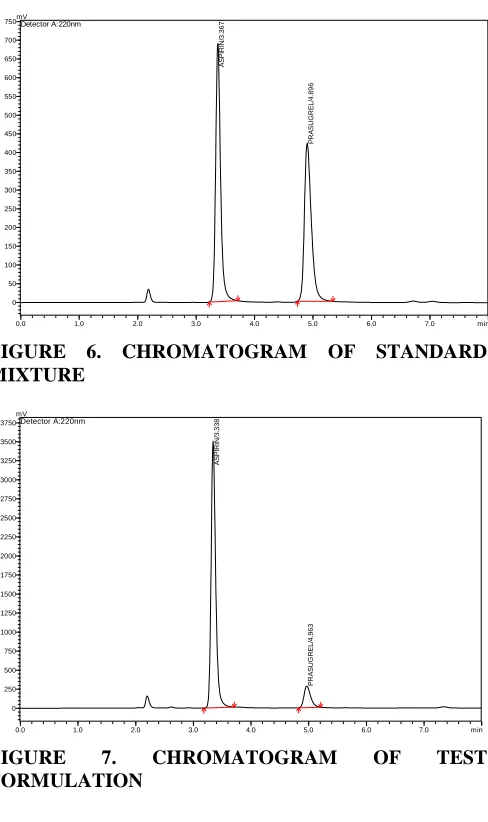
Prepared sample solution was injected under identical chromatographic conditions as mentioned earlier and chromatograms were recorded. This was done in triplicate. The amount of Aspirin and Prasugrel is calculated from the calibration curve. The results were given in the Table 2. Representative chromatograms for blank, standard and sample were given in the Figures 5, 6 &7.
TABLE.2. ASSAY DATA FOR ASPIRIN AND
PRASUGREL TABLET FORMULATION
Parameter Aspirin Prasugrel
Peak areas
18728452 18725699 18789989
2044350 2053678 2043645
Mean 18728937 2043671
[image:2.612.320.556.649.750.2]0.0 1.0 2.0 3.0 4.0 5.0 6.0 7.0 8.0 9.0 10.0 11.0 min 0 5000 10000 15000 20000 25000 30000 35000 40000 45000 50000 55000 mV Detector A:288nm
FIGURE 5. CHROMATOGRAM OF BLANK
0.0 1.0 2.0 3.0 4.0 5.0 6.0 7.0 min
0 50 100 150 200 250 300 350 400 450 500 550 600 650 700
750mVDetector A:220nm
A S P IR IN /3 .36 7 P R A S U G R E L/ 4. 89 6
FIGURE 6. CHROMATOGRAM OF STANDARD MIXTURE
0.0 1.0 2.0 3.0 4.0 5.0 6.0 7.0 min
[image:3.612.54.298.203.614.2]0 250 500 750 1000 1250 1500 1750 2000 2250 2500 2750 3000 3250 3500 3750 mV Detector A:220nm A S P IR IN /3. 3 38 P R A S U G R EL/ 4. 963
FIGURE 7. CHROMATOGRAM OF TEST
FORMULATION
Validation of Assay Method: Linearity:
Linearity of the method was demonstrated over wide concentration ranges of Aspirin and Prasugrel. Each concentration was determined in duplicate. 20µl of each of standard solutions were injected at the optimized chromatographic conditions and the chromatograms were recorded. The average peak areas were noted. Calibration curve for ASP and PRASU were constructed by
plotting concentration on X-axis against mean peak area on Y-axis and regression equation was calculated by the method of least squares. The correlation coefficient, y-intercept, slope of the regression line were noted.
Recovery and Accuracy:
Accuracy of the method was established by performing recovery studies.It was ascertained on the basis of recovery studies by standard addition method. Recovery studies were carried out at five different levels (25%, 50%, 75%, 100%, and 125%) by the addition of standard drug to pre-analyzed sample solution having the concentration of 75µg/ml of Aspirin and 10µg/ml of Prasugrel. Triplicate determinations were carried out at each level. Mean percentage recovery values at five different levels of the two drugs were calculated.
Precision:
Precision was carried out at two levels i.e. repeatability of injections and intermediate precision.
Repeatability also called intra assay precision assessed by using a minimum of 9 determinations (3 concentrations/ 3 replicates). It was carried out at three different levels i.e. 50%, 100% and 150% under specified chromatographic conditions. 20µl of each level was injected in triplicate.
Intermediate precision expresses the precision within laboratory variations. It includes full analysis on different days, instruments or analysts. It was performed using standard concentration of 100µg/ml.
Robustness:
To evaluate the robustness of the developed RP-HPLC method, small deliberate variations in the optimized chromatographic conditions were done i.e. variation in flow rates (± 0.1ml/min), concentration of organic phase (±.2%) and detection wavelengths (± 3nm). It was performed using 50µg/ml.
RESULTS:
Method development and optimization:
water and acetonitrile at different pH with different compositions of mobile phases like 50:50 (water: Acetonitrile pH-3), 50:50 (0.5% potassium dihydrogen phosphate buffer: Acetonitrile pH-3), 60:40 (Acetonitrile: 0.5% potassium dihydrogen phosphate pH-3 and also by changing different columns like YMC ODS column and HIBAR (Lichrospher) column. The method was optimized finally using combination of Acetonitrile and 0.5% potassium dihydrogen phosphate buffer pH-3 in the ratio of 60/40 v/v with a flow rate of 1.0 ml/min. The drugs were eluted at retention times of 3.3 minutes for Aspirin and 4.8 minutes for Prasugrel at a detection wavelength of 220nm.The run time was set for 7 minutes.
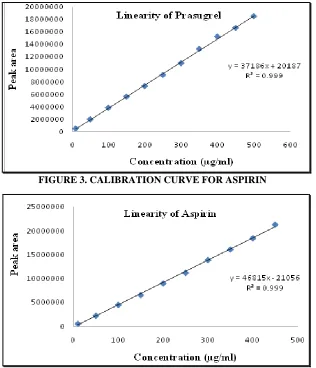
Validation: Linearity:
Calibration curves were constructed by plotting concentration on X-axis against average peak area on Y-axis and regression equations were computed. Linearity was established over the concentration range of 10-450µg/ml for Aspirin and 10-500µg/ml
for Prasugrel. Correlation coefficient for Aspirin and Prasugrel was found to be 0.999 and 0.9991 respectively. The results were given in the Table 3. Plot was given in Figures 3& 4
TABLE.3. LINEARITY DATA FOR ASPIRIN AND PRASUGREL
S. no Concentrati on (µg/ml)
Mean peak area
Aspirin Prasugrel
1 10 540423 44806
2 50 2237906 1943761
3 100 4513697 3802566
4 150 6561985 5600155
5 200 8983334 7290167
6 250 11201618 9079435
7 300 13874744 10968055
8 350 16086881 13281506
9 400 18428937 15258892
10 450 21266874 16651972
11 500 - 18529591
[image:4.612.316.562.146.334.2]FIGURE 3. CALIBRATION CURVE FOR ASPIRIN
[image:4.612.150.466.373.741.2]Recovery and Accuracy:
The % recoveries of Aspirin and Prasugrel at each level was within the limits of 98% and 102% given in the Table.7.0 which indicates that the method
[image:5.612.122.489.337.501.2]was accurate and also reveals that the excepients present in the pharmaceutical formulation has no interference with the analytes. The results were given in the Table.4.
TABLE.4. ACCURACY STUDY DATA FOR ASPIRIN AND PRASUGREL
Aspirin Prasugrel
% Level Amount of drug added (µg/ml)
Amount of drug recovered (µg/ml)
Average % Recovery
Amount of drug added (µg/ml)
Amount of drug recovered (µg/ml)
Average % Recovery
50% 175 173.04 98.8 110 109.6 99.6
75% 225 225.5 100.2 160 162 101.8
100% 275 274.3 99.7 210 206.11 98
125% 325 327.9 100.8 260 260.5 100.1
150% 375 377.4 100.64 310 311.2 100.3
Precision:
From the precision studies, it is evident that %RSD of the peak areas and %assay of both the drugs
were below 2.0%. Thus, Precision was established. Hence, the developed method was precise. The results were given in the Table. 5, 6 and 7.
TABLE.5. INTRA-ASSAY PRECISION DATA FOR ASPIRIN AND PRASUGREL
Level
Aspirin Prasugrel
Peak area
Mean% Recovery
Peak area Mean %
Recovery
50%
6463961 6775570 6482397
100.2
5658792 5668986 5656453
100.77
100%
13874744 13684218 13998756
100.2
10968055 10905785 10998172
99.21
150%
21465872 21266874 21384968
100.06
16249690 16651972 16622401
100.2
[image:5.612.59.556.532.678.2]%RSD 0.22 %RSD 0.78
TABLE.6.INTERMEDIATE PRECISION DATA FOR ASPIRIN AND PRASUGREL (100µg/ml)
Injections
Analyst-1 Analyst-2
Aspirin prasugrel Aspirin Prasugrel
Peak area %
Assay Peak area
%
Assay Peak area %
Assay Peak area % Assay 1 9817463 100.4 8293594 100.01 9776097 100.3 8220780 99.6 2 9688320 99.1 8278922 99.29 9706201 100.3 8294586 100.5 3 9773676 99.98 8318031 99.8 9762541 100.8 8256147 100.1 4 9733951 99.5 8232632 99.3 9715049 99.8 8234500 99.8 5 9848547 100.7 8203431 99.0 9685431 99.4 8245341 99.9 6 9821360 100.4 8284986 99.4 9724048 100.4 8232186 99.8
%RSD 0.61 %RSD 0.37 %RSD 0.49 %RSD 0.31
Robustness:
Even though by inducing variations in mobile phase composition, detection wavelength and flow rate, %RSD of the peak areas of Aspirin and
TABLE.7. INTERMEDIATE PRECISION DATA FOR ASPIRIN AND PRASUGREL (100µg/ml)
Injections Day-1 Day -2
Aspirin prasugrel Aspirin Prasugrel
Peak area % Assay
Peak area % Assay
Peak area % Assay
Peak area % Assay
1 4503473 100.6 3726300 99.64 4455543 99.6 3708188 99.1 2 4473439 100.05 3709073 99.20 4426736 99.0 3756872 100.4 3 4458529 99.73 3749114 100.2 4455642 99.6 3728482 99.7 4 4464748 99.86 3758249 100.5 4446495 99.4 3760791 100.5 5 4485174 100.3 3715630 99.3 4482657 100.2 3726732 99.6 6 4496958 100.5 3733257 99.8 4477316 100.1 3748975 100.2
%RSD 0.35 %RSD 0.5 %RSD 0.44 %RSD 0.54
TABLE.8. ROBUSTNESS DATA FOR ASPIRIN AND PRASUGREL
Parameter variation
Aspirin Prasugrel
Mean Rt
Mean Peak Area
%RSD of Peak Areas
Mean Rt
Mean Peak Area
%RSD of Peak Areas
Flow rate (ml/min)
0.9 3.741 2443361 1.84 5.065 1868508 1.02 1.0 3.386 2439364 0.93 4.835 1851181 0.71 1.1 3.078 2466633 0.76 4.164 1863090 1.31
Wavelength
217nm 3.366 1938318 1.63 4.861 1668374 1.27 220nm 3.384 2420403 1.20 4.848 1851181 0.71 223nm 3.375 2036054 1.37 4.870 1443889 1.58 Mobile Phase
(ACN: Buffer)
58:42 3.374 2477220 0.92 5.065 1857684 1.32 60:40 3.386 2439364 0.93 4.835 1851181 0.71 62:38 3.386 2460382 1.13 4.689 1877220 1.21
Stability of drug solutions:
Solution stability was estimated with standard concentration of 100µg/ml. The standard solution was injected and peak area values were recorded. This solution was then kept for 12hrs and injected in to HPLC and the peak areas were recorded. The same procedure was repeated at an interval of 12hrs until there was a significant change in the peak area value due to degradation (4%). The % degradation
was estimated by comparing with peak areas with the areas of freshly prepared solutions. The drug solutions were found to be stable for about 24hrs from the time of preparation. At the 36th hour significant amount was degraded. Hence, both the drug solutions prepared in the mobile phase were stable up to 36th hourfrom the time of their preparation. The results were given below in the Table.9.
TABLE.9. SOLUTION STABILITY DATA FOR ASPIRIN AND PRASUGREL
Time of Data acquisition(hrs)
Aspirin Prasugrel
Peak area % Recovery Peak area % Recovery
0 4503473 100.6 3749114 100.2
12 4464748 99.8 3733257 99.8
24 4449862 99.54 3697907 98.9
36 4221362 96 3419177 96
CONCLUSION: The proposed method was found to be simple, rapid, precise, robust and accurate for the determination of Aspirin and Prasugrel in Tablet formulation. The sample recoveries from the
linearity, precision, accuracy and robustness as per ICH guidelines. The method provides a linear response across a wide range of concentrations. Moreover, the method is fast with respect to analysis time, covering wide concentration ranges when compared to reported chromatographic techniques.
ACKNOWLEDGEMENTS: The authors are thankful to the management and authorities of Department of pharmaceutical Analysis, Care College of pharmacy for providing the necessities required for carrying out the present research work and also MSN laboratories, Hyderabad for providing the gift sample of Prasugrel.
REFERENCES:
1. Konari S.N, Jacob J.T.Development and Validation of RP-HPLC method for the Simultaneous Estimation of Prasugrel and Aspirin in bulk and tablet dosage form. Inventi impact, pharmaceutical analysis and quality assurance.2013; 3: 52-58 2. Deepak Kumar Jain, Nilesh Jain, JitendraVerma, RP-HPLC
Method for Simultaneous Estimation of Aspirin and Prasugrel in Binary Combination. International Journal of Pharmaceutical Sciences and Drug Research. 2012;4(3): 218-221.
3. Ojikumar Lukram, MukundZarapkar, Chandan Kumar Jha, ShivajiParmar, Keshav S. Tomar, AmitHande. Electrospray ionization LC-MS/MS validated method for the determination of the active metabolite (R-138727) of prasugrel in human plasma and its application to a bioequivalence study. Drug Testing and Analysis. 2012; 4(2): 158-166.
4. SM Patel, CN Patel, VB Patel, Development and validation of spectrometric method for simultaneous estimation of Aspirin and Prasugrel in tablet dosage form. American Journal of Pharmaceutial Technology and Research. 2012;2(3): 819-827. 5. S. J. Parmar, B. A. Patel and A. P. Jain, Development and Validation of RP-HPLC Method for Prasugrel. Journal of Chemical and Pharmaceutical Research. 2012; 4(7): 3373-3376.
6. Bhavani V, Jameelunnisa B, Prakash M and Siva Rao T, Stability Indicating RP-UPLC method for the estimation of Prasugrel Hcl in pharmaceutical formulations. International Journal of Biology, Pharmacy and Allied Sciences, 2012; 1(7): 946-956.
7. Viralkumar J. Modi and Prashant L. Pingale, Development and validation of analytical method for estimation of prasugrel hydrochloride in bulk and in pharmaceutical formulations.
International journal of pharma and biosienes. 2012;3(4): 292-298.
8. V. Krishnaiah and Y.V Rami Reddy. Development and validation of HPLC method for the simultaneous determination of aspirin. Journal of Chemical and Pharmaceutical Research. 2012; 4(3): 2349-2353.
9. Srikanth I, Sharma P, Vijayabharathi K, Raju M, Lakshmi Naik M and Nagarjuna KA Validated Reverse phase HPLC method for the estimation of prasugrel hydrochloride in pharmaceutical dosage forms, Journal of Innovative trends in pharmaceutical sciences. 2011; 2(5): 140-148.
10. Mohammed Ishaq B, VanithaPrakash K and Krishna Mohan G, Development and validation of HPLC method for determination of prasugrel in bulk and its pharmaceutical formulation. Journal of chemical and pharmaceutical research. 2011; 3(4): 404-409.
11. Kishore Reddy Seerapu R, Venkateswara Rao A, Lavanya P, Pani Kumar AD, Ramakrishna K, Subba Reddy P.V, Development of validated RP-HPLC Method for the estimation of PrasugrelHcl in pure and pharmaceutical formulations, Journal of Pharmacy Research. 2011; 4(9): 3105-3107.
12. Ashok Kumar A, Anil Kumar A and GowriSankar D, Development, estimation and validation of prasugrel in bulk and in its pharmaceutical formulation by UV-Vis spectroscopic method. An International Journal of Advances in Pharmaceutical Sciences. 2011;2(1): 37-39.
13. Harshini B, SVR Alekhya, G Manasa, K Vanitha Prakash, Extractive Spectrophotometric Estimation Of Prasugrel In Pharmaceutical Formulation, Research Journal of Pharmaceutical, Biological and Chemical Sciences. 2011; 2(3): 426-429.
14. Ravi Pratap Pulla, Sastry BS, Rajendra Prasad Y and Appala Raju N, Estimation of prasugrel in tablet dosage form by RP-HPLC, International Journal of Chemistry Research. 2011; 2(3): 34-36.
15. Borole TC, Mehendre R , Damle M.C, Bothara K.G, Development and validation of stability indicating HPTLC method for determination of prasugrel. Journal of Chemical and Pharmaceutical Research. 2010; 2(4): 907-913.
16. Borole TC, Mehendre R , Damle M.C, Bothara K.G, Development and validation of stability indicating HPTLC method for determination of prasugrel. Journal of Chemical and Pharmaceutical Research. 2010;2(4): 907-913.
17. Hassan H. Hammud, Fawzy A. El Yazbi, Mohamad E. Mahrous, Ghassan M. Sonji and Nada M. Sonji. Stability-indicating Spectrofluorimetric and RP-HPLC methods for determination of Aspirin and Dipyridamole in combination. The open spectroscopy journal. 2008; 2: 19-28.
18. Ismail, R Rajavel, M Ganesh, M Jagadeeswaran, K Srinivasan, J Valarmathi and T Sivakumar. RP-HPLC method for simultaneous determination of Aspirin, Atorvastatin and Pioglitazone in capsule dosage form. Asian Journal of Research chemistry. 2008; 1(1): 40-42.
All © 2014 are reserved by International Journal of Pharmaceutical Sciences and Research. This Journal licensed under a Creative Commons Attribution-NonCommercial-ShareAlike 3.0 Unported License.
This article can be downloaded to ANDROID OS based mobile. Scan QR Code using Code/Bar Scanner from your mobile. (Scanners are available on Google Playstore)
How to cite this article: