IJPSR (2012), Vol. 3, Issue 1 (Research Article)
Received on 11 September, 2011; received in revised form 18 October, 2011; accepted 26 December, 2011
DEVELOPMENT AND EVALUATION OF MICROBALLOONS OF PIOGLITAZONE HYDROCHLORIDE USING EUDRAGIT S-100
Nishant S. Gandhi*, Satish V. Shirolkar, Mukund G. Tawar
Department of Pharmaceutics, Padm., Dr. D. Y. Patil Institute of Pharmaceutical Sciences and Research, Pimpri, Pune-411018, Maharashtra, India
ABSTRACT
Various approaches have been used to retain the dosage form in the stomach as a way of increasing the gastric residence time (GRT), including floatation systems; high-density systems; mucoadhesive systems; magnetic systems; unfoldable, extendible, or swellable systems; and superporous hydrogel systems. The aim of this study was to prepare and evaluate floating microspheres of Pioglitazone hydrochloride for the prolongation of gastric residence time. The microspheres were prepared by emulsion solvent diffusion-evaporation method using Eudragit S-100. A full factorial design was applied to optimize the formulation. Preliminary studies revealed that the concentration of polymer and stirring speed significantly affected the characteristics of floating microspheres. The optimum batch of microspheres exhibited some rough surfaces with good flow and packing properties, prolonged sustained drug release, remained buoyant for more than 10 hrs, high entrapment efficiency upto 89%w/w. Scanning electron microscopy confirmed the hollow structure with particle size in the order of 270 µm. The studies revealed that decrease in particle size of the microspheres increase the drug release from the floating microspheres. The results of 32 full factorial design revealed that the Polymer: Drug (P: D) ratio (X1) and stirring speed (X2) significantly affected drug entrapment efficiency, percentage release after 8 h and particle size of microspheres.
INTRODUCTION: Drugs that are easily absorbed from the gastrointestinal tract (GIT) and having a short half-life are eliminated quickly from the blood circulation. To avoid this problem, the oral controlled-release (CR) formulations have been developed as these will release the drug slowly into the GIT and maintain a constant drug concentration in the serum for a longer period of time. Such oral drug delivery devices have a restriction due to the gastric retention time (GRT), a physiological limitation.
An incomplete release of the drug and shorter residence time of the dosage forms in the upper GIT, a
prominent site for the absorption of many drugs, will lead to lower bioavailability 1. Therefore, prolonged gastric retention is important in achieving control over the GRT because this helps to retain the CR system in the stomach for a longer and predicted time. In addition, this improves the bioavailability of the basic drugs that have poor solubility in higher pH 2.
Several approaches have been developed to prolong the residence time of dosage forms in the stomach 3. Various approaches have been used to retain the dosage form in the stomach as a way of increasing the gastric residence time (GRT), including floatation Keywords:
Pioglitazone hydrochloride, Eudragit S-100, Solvent diffusion evaporation,
Floating microspheres, Polymer: Drug ratio
Correspondence to Author:
Nishant Gandhi
systems; high-density systems; mucoadhesive systems; magnetic systems; unfoldable, extendible, or swellable systems; and superporous hydrogel systems 4. Floating drug delivery systems (FDDS) or hydrodynamically balanced systems (HBS) are among the several approaches that have been developed to increase the GRT of dosage forms. Both single and multiple unit systems have been developed. The single- unit floating systems are more popular but have a disadvantage owing to their ‘all-or-nothing’ emptying process, leading to high variability of the gastrointestinal transit time 5, 6.
In contrast, multiple-unit particulate dosage forms (e.g., microspheres) have the advantages that they pass uniformly through the gastrointestinal tract (GIT) to avoid the vagaries of gastric emptying and provide an adjustable release, thereby reducing the inter-subject variability in absorption and risk of local irritation. Recently, hollow microspheres with a lower density than that of the GI fluids were adopted7. The floating microspheres were prepared by the emulsion solvent diffusion– evaporation technique using different polymer solution systems 8, 9.
Pioglitazone hydrochloride (PH) acts as an agonist at peroxisome proliferator-activated receptors (PPARs) in target tissues for insulin action, such as adipose tissue, skeletal muscle, and liver. Activation of the PPAR-g regulates the transcription of insulin-responsive genes involved in the control of glucose production, transport, and utilization. In this manner, PH enhances tissue sensitivity to insulin 10. PH has all the requisite characteristics suitable for developing an FDDS, which includes the decrease in solubility of PH with increase in pH and the half life of PH is 3-5 hrs so is eliminated quickly with conventional dosage form. Hence, floating microspheres were prepared to improve the bioavailability and achieve steady-state plasma concentration of the drug.
MATERIALS AND METHODS:
Materials: Pioglitazone hydrochloride was obtained as gift sample from Aurobindo Pharma, Hyderabad. Eudragit S-100 was obtained as a gift sample from Evonik Degusa Mumbai. Dichloromethane (DCM) and Ethanol (ETN) were purchased from Research labs, Pune.
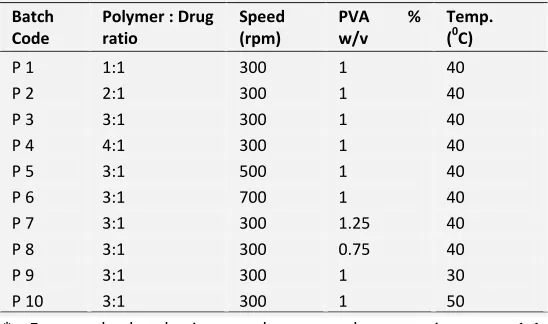
Preparation of Floating Microspheres: The floating microspheres were prepared by using the emulsion solvent diffusion-evaporation method similar to one reported by kawashima et al., 8. In the preliminary trials, PH and Eudragit S100 were dissolved in Ethanol: Dichloromethane mixture 10:10 ml (1:1 ratio) with continuous stirring. The prepared dispersion was emulsified into 200 ml in distilled water containing 1%w/w PVA, using mechanical stirrer at variable speed for 1 hour. Temperature of the system was maintained at 400 C. Microspheres were filtered and washed with water to remove traces of PVA. The solid microspheres were dried overnight at 600C in hot air oven and then weighed. The resultant microspheres were filtered and dried. P1 to P10 were the preliminary batches prepared using different levels of Polymer: drug ratio, Propeller Speed PVA % and Temperatute as shown in
Table 1.
TABLE 1: OPTIMIZATION OF PROCESS AND FORMULATION OF PIOGLITAZONE EUDRAGIT S-100 MICROSPHERES (PRELIMINARY BATCHES)
Batch Code
Polymer : Drug ratio
Speed (rpm)
PVA % w/v
Temp. (0C)
P 1 1:1 300 1 40
P 2 2:1 300 1 40
P 3 3:1 300 1 40
P 4 4:1 300 1 40
P 5 3:1 500 1 40
P 6 3:1 700 1 40
P 7 3:1 300 1.25 40
P 8 3:1 300 0.75 40
P 9 3:1 300 1 30
P 10 3:1 300 1 50
* For each batch inner phase solvent ratio was 1:1 (dichloromethane : Ethanol); Inner phase to external phase solvent ratio was 1:10 (20:200)
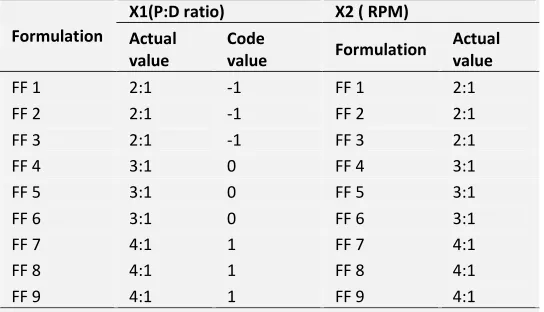
[image:2.612.314.588.356.518.2]Design expert software (8.0.2) and intensive grid search was performed over the experimental domain to locate five optimum formulations (S1 – S5). These
five formulations were then formulated and used to validate the obtained polynomial equation model. TABLE 2: 32 FULL FACTORIAL DESIGN FOR OPTIMIZATION OF EUDRAGIT S-100 PIOGLITAZONE HYDROCHLORIDE FLOATING MICROSPHERES
Formulation
X1(P:D ratio) X2 ( RPM)
Actual value
Code
value Formulation
Actual value
FF 1 2:1 -1 FF 1 2:1
FF 2 2:1 -1 FF 2 2:1
FF 3 2:1 -1 FF 3 2:1
FF 4 3:1 0 FF 4 3:1
FF 5 3:1 0 FF 5 3:1
FF 6 3:1 0 FF 6 3:1
FF 7 4:1 1 FF 7 4:1
FF 8 4:1 1 FF 8 4:1
FF 9 4:1 1 FF 9 4:1
* For each batch conc. of PVA solution was 1% w/v, Temp was kept at 400C and internal phase solvent ratio was 1:1. (Dichloromethane: ethanol). Drug weight was taken as 200 mg for all batches.
Independent variables Dependent variables
X1 = polymer : Drug ratio Y1 = % drug release after 8 hrs
X2 = RPM Y2 = % Floating capacity
Y3 = Microsphere size Y4= % Entrapment efficiency
Evaluation of formulations subjected to optimization:
In-vitro Drug Release Studies: In-vitro drug release
studies were carried out using the rotating basket method specified in USP XXIII dissolution apparatus (Apparatus I) with 100 rpm speed at 37 ± 0.50C). Dissolution was carried out in 0.1 N HCl. The weighed amount of Microspheres were wrapped in muslin cloth and kept in baskets. The drug release studies were carried out in 900 ml of 0.1N HCl as dissolution media. 5 ml Samples were withdrawn at predetermined time interval (1 h) from each dissolution vessel, filtered using Whatman filter paper, samples were analyzed for drug at 270 nm using a UV visible double beam spectrophotometer (Model-UV1701, Shimadzu, Japan).
In-vitro evaluation of Floating Ability: Floating
behavior of hollow microspheres was studied using a USP dissolution test apparatus II by spreading the
microspheres (50 mg) on 900 ml of 0.1 N HCl containing 0.02% Tween 80 as surfactant. The medium was agitated with a paddle rotating at 100 rpm and maintained at 37°C. After 10 hours, both the floating and the settled portions of microspheres were collected separately. The microspheres were dried and weighed. The percentage of floating microspheres was calculated using the following equation 10:
Weight of Floating Microspheres % Floating Microspheres = X 100
Total weight of microspheres
Microsphere size: The size was measured using an optical microscope and the mean microsphere diameter was calculated by measuring 100 particles with the help of a calibrated ocular micrometer 11.
Percentage yield of microspheres: Percentage yield of microspheres was calculated using the following formula;
The amount of microspheres obtained
Percent Yield = X 100
The amount (g) of Non-volatile material taken
% Entrapment efficiency: Accurately weighed 10 mg of crushed microspheres were dissolved in 0.1N HCl, and then transferred to 100 ml volumetric flask. The volume was made up to 100mL with 0.1N HCl. The solution was filtered using Whatman filter paper no. 41. The samples were assayed for drug content using UV spectrophotometry at 270 nm.
Entrapment efficiency of microspheres was calculated using the following formula;
The amount of Drug Encapsulated Entrapment Efficiency = X 100
Theoretical amount of Drug
[image:3.612.28.300.167.323.2]coated samples were placed in the scanning electron microscope (JSM-6360A, JEOL and Tokyo, Japan) chamber. The samples were then randomly scanned and photomicrographs were taken at the acceleration voltage of 20 kV and original magnification for 30 to 500. To investigate the further internal morphology, microspheres were cut into two pieces.
Differential Scanning Calorimetry: The possibility of any interaction between Pioglitazone and Eudragit S-100 and other excipients during the microencapsulation process was assessed by carrying out the thermal analysis on microspheres using Differential Scanning Calorimetry. Samples were accurately weighed and put into aluminum pans and then sealed with aluminum lids. The thermograms of the samples were obtained at a scanning rate of 100C/min. The obtained thermographs were used to decide any interaction between Pioglitazone and polymers.
X-Ray Diffraction Studies: X-ray diffraction study was performed in Philips PW3710 Analytical XRD. X-ray diffractometer using Cu K 2α rays with a voltage of 40 kV and a current of 25 mA. Samples were scanned for 2θ from 5 to 50o. Diffraction pattern for Pioglitazone, Pioglitazone- Eudragit S100 microspheres were obtained.
Stability Studies 12, 13: During the storage if one performs studies at normal temp it will take a longer time and hence it would be convenient to carry out the accelerated stability studies where the product is stored under extreme conditions of temperature. Optimized formulation sealed in aluminum packaging coated inside with polyethylene, and various samples were kept in the humidity chamber maintained at 40°C and 75% RH for 2 months. At the end of studies, samples were analyzed for the physical appearance, drug content and drug release.
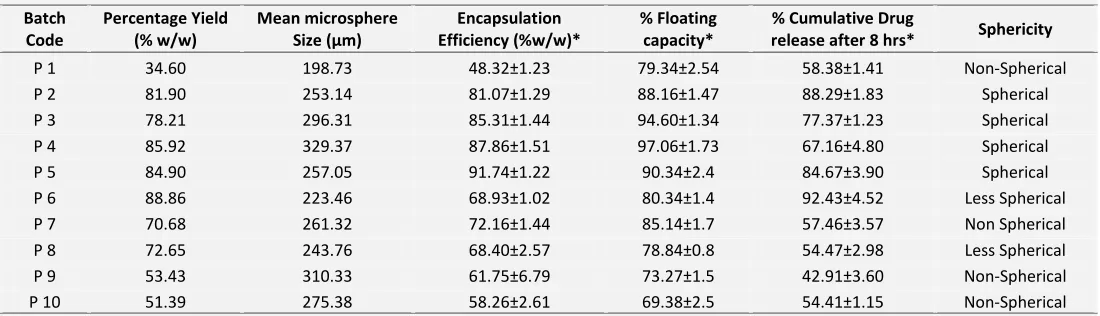
[image:4.612.32.582.375.533.2]RESULT AND DISCUSSION:
TABLE 3: RESULTS OF PRELIMINARY TRIAL BATCHES OF PIOGLITAZONE LOADED EUDRAGIT S-100 MICROSPHERES Batch
Code
Percentage Yield (% w/w)
Mean microsphere Size (µm)
Encapsulation Efficiency (%w/w)*
% Floating capacity*
% Cumulative Drug
release after 8 hrs* Sphericity
P 1 34.60 198.73 48.32±1.23 79.34±2.54 58.38±1.41 Non-Spherical
P 2 81.90 253.14 81.07±1.29 88.16±1.47 88.29±1.83 Spherical
P 3 78.21 296.31 85.31±1.44 94.60±1.34 77.37±1.23 Spherical
P 4 85.92 329.37 87.86±1.51 97.06±1.73 67.16±4.80 Spherical
P 5 84.90 257.05 91.74±1.22 90.34±2.4 84.67±3.90 Spherical
P 6 88.86 223.46 68.93±1.02 80.34±1.4 92.43±4.52 Less Spherical
P 7 70.68 261.32 72.16±1.44 85.14±1.7 57.46±3.57 Non Spherical
P 8 72.65 243.76 68.40±2.57 78.84±0.8 54.47±2.98 Less Spherical
P 9 53.43 310.33 61.75±6.79 73.27±1.5 42.91±3.60 Non-Spherical
P 10 51.39 275.38 58.26±2.61 69.38±2.5 54.41±1.15 Non-Spherical
*All values are expressed as Mean ±SD, n = 3.
Preliminary Trial Batches: As the Polymer: Drug ratio was increased from 1:1 to 4:1, encapsulation efficiency increased from 48.83 %w/w to 87.86 %w/w because at higher polymer concentration, enough quantity was available to form the microspheres. At ratio 1:1, not enough polymers were present to form microspheres, thus the yield 34% and encapsulation efficiency 38.83% was low. Increase in Polymer: Drug ratio from 1:1 to 4:1 resulted in increase in the diameter of microspheres from 198.7 µm to 329.37 µm. With increase in polymer: drug ratio, sphericity was found to be increased due to proper coating of the polymer. For optimization Polymer: Drug ratio was chosen as
independent variable (X1) at three levels 2:1, 3:1 and
4:1 for further studies.
This is because smaller emulsion droplets were produced through stronger shear forces and increased turbulence. Encapsulation efficiency was decreased from 85.31 to 68.93 % w/w with an increase in the stirring speed. This is because as speed was increased, attrition between particles resulted in smaller size which increased probability of contact between the internal phase and the external phase resulting in drug loss. Thus for optimization speed was chosen as the independent variable (X2) at three levels i.e. 300, 450 &
600 rpm.
Temperature showed significant effect on % yield of microspheres. As temperature was increased from 30oC to 40oC (P9 and P3, refer Table 3), yield increased from 53.43 to 78.21 % % w/w as shown in Table 3. At 300C, agglomeration was observed since this temperature was insufficient to rapidly evaporate aqueous internal phase and at 50oC due to rapid evaporation of solvent system did not get enough time to stabilize emulsion resulting into non-spherical microspheres and the yield was also less (51.39%). At 30oC, 61.75% w/w encapsulation efficiency was observed, it increased to 85.31 %w/w at 40oC and at 50oC it again decreased to 58.26 %w/w. This is because as the temperature is increased solvent evaporated rapidly providing insufficient mixing time resulting into large placebo microspheres. Considering sphericity,
stirring time and encapsulation efficiency, 40oC was selected as the temperature for further study.
The yield of microspheres was significantly changed with change in stabilizer (PVA) concentration. When stabilizer concentration increased from 1 to 1.25 %w/v yield of microspheres batches decreased from 78.21 to 70.68 %w/w since with increase in stabilizer polymer aggregate around the propeller and shaft of the stirrer. So the stabilizer concentration was selected as fixed (1 %w/v) for all the following batches.
Evaluation of formulations subjected to optimization:
This floating microparticulate system was developed by emulsion solvent diffusion–evaporation method by using DCM and ETN as solvents. Finely dispersed droplets of the solution of drug and polymer solidify in the aqueous phase due to the diffusion of ETN. Evaporation of DCM from the solidified droplets leaves the cavity in the microspheres filled with water. During the drying procedure, the cavity inside each microsphere becomes filled with air, generating the microballoon.
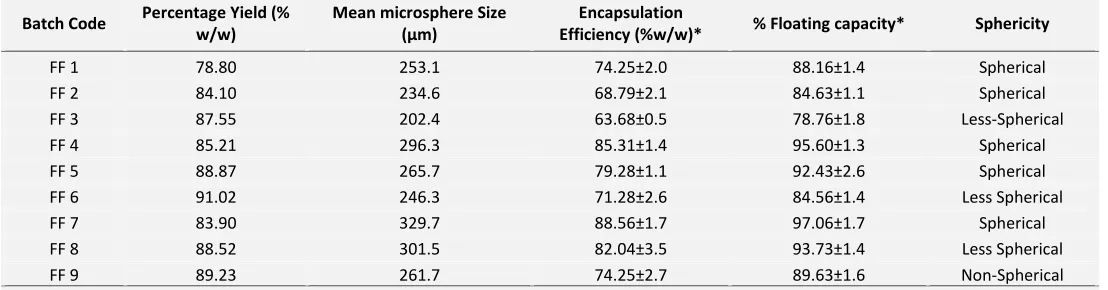
[image:5.612.31.585.484.629.2]Total nine batches of Pioglitazone loaded Eudragit S-100 microspheres were prepared and these batches were evaluated for % yield, microsphere size, % entrapment efficiency , % floating capacity, % drug release 8h and sphericity as shown in Table 4.
TABLE 4: RESULTS OF BATCHES OF PIOGLITAZONE LOADED EUDRAGIT S-100 MICROSPHERES Batch Code Percentage Yield (%
w/w)
Mean microsphere Size (µm)
Encapsulation
Efficiency (%w/w)* % Floating capacity* Sphericity
FF 1 78.80 253.1 74.25±2.0 88.16±1.4 Spherical
FF 2 84.10 234.6 68.79±2.1 84.63±1.1 Spherical
FF 3 87.55 202.4 63.68±0.5 78.76±1.8 Less-Spherical
FF 4 85.21 296.3 85.31±1.4 95.60±1.3 Spherical
FF 5 88.87 265.7 79.28±1.1 92.43±2.6 Spherical
FF 6 91.02 246.3 71.28±2.6 84.56±1.4 Less Spherical
FF 7 83.90 329.7 88.56±1.7 97.06±1.7 Spherical
FF 8 88.52 301.5 82.04±3.5 93.73±1.4 Less Spherical
FF 9 89.23 261.7 74.25±2.7 89.63±1.6 Non-Spherical
*All values are expressed as Mean ±SD, n = 3
% Yield of Microspheres: - The effect of P: D ratio and speed was determined. The % yield increased from 78.8% to 87.55 for P: D ratio of 2:1 with increase in speed from 300 to 600 rpm. Similarly the %yield increases for the rest of P: D ratio with increase in speed.
%Encapsulation Efficiency: Formulations showed good % entrapment efficiency with maximum upto 88.56% (Table 4). The % entrapment efficiency decreases from 74.25 to 63.68%, 85.31 to 71.28% and 88.56 to 74.25% for 2:1, 3:1 and 4:1 P: D ratio, with increase in speed from 300 to 600 rpm. With increase in P:D ratio from 2:1 to 4:1 the % encapsulation efficiency increased from 74.15 to 88.56% at 600 rpm, this may be because as more amount of polymer is available to entrap the drug.
% floating capacity: The purpose of preparing floating microspheres was to extend the GRT of the drug. The microspheres containing Eudragit S-100 showed good floating ability for more than 10 hours (Table 4) due to insolubility of Eudragit S-100 polymer in SGF (pH 1.2). With increase in speed as the particle size decreases the % floating capacity also decreases, which indicates that larger the particle size, the longer the floating time.
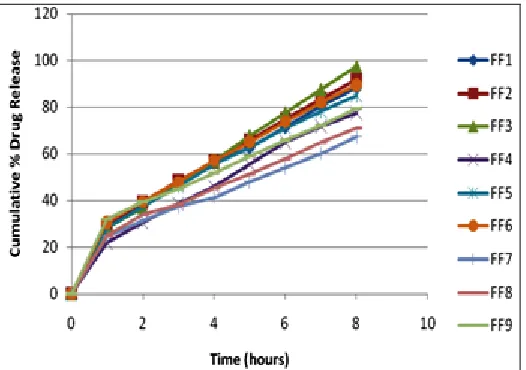
[image:6.612.28.291.531.716.2]% Drug release: At different P: D ratio, when speed was increased, the drug release after 8 hours from microsphere is increased for each levels of P: D ratio. It can also be seen that for the different levels -1 (2:1), 0(3:1) and 1(4:1) of P: D ratio the % drug release decreased (88.43% for FF1, 77.40% for FF4 and 67.16% for FF7) at fixed RPM. As the RPM increased the particle size increased which leads to decrease in drug release because release of drug from smaller particle is faster than larger particle as the area available is more for drug release. Fig. 1 shows the plot of cumulative % drug release vs time graph for the 9 formulations.
FIG. 1: COMPARATIVE CUMULATIVE % DRUG RELEASE PROFILES OF FORMULATIONS FF1 TO FF9
Data Analysis: On the basis of the data obtained from the formulations subjected to optimization, a general statistical model can be depicted with respect to the above data. The model developed can be characterized by using the polynomial equation representing the respective response data. This can be given as follows:
Drug Release after 8 hrs (Y1) = 83.01 - 9.99 X1 +5.55X2
...1
% floating capacity (Y2) = 89.41 + 4.81 X1 - 4.63 X2
...2
Microsphere Size (Y3) = 265.71 +33.79 X1 - 28.11 X2
.…...3
% Entrapment Efficiency (Y4) = 77.48 +8.00 X1- 6.18X2
...4
From the above polynomial equations, response surface graphs and contour plots of the respective responses were generated, which were then used to predict the responses of dependent variables at the intermediate levels of independent variables.
The response surface plot (Fig. 2a) and contour plot (Fig. 2b) indicated the relative effect of increasing P: D ratio (X1) and RPM (X2) on % drug release of
microspheres (Y1). With increase in RPM (X2), % drug
release was increased and with increase in P: D ratio % drug release is decreased this can be confirmed from equation 1.
2b
FIG. 2(a-b): VARIOUS PLOTS SHOWING INFLUENCE OF RPM AND P: D RATIO ON THE % DRUG RELEASE OF MICROSPHERES a) RESPONSE SURFACE PLOT AND b) CONTOUR PLOT
At different levels (-1, 0, 1) of P:D ratio, when RPM was increased, the drug release (after 8 hours) from microsphere is increased for each levels of P:D ratio( 88.43 to 97.50% for FF1 to FF3 , 77.40 to 89.51% for FF4 to FF6 and 67.16 to 79.26% for FF7 to FF9) It can also be seen that for different levels -1, 0 and 1 of P:D ratio the % drug release decreases (88.43% for FF1, 77.40 for FF4 and 67.16 for FF7). As the RPM increases the Particle size increases which causes the decrease in drug release because release of drug from smaller particle is faster than larger particle as the area available is more for drug release.
The surface response plot (Fig. 3a) and contour plot (Fig. 3b) showed decrease in response Y2 (% Floating)
as X2 (Rpm) was increased from lower level to higher
level. At lower level (-1) of RPM % floating capacity increased with increase in polymer: drug ratio i. e. at 300 RPM, when polymer to drug ratio was increased from 2: 1 to 4: 1 % floating capacity was increased from 88.16% to 97.06%, this is because with increase in polymer: drug ratio there is an increase in microsphere size which leads to better floating capacity at same RPM.
For other two levels same effect was observed. This can be further confirmed by equation 2 which showed negative sign for variable X2 and positive sign for
variable X1(P:D ratio) which indicated that increase in
X2(rpm) gives decrease in response and on increase of
X1 there is an increase in response.
3a
3b
Fig. 3(a-b): VARIOUS PLOTS SHOWING INFLUENCE OF RPM AND P: D RATIO ON %FLOATING CAPACITY OF MICROSPHERES a) RESPONSE SURFACE PLOT AND b) CONTOUR PLOT
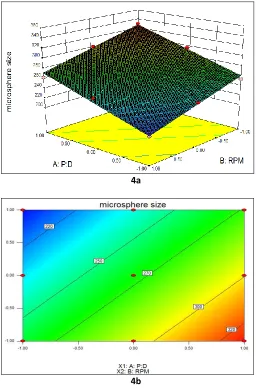
Effect of variable X1 & X2 on Microsphere size (Y3) can
be explained with response curve (Fig. 4a) and contour plot (Fig. 4b). Increase in Polymer: Drug ratio (X1)
increased microsphere size (Y3) at same X1 due to
availability of increased amount of polymer to form microspheres. Increase in RPM (X2) showed the
decrease in response (Y3) this is because at higher level
[image:7.612.318.581.39.440.2] [image:7.612.34.291.42.230.2]
4a
4b
FIG. 4(a-b): VARIOUS PLOTS SHOWING INFLUENCE OF RPM AND P: D RATIO ON THE SIZE OF MICROSPHERES a) RESPONSE SURFACE PLOT AND b) CONTOUR PLOT
Response surface plot (Fig. 5a) and contour plot (Fig. 5b) showed a linear effect of X1 & X2 on % entrapment
efficiency (Y4). At all three levels of RPM (X2), when
Polymer: Drug ratio was increased from lower level (-1) to higher level (1), there was linear increase in % entrapment efficiency, this is because as there is an increase in polymer concentration the sufficient amount of polymer was present to entrap the drug thus the entrapment efficiency was increased.
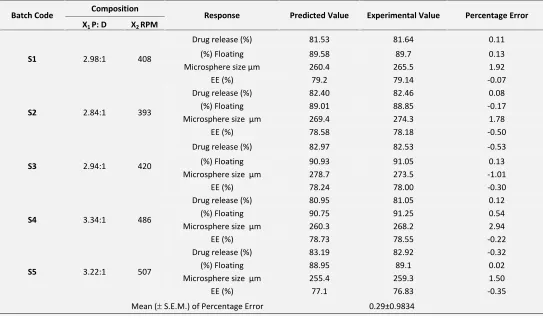
Validation of Optimum Microspheres Formulations:
For all 5 checkpoint formulations shown in Table 5, the results of the physical evaluation and microspheres drug content and percentage cumulative drug release were carried out. Table 5 lists the composition of the checkpoints, the predicted and experimental values of
all the response variables, and the percentage error in prognosis.
5a
5b
FIG. 5(a-b): VARIOUS PLOTS SHOWING INFLUENCE OF RPM AND P: D RATIO ON % ENTRAPMENT EFFICIENCY OF MICROSPHERES a) RESPONSE SURFACE PLOT AND b) CONTOUR PLOT
Fig. 6(a-d) shows linear correlation plots between the observed and predicted values of % drug encapsulation efficiency, Drug Rel8h, % floating capacity and
[image:8.612.26.285.41.430.2] [image:8.612.311.577.76.491.2]TABLE 5: COMPARISON OF EXPERIMENTAL RESULTS WITH PREDICTED RESPONSES OF MICROSPHERE FORMULATIONS
Batch Code Composition Response Predicted Value Experimental Value Percentage Error
X1 P: D X2 RPM
S1 2.98:1 408
Drug release (%) 81.53 81.64 0.11
(%) Floating 89.58 89.7 0.13
Microsphere size µm 260.4 265.5 1.92
EE (%) 79.2 79.14 -0.07
S2 2.84:1 393
Drug release (%) 82.40 82.46 0.08
(%) Floating 89.01 88.85 -0.17
Microsphere size µm 269.4 274.3 1.78
EE (%) 78.58 78.18 -0.50
S3 2.94:1 420
Drug release (%) 82.97 82.53 -0.53
(%) Floating 90.93 91.05 0.13
Microsphere size µm 278.7 273.5 -1.01
EE (%) 78.24 78.00 -0.30
S4 3.34:1 486
Drug release (%) 80.95 81.05 0.12
(%) Floating 90.75 91.25 0.54
Microsphere size µm 260.3 268.2 2.94
EE (%) 78.73 78.55 -0.22
S5 3.22:1 507
Drug release (%) 83.19 82.92 -0.32
(%) Floating 88.95 89.1 0.02
Microsphere size µm 255.4 259.3 1.50
EE (%) 77.1 76.83 -0.35
Mean ( S.E.M.) of Percentage Error 0.29±0.9834
Upon comparison of the observed responses with that of the anticipated responses, the Mean ( S.E.M.) of Percentage Error was found to be 0.29±0.9834.
Thus, the low magnitudes of error as well as the significant values of R2 in the current study indicated a high prognostic ability of floating microspheres formulations of Pioglitazone using RSM optimization.
a
b
d
FIG. 6(a-d): LINEAR PLOTS BETWEEN OBSERVED AND PREDICTED VALUES OF (a) % DRUG RELEASE (b) % FLOATING CAPACITY (c) MICROSPHERE SIZE (d) %ENTRAPMENT EFFICIENCY
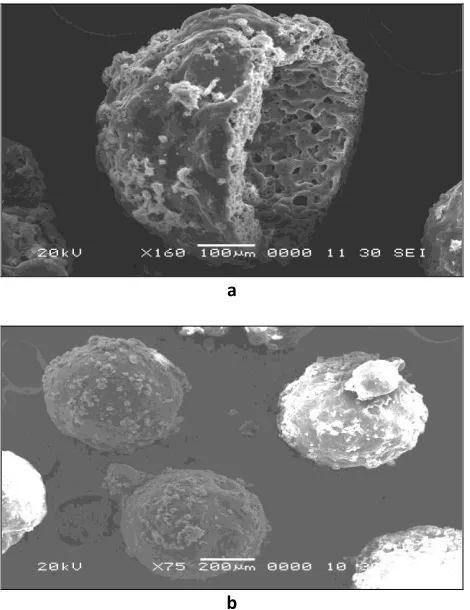
Morphology:
Size and Shape: Morphology of microsphere batch S2
was examined by scanning electron microscopy. The
fig. 7a shows the view of hollowness of microsphere, the top view of the microspheres showed a spherical structure with a slight rough surface morphology as shown in Fig. 7c and fig. 7b exhibited a range of microspheres.
a
b
c
FIG. 7(a, b, c): SCANNING ELECTRON MICROSCOPY (SEM) OF PIOGLITAZONE LOADED EUDRAGIT S-100 CELLULOSE MICROSPHERES. (a) VIEW SHOWING HOLLOW MICROSPHERE (b) SMOOTH SURFACE OF THE MICROSPHERES (c) TOP VIEW OF MICROSPHERES SHOWING SPHERICITY
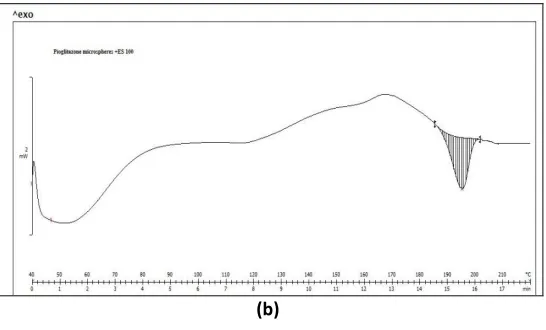
Differential scanning Calorimetry: The differential scanning Calorimetry was carried out for the Pioglitazone Eudragit S100 microspheres, to study the compatibility or any interaction of drug and polymer after the formation of microspheres and is shown in
Fig. 8(a-b), endothermic peak of pure drug was found at 192-193°C. The peak obtained for the Pioglitazone Eudragit S100 microspheres is at 194-195°C for the drug.
Thus, there was no significant change in the position of peak of the drug in the Pioglitazone Eudragit S100 microspheres but there is change in the relative intensities of the peak of the drug as there is less amount of drug in the microspheres. This indicates that the drug is only physically entrapped in the polymer matrix and there is no interaction between drug and polymers. It confirmed the fact that during the microencapsulation process, Pioglitazone remained suspended in the matrix of Eudragit S100 even after evaporation of solvent during the process.
[image:10.612.41.288.43.207.2] [image:10.612.340.562.43.187.2] [image:10.612.46.281.408.713.2] [image:10.612.312.589.586.734.2](b)
FIG. 8(a-b): DSC THERMOGRAPH OF a) PIOGLITAZONE HYDROCHLORIDE PURE DRUG b) PIOGLITAZONE EUDRAGIT S-100 LOADED MICROSPHERES
X-Ray Diffraction Study: X-ray diffraction pattern of Pioglitazone (pure drug), Pioglitazone Eudragit S100 microspheres are shown in Fig. 9 (a) and (b). Fig. 9 (b) contains peaks that are associated with crystalline nature of Pioglitazone hydrochloride, suggesting that the drug is crystalline.
(a)
(b)
FIG. 9(a-b): X-RAY DIFFRACTION PATTERN OF a) PIOGLITAZONE (PURE DRUG) b) PIOGLITAZONE EUDRAGIT S-100 LOADED MICROSPHERES
Stability Study: The stability studies were carried out on optimized formulation S2. The formulation was
stored at 40 ± 2oC/75 ± 5 % RH (Climatic zone IV condition for accelerated testing) for 2 months to assess its stability. After 15, 30 and 60 days samples were withdrawn and retested for physical appearance, % drug content, % drug release and %floating capacity studies as shown in Table 6 and the results indicated that the formulation was able to retain its stability for 2 months.
TABLE 6: % DRUG CONTENT, %FLOATING CAPACITY AND % DRUG RELEASE8H OF OPTIMIZED BATCH S3 AFTER 2 MONTH STORAGE.
Days Drug content
%
Floating capacity %
% Drug release after 8hrs Before Storage
0 day 78.2 88.9 82.5
After Storage*
15 78.0±1.9 88.7±1.8 82.2±2.0
30 77.8±2.7 88.1±1.4 82.0±1.8
60 77.2±2.4 87.3±2.9 81.4±1.4
*Storage at 40°C and 75% RH for two months (n = 3)
CONCLUSION: The floating microspheres of
Pioglitazone hydrochloride were prepared and optimized using the 32 factorial design. The concentration of Eudragit S-100 had significant impact on drug entrapment efficiency and particle size. The results of a 32 full factorial design revealed that the P: D ratio (X1) and stirring speed (X2) significantly affected
the dependent variables such as drug entrapment efficiency, drug rel8h and particle size of microspheres.
Evaluation of five formulations, chosen as optimal from grid searches, indicated that the formulation S2
(Polymer: drug ratio 2.84:1 and stirring speed: 393 rpm) fulfilled maximum requisites because of better drug entrapment efficiency, sustained release of the drug and optimum particle size.
[image:11.612.28.301.41.206.2] [image:11.612.312.589.238.330.2] [image:11.612.27.301.360.696.2]Faculty of Pharmaceutics, Padm. Dr. D. Y. Patil Institute of Pharmaceutical Sciences and Research, Pimpri, Pune, for his valuable guidance, instructions and dedicated efforts to make this work possible.
REFERENCES:
1. Willing, P. G. and Dobrinska, M. R. Robinson, J. R. and Lee, V. H. L. (eds) Dosing Considerations and Bioavailability Assessment of Controlled Drug Delivery Systems. Controlled Drug Delivery: Fundamentals and Applications 1987; 6 , pp. 253-291. Marcel Dekker, Inc. , New York
2. Moes, A. J. Floating Delivery and Other Potential Gastric Retaining Systems. Current Status on Targeted Drug Delivery to the Gastrointestinal Tract , Capsugel Symposia Series . 1993; pp. 97-112.
3. Singh NB, Kim KH. Floating drug delivery systems: An approach to oral controlled drug delivery via gastro retention. J Control Release, 2000; 63:235–59.
4. Arora S, Ali J, Ahuja A, Khar RK, Baboota S. Floating drug delivery systems: A review. AAPS PharmSciTech, 2005; 6(3): E372–90.
5. Deshpande AA, Rhodes CT, Shah NH, Malick AW. Controlled release drug delivery systems for prolonged gastric residence: An overview. Drug Dev Ind Pharm, 1996; 22:531–39.
6. Srivastava AK, Ridhurkar DN, Wadhwa S. Floating microspheres of cimetidine: Formulation, characterization and in vitro evaluation. Acta Pharma, 2005; 55:277–85.
7. Chaurasia H, Jain A K, Prajapati S K, Chaurasia D, Gupta R, Arya R, Bhardwaj P. Formulation and in vitro evaluation of rosiglitazone maleate floating microspheres. Indian Pharm, 2007; 6(65):101–03.
8. Kawashima Y, Niwa T, Takeuchi H, Hino T, Ito Y. Preparation of multiple unit hollow microspheres (microballoons) with acrylic resins containing tranilast and their drug release characteristics (in vivo). J Control Release, 1991; 16:279–90.
9. Jain SK, Awasthi AM, Jain NK, Agrawal GP. Calcium silicate based microspheres of repaglinide for gastroretentive floating drug delivery: Preparation and in vitro characterization. J Control Release, 2005; 107:300–09.
10. Naggar VF, E-Kamel AH, Sokar MS, Al-Gamal SS. Preparation and evaluation of Ketoprofen floating oral delivery system. Int J Pharm, 2001; 220:13–21.
11. Martin A, Bustamante P, Chun AHC. Physical Pharmacy. New Delhi, India: B I Waverly Pvt. Ltd., 1996; 423–52.
12. Singh B, Ahuja N. Development of controlled-release buccoadhesive hydrophilic matrices of diltiazem hydrochloride: optimization of Bioadhesive, dissolution, and diffusion parameters, Drug Dev Ind Pharm 2002; 28: 431-442.
13. Gandhi N, Shirolkar S, Tawar M, Deore N, Development and Evaluation of floating microspheres of Pioglitazone hydrochloride using ethyl cellulose, Der Pharmacia Lettre, 2010, 2(5): 261-277.