6204
HYBRID GENETIC VARIABLE NEIGHBORHOOD SEARCH
BASED JOB SCHEDULING WITH DUPLICATION FOR
CLOUD DATA
CENTERS
1RACHHPAL SINGH, 2KARANJIT SINGH KAHLON, 3GURVINDER SINGH
1 Research Fellow, Department of Computer Science and Applications, GNDU, Amritsar, India 2Professor. Department of Computer Science and Applications, GNDU, Amritsar, India 3Professor. Department of Computer Science and Applications, GNDU, Amritsar, India
E-mail: 1[email protected], 2[email protected], 3[email protected]
ABSTRACT
Background/Objectives: Scheduling is one of the important way to provide high availability of processors to cloud users. Majority of scheduling approaches are NP-Hard. Therefore, meta-heuristics techniques are required to schedule the jobs on virtual machines (VMs). Meta-heuristic techniques usually suffer from inter-processor communication issues as well as premature convergence and global optima.
Methods: To handle these issues, hybrid scheduling technique was proposed using Genetic Algorithm
(GA) and Variable Neighborhood Search (VNS) with Task Duplication (TD). Thus, proposed technique can reduce the inter-processor scheduling overheads among high-end servers.
Results: To attain the objectives of the proposed approach, the cloud based model was designed by
considering well-known Fast Fourier Transformation (FFT) problem using Directed Acyclic Graph (DAG). A simulation environment was designed to implement the proposed technique. Extensive experiments have shown that the proposed technique outperforms over available techniques regarding Makespan, Speedup, and Efficiency. Conclusion: From a comparative analysis of existing and scheduling techniques it has been found that the mean reduction in makespan is 7.07%. The comparative studies have demonstrated that the mean improvement of proposed technique over other techniques concerning efficiency is 0.031%.
Keywords: Cloud Environment, Task Duplication, Variable Neighborhood Search, Genetic Algorithm,
Directed Acyclic Graph
1. INTRODUCTION
Technologies related to cloud environment have attained straightforward and standard framework for all the areas of business and research [1]. Clients expect to get more benefit for changing the platform; infrastructure and network etc. into payable services per transaction without affecting the performance of system or occurrences of any overprovision or bottlenecks [2]. Due to popularity, the job of the cloud becomes more crucial and its first step to provide on-demand any static or dynamic service according to the customer's requirements [3]. Any application can be accessed from anywhere, and associated data can be accessed easily with the help of cloud computing. It provides interesting and alternative solutions for the development of software [4]. It is straightforward to access contents having transparent feature for any local infrastructure [5]. Data centers have decreased the power consumption cost and similar occurrence
of environmental threats which makes its massive demand for the energy efficient controlling and computing [6,7]. Therefore, besides, the importance of such system, there is needed to do some work for the introduction of some new models which are efficiently managing this consumption [8].
ISSN: 1992-8645 www.jatit.org E-ISSN: 1817-3195
6205 energy efficiency and so on [12,13]. Till now, some parameters have been taken for a quality of service as discussed earlier, but the important parameter is the allocation cost in scheduling mechanism [14]. So, to minimize the total allocation cost is a major factor in cloud environment [15]. Many scheduling related problems are solved by heuristic and meta-heuristic techniques due to NP hard and NP-Complete problem respectively [16,17]. Task scheduling reduces power consumption by decreasing the execution time resulting in improving the service provider’s profit [18]. A good scheduling technique efficiently allocates a priority list to every subtask to minimize the makespan [19].
Inter processor communication can be reduced by using task duplication technique. Some tasks are duplicated on multiple machines to adjust the data locally, and some techniques use the task duplication concept for handling classic scheduling models that also manage concurrent communication among tasks and pay no attention to an argument for communication resources [20]. It means task duplication reduces the communication delay [21]. The main goal of task duplication is to resolve the deadlock matter, minimize the communication cost and make improvement in program process to communication ratio [22]. A cost effective meta-heuristic genetic algorithm minimizes the computation cost of process or workflow in cloud environment [23]. Some meta-heuristic approaches such as HEFT [24], VNS [25] and GVNS [26] can be used to avoid the trap in local minima and avoid premature convergence with optimal use of mutation operator (genetic operator) in the whole population.
Our main contributions in this paper are described as follows:
i. This paper has proposed a meta-heuristic based job scheduling technique for cloud computing environment.
ii. The proposed approach so called “Hybrid Meta-heuristic based job scheduling with job duplication (HSTD4)" uses the features of GA, VNS along with
the job duplication strategy. Here, 4 states that every fourth job is duplicated while doing the scheduling on cloud servers.
iii. The job duplication procedure is used to reduce the inter-processor communication.
iv. To simulate the proposed technique, the cloud-based model was designed by considering well-known FFT graph [18] problem using DAG. v. The experimental evaluations have shown that the proposed technique provides high availability to
cloud users by optimistically placing the jobs of users to available high-end servers.
2. PROPOSED METHODOLOGY
To attain the objectives of this paper, a step by step methodology was used. Initially, a cloud based model is designed by considering the well-known FFT problem in the department of Computer Science and Applications in Guru Nanak Dev University, Amritsar, Punjab, India during the period of 2015-17. MATLAB tool 2013a was used to successfully simulate the proposed technique. The Directed Acyclic Graph (DAG) is designed for the FFT problem. Then, the proposed method was formulated. In the proposed method, first of all, random initialization of given set of solutions was conducted by considering the concept of task duplication. Then, this was followed by the genetic algorithm in action to optimize the random solution by utilizing the mutation and crossover operators. Since the genetic algorithm is limited to local optima only, therefore, the proposed technique ends up by optimizing the solution with the variable neighborhood search (VNS) technique. Thus, the proposed technique can find the optimal solution more optimistically. The subsequent section contains the detail of each technique with suitable procedures and required formulas.
2.1 Cloud Based Model
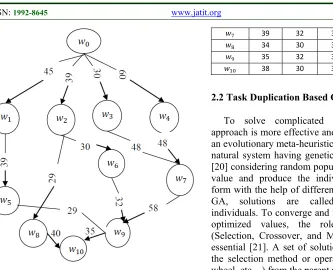
6206 Figure 1. Directed Acyclic Graph with 11 tasks
As shown in Figure 1, a DAG (Directed Acyclic Graph) G having n vertices V or nodes or subtasks and n-1 edges E or sub tasks dependencies. Whenever two sub tasks are not connected with the same processor, communication cost will be evaluated between these tasks. So, edges having communication cost must be labeled. Sub tasks were ordered in such a way that only one sub task is executed on high-end processor, and others were scheduled according to the assigned scheduling technique or criteria. Some of the tasks are slower, and some are faster according to their scheduling procedure. Here, sub task or small job w0 to w10
were scheduled as shown in the DAG. Entry job is w0, and exit job is w10. From the DAG, a
computation cost matrix is shown as in Table 1 (shows the first column for sub tasks or jobs, second-third-fourth columns for high-end processors Ð , Ð , Ð and fifth column shows for the average computation cost for every sub task executed on all the high-end servers.
Table 1. Cost Matrix for 11 tasks assignment on 3 servers
Task Ð Ð Ð (Edge line)
30 31 32 31
31 32 33 32
32 28 33 31
34 30 38 34
47 50 39 45
35 32 38 35
29 34 38 33
39 32 34 34
34 30 35 33
35 32 35 34
38 30 37 35
2.2 Task Duplication Based Genetic Mechanism
To solve complicated issues, the genetic approach is more effective and optimized [20]. It is an evolutionary meta-heuristic technique based on a natural system having genetic optimization criteria [20] considering random population set as an initial value and produce the individuals in optimized form with the help of different operators of GA. In GA, solutions are called chromosomes or individuals. To converge and for finding the better-optimized values, the role of GA operator (Selection, Crossover, and Mutation) is vital and essential [21]. A set of solutions is obtained using the selection method or operator (Ranking, Route wheel, etc…) from the parent population.
Further, to optimize a cross-breeding of parents must be done with the help of crossover operator based on crossover rate. This newly obtained offspring is used to get a more optimized solution with the help of mutation operator using mutation rate and rules and gives a better optimized solution. This is the first iteration or generation. This process continues till nth generation or according to the stopping criteria.
Procedure 1. Primary Procedure
1. Input the GA and Task Scheduling
parameters.
2. Call Procedure 2 for initializing population and Call Procedure 3 for subtasks assignment to high-end processors and computation of fitness function.
3. Repeat step 4 and 5 till stopping criteria met. 4. A new set of an optimized solution is obtained
from elitism individuals.
5. Apply selection and crossover operator by crossover rate and finally call the procedure to get the more optimized solution with the help of mutation operator using mutation rate. 6. Get the optimized solution as output and
return with a final optimized set of values.
2.2.1. Generating population
First of all, encoding is done to create the set of
chromosomes, and every chromosome in
ISSN: 1992-8645 www.jatit.org E-ISSN: 1817-3195
6207 chromosomes takes place by selecting integer numbers 0,1,2,3,….n-1 randomly (i.e., with the help of permutation technique). It shows the n sub tasks or genes or jobs in a sequence or priority order according to their scheduling order as shown in Figure 2.
Figure 2. Encoding basic layout of chromosome in the GA-TD procedure
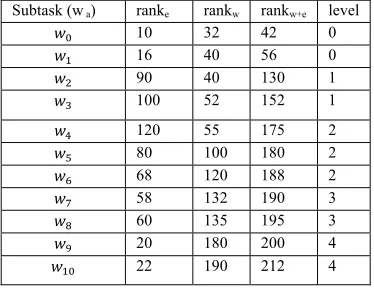
[image:4.612.95.298.173.240.2]All the sub tasks are arranged in such a way that there occurs one entry point and one exit point, the rest subtasks are arranged in the topological order according to their occurrences and evaluation as shown in the DAG. P_size=4 is the initial population size. Three heuristic rank mechanisms naming top level rank, bottom level rank and top-bottom rank are used as illustrated in Eq. (1), Eq. (2) and Eq. (3) [20] respectively for better seeding of an initial population as shown in DAG for presenting a better priority queue [19]. By using the concept of rank value [23], subtask ranks are developed as shown in Table 2. Three heuristic priority queue values are also developed as shown in Table 3 with the help of Table 2.
Table 2. Subtask ranks of Directed Acyclic Graph
Table 3. List of Queues having a Task priority or Priority Queue (PQ)
Position of
gene
0 1 2 3 4 5 6 7 8 9 10
HEFT-bottom PQ
HEFT-top
PQ
HEFT-leveled PQ
The rank for each task can be mathematically evaluated using Eq. (1) [20].
∈ Ć , (1)
Here, the is the average computational cost of subtask , Ć , ) is a quantity of communication between the subtasks and and is the upward rank of subtask ‘s successor. Weight rank for every subtask can be evaluated using Eq. (2) [20].
= ∈
Ć , (2)
Here, is the downward rank of the
subtask ′ precedence. Level for each subtask can
be mathematically evaluated using Eq. (3) [20].
Level
0, ;
1, ∈
Otherwise
(3)
Here, is the subtask the precedence.
The processing of initial population by taking population size, i.e., P_size and chromosome size C_sie was described in Procedure 2.
Procedure 2: Creating Initial Population
1. Input the Population size P_size and Chromosome size C_size.
2. Randomly generate the population by initializing three chromosomes set with three heuristic rank mechanisms and Set i=3. 3. While(i<=P_size-1) do Set j=0 and
While(j<=C_size-1) do randomly create a new gene j.
4. Change the position of the gene I from left to the right in a queue and stop.
2.2.2 Assignment of sub tasks to high-end machines
In the case of originated population, every individual should have a significant priority mechanism having permutation process. Therefore, subtasks should follow precedence conditions for this process [20]. A sub task will be allocated to the server with maximum speed, if and only if it is not already scheduled. In case of the proposed approach, HEFT technique is utilized to define the sub tasks with maximum priority in the individuals.
Subtask (w a) ranke rankw rankw+e level
10 32 42 0
16 40 56 0
90 40 130 1
100 52 152 1
120 55 175 2
80 100 180 2
68 120 188 2
58 132 190 3
60 135 195 3
20 180 200 4
[image:4.612.84.271.474.618.2]6208 Further, it allocates given sub tasks to the server(s) in such a way that it minimizes the overall makespan. The earliest start time (EST) of the subtask on processor Ð is symbolized as EST ( ,Ð which is obtained by Eq. (4) and Eq. (5)
[20]:
, Ð 0 (4)
,Ð ∈
, (5)
The actual start of sub task on processor Ð is symbolized as AST ( ,Ð . This is obtained using
Eq. (6) [20]:
AST ( ,Ð
max ( ,Ð , Ð (6)
Here, avail(Ð is a time that the processor
Ð has idle and ready for the task execution. The earliest finish time of subtask on processor Ð is symbolized as EFT ( , Ð which is obtained by Eq. (7) [12] as:
, Ð , Ð , Ð (7)
Here, , Ð is the computational cost of the subtask on processor Ð. The actual finish time of subtask on processor Ð is symbolized as AFT ( , Ð is obtained by Eq. (8) [12] as follows:
, Ð ɬ , Ð (8)
Assigning subtasks to processors is described in Procedure 3. Allocating subtasks to high-end servers is a significant achievement in proposed system and is illustrated in Procedure 3 as below:
Procedure 3. Allocation of Subtasks to High-End
Servers Based upon Task Duplication Criteria
1. Input the P_size of a chromosome and its present population.
2. To compute makespan create a PQ (priority queue) of sub tasks.
3. While (PQ#Null) do
4. Selection of the first subtask from PQ.
5. For high-end server pi=1 to n high-end servers.
6. Compute the fitness value using HEFT scheduling technique.
7. Allocate jobs on high-end processors
a. If then assign ith subtask to
all high-end processors and compute maximum schedule length
b. Else allocate ith subtask to the jth high-end
processor and compute maximum schedule length.
8. Makespan = maximum(schedule length).
9. End For loop
10. Delete ith task from PQ.
11. End While loop
12. Print makespan and return.
Here, TDR represents task duplication rate which is taken 0.5 for experimental purposes. That means there is 50% chance, a given job is going to be duplicated on available high-end servers.
2.2.3. Computation of fitness value
The importance of fitness function is to find and compute the generation population according to available chromosome set. It also creates a next generation population set for every iteration or generation. In this scheduling mechanisms, it computes the makespan from its maximum schedule length value (current finish time of sub tasks) as another scheduling technique computes makespan of application [23]. Makespan is defined in Eq. (9) [20] as given by:
(9)
In GA, the fitness value of chromosome is acquired by Eq. (10) [20].
(10)
2.2.4 Crossover operation
To get variation and better evolution in the population set, there is need of crossover operator. According to Keshanchi et al. [22], the role of crossover operator in this proposed evolutionary technique is to make a change in population. With the help of crossover point or crossover rate, diversity in parent side and child side will occur [20].
2.2.5 Mutation operation
Mutation operator is used for mutation operation in the GA to apply diversity in chromosome population having some mutation probability rate. It avoids the local optima and violates the precedence constraints in this algorithm [12].
2.2.6 Termination condition
ISSN: 1992-8645 www.jatit.org E-ISSN: 1817-3195
6209 number of fitness evaluations or the computer clock time or to trace the population's diversity and stop when this falls below a present threshold for terminating evolutionary algorithms. Termination condition occurs when all the chromosomes are converged into the same fitness.
2.3 Applying VNS For Optimized Result
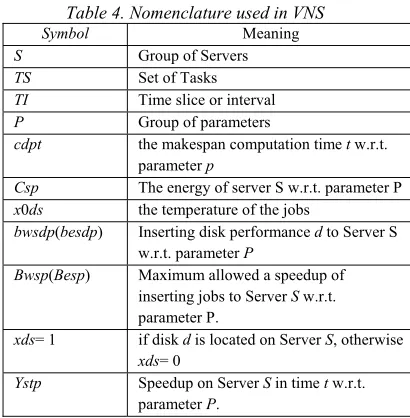
[image:6.612.97.302.219.428.2]Below is the nomenclature of VNS shown in Table 4 used in VNS illustrations.
Table 4. Nomenclature used in VNS
Symbol Meaning
S Group of Servers
TS Set of Tasks
TI Time slice or interval
P Group of parameters
cdpt the makespan computation time t w.r.t.
parameter p
Csp The energy of server S w.r.t. parameter P
x0ds the temperature of the jobs
bwsdp(besdp) Inserting disk performance d to Server S
w.r.t. parameter P
Bwsp(Besp) Maximum allowed a speedup of
inserting jobs to Server S w.r.t. parameter P.
xds= 1 if disk d is located on Server S, otherwise
xds= 0
Ystp Speedup on Server S in time t w.r.t.
parameter P.
To be able to generate heuristic based local search, select the suitable neighborhoods. The efficiency of the VNS increases the accurate choice of neighborhoods. Mostly three neighborhoods used in getting the better efficiency. One is having exponential size, and other two have polynomial size. In task scheduling, the assignment is the biggest problem, and optimal solutions can be obtained with the use of large neighborhood elements. Efficiency can be increased by doing so.
Let us take x = (xds) as a feasible solution.
Taking Move(x) operation that represents reasonable solutions set. It can be attained from x
by selecting one disk, removing the disk from a server. Further, insert the removed disk into another server. It will create a relationship of a server with disk, and such neighborhood has most |D| ・ |S|
solutions.
All the feasible solutions can be obtained from other neighborhood denoted as Swap(x). It can be done from x by exchanging two tasks between different servers. It consists of at most |D|2 solutions. Randomized versions of neighborhoods
can be used due to polynomial nature of neighborhoods. So efficiency in local search can be increased that will also minimize computational cost per iteration.
Let q be the parameter used in the randomized neighborhood having operation Moveq(x). Here, q ranged from 0<q<1. Moveq(x) is an element of neighborhood Move(x). Every part of Move(x) is inclusive into Moveq(x) having probability q. Similarly, neighborhood Swapq(x) is defined.
Assign(x) neighborhood introduced and used for the construction of elements. Elements development takes place using server and tasks. For every server, a set of tasks Ds is defined. Here, s S be removed from server s. Further, remove one disk from every set Ds. D is denoted as a subset of deleted tasks. In case of Ds = infinity occursfor the server s, and then remove a dummy or temporary disk. Dummy disk has no overhead expenses and load.
The primary purpose of this operation is to enhance the performance of all servers in a particular time interval. The given condition ensures the disk movement, i.e., every disk has movement only to one server, and so every server has exactly one disk. General Procedure for the VNS approach is described in procedure 4 as:
Procedure 4: To get the better-optimized results using VNS mechanism
1. Take xds:=x0ds, define parameters q, lmax, kmax
having some stopping criteria.
2. This step is repeated till stopping criteria met: (i) i:= 1;
(ii) do while i= imax:
a). Select i tasks from optimistic solution developed by GA procedure
b). Move these tasks to other servers
c). By applying local enhancement procedure on neighborhood Moveq, Swapq.
d). By applying the assignment operation to improve the current solution lmax times.
e). If improved solutionx1is better than x, then x := x1,i:= 1,
6210 In this procedure, running time or execution time can be computed as soon as stopping criteria met. Select the elements from sets Ds randomly having a uniform distribution. To accelerate this procedure, take q = 0.1, lmax= 7 and imax=9.
3. EXPERIMENTAL SET-UP
Comparative results of proposed methodology with well-known available techniques are discussed here. First of all, take the values of standard task graphs for better results and to improve the performance. Further, a discussion takes place by a comparative report and settings of parameters from the given comparative table. At the end, experimental values of comparisons showing the better performance of results in boxplots.
3.1. Test Bed
Proposed HSTD4 approach improves the
performance of the system with test-bed criteria. For this, task graphs values taken to represent the features of traditional parallel theories that is using Fast Fourier transformation (FFT) [18]. Task graph builds by using some new parameters, taking the number of tasks and matrix size m. FFT for task graph taking matrix size 2, 3 and 4 respectively, as shown in Figure 3.
Due to the same structure of graph with the variations of matrix sizes, FFT task graph has a total number of VMs or client machines, or nodes are equal to m2, (m2 + m)/2 and mlog
2m + 2m-1,
[image:7.612.316.524.81.301.2]respectively. We have considered “4, 8 and 16” Matrix size for applications with "0.25, 0.50, 1.00 and 2.00" as CCR value with "2, 4 and 8" high-end servers.
Figure 3. FFT (Fast Fourier Transformation Task Graph)
Testing of every task graph takes place with variations of settings in VMs and communication to computation ratio. The communication costs of various pairs of machines working independently have the same values. For instance, if 40 is the average computation cost having CCR value 0.25 then two dependent task has 10 value of communication cost (in case allocated to different machines). Also, for every test case, 10 data configurations are generated randomly. Note that, by using the Poisson distribution, computation time for every task on every machine varies among 10 configurations [24].
3.2. Comparison Metrics:
The different metrics are used to compute the algorithms, i.e., makespan, speedup, efficiency, and utilization.
Speed-up is a metric used for showing the better performance for comparing the proposed techniques with available one. Speed-up is shown in Eq. (11) [12]:
(11)
Here, in Eq. (11) serial length is represented by and makespan as . Also, the speedup is represented by using and is evaluated by allocating all the tasks to a single VM. The serial length is computed as in Eq. (12) [12] as:
min
∈ ∑ ∈ (12)
ISSN: 1992-8645 www.jatit.org E-ISSN: 1817-3195
6211 Efficiency is another metric to measure the algorithm performance. In a cloud, a comparative report of all the algorithms described w.r.t. efficiency. The efficiency in a cloud is calculated as shown in Eq. (13) [12]:
(13)
Here, nop is the number of processors. The formula of efficiency in Eq. (13) [18], describes the Speedup of all VMs.
At the end, Utilization of all the machines in the cloud system is defined as in Eq. (14) [18]:
∑
(14) Here, denotes scheduling time for every machine’s and is computed as in Eq. (15) [18]:
(15)
Here, denotes machine's schedule length and denote the machine's maximum schedule length among all parallel machines.
The makespan of a project is the total time that elapses from the beginning to the end. Makespan is computed from the maximize value of schedule length. This is shown in Eq. (16) [18] as:
makespan = max { }(16)
Here, is the schedule length and so minimum the makespan, better the optimized value.
3.3 Results And Discussion
Fine-tuning of parameters for each problem gives better solutions separately. So, the primary objective of HSTD4 is to solve task scheduling
problems using same parameter values. To compare HSTD4 approach, three well-known methods, i.e.,
HEFT [24], VNS [25] and GVNS [26] are also implemented. HSTD4, HEFT [24], VNS [25] and
GVNS [26] are implemented in MATLAB 2013a version. The simulations are done on the Intel Core i5, 3.30 GHz, and 8 GB RAM. To successfully implement the proposed technique, we have taken Population size = 250, Number of generations as 800, Selection operator is a Binary tournament, Crossover Operator is a random one point, Mutation rate=0.001, Crossover rate 0.05, and Sampling rate 0.005.
4. PERFORMANCE ANALYSIS
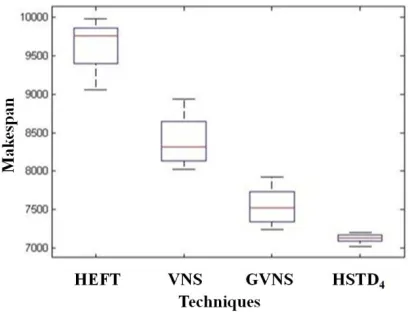
Figure 4 is showing the comparison of HSTD4,
HEFT [24], VNS [25] and GVNS [26] regarding Makespan. It is demonstrating that the HSTD4 has
enough significant improvement over the available techniques, as the makespan of the proposed method is quite less than other technologies. The simulation is run 15 times, and averages values of makespan of each technique are represented in Figure 4. In descriptive statistics, a box plot or boxplot is a convenient way of graphically depicting groups of numerical data through their quartiles. Box plots may also have lines extending vertically from the boxes (whiskers) indicating variability outside the upper and lower quartiles, hence the terms whisker plot and box-and-whisker diagram. All the boxplots are designed by considering the FFT=16 and VM=8. Figure 4 is showing the boxplot analysis of the HSTD4, HEFT
[24], VNS [25] and GVNS [26] regarding the Makespan. As the proposed technique HSTD4 is
[image:8.612.317.521.345.501.2]showing lesser variability, therefore it performs consistently every time. Also, proposed outcomes are always less than the box values of other techniques thus have better results.
Figure 4. Comparative analysis of Makespan
Figure 5 describes the boxplot analysis of Speedup among HSTD4, HEFT [24], VNS [25] and
GVNS [26]. The HSTD4 has lesser variability; thus
6212 Figure 5. Comparative analysis of Speedup
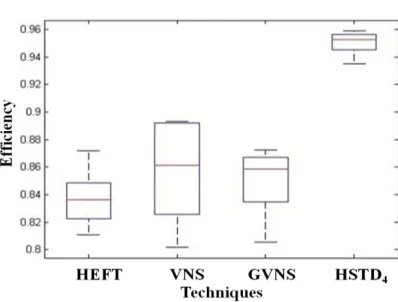
Figure 6. Comparative analysis of Efficiency
Figure 6 depicts boxplot analysis of HSTD4 over
others by considering the Efficiency. HSTD4 has
better Efficiency compared to other techniques. Also, it has more consistent results as it provides consistent Efficiency in every experiment by considering the same problem size.
Figure 7. Comparative analysis of Utilization Figure 7 shows a comparative analysis of Utilization between HSTD4, HEFT [24], VNS [25]
and GVNS [26] with the help of boxplot. HSTD4
seems to be more consistent with others as it has lesser variability. Also, it has higher utilization value over other techniques. Therefore, proposed method outperforms over others.
5. CONCLUSION
This paper has proposed a hybrid metaheuristic technique to provide high availability to cloud users. The proposed method utilizes GA and VNS using task duplication (HSTD4) to improve the
stability of global search and to reduce inter-processor communication. To obtain the objectives of HSTD4, the cloud based model is designed by
considering well-known FFT problem. DAG is designed for the FFT problem. Here, HSTD4,
HEFT, VNS and GVNS based scheduling techniques are designed and implemented in the MATLAB 2013a tool with the help of parallel processing toolbox. Comparisons with existing meta-heuristic based scheduling techniques show that HSTD4 has the mean reduction in makespan is
7.07%, incrimination of speed is 0.13%, improvement of utilization is 0.03% and increase in efficiency is 0.031% as compared to the best-optimized result, and so HSTD4 have more
optimistic results.
REFERENCES:
[1] Sharkh. M. A., Kanso. A., Shami. A. and Ohlen. P., “Building a cloud on earth: A study of cloud computing data center simulators”,
Computer Networks, 108, 2016, pp:78-96.
[2] Sharma. Y., Javadi. B., Si. W. and Sun. D., “Reliability and energy efficiency in cloud computing systems: Survey and taxonomy”,
Journal of Network and Computer Applications, 74, 2016, pp: 66-85.
[3] Pradhan. P., Behera. K. P. and Ray. B. N. B., “Modified Round Robin Algorithm for Resource Allocation in Cloud Computing”,
Procedia Computer Science, 85(1), 2016, pp:
878-890.
[4] Ismail. L. and Fardoun. A., “EATS: Energy-Aware Tasks Scheduling in Cloud Computing Systems”, Procedia Computer Science, 83, 2016, pp: 870-877.
[image:9.612.95.299.531.669.2]ISSN: 1992-8645 www.jatit.org E-ISSN: 1817-3195
6213
Journal of Network and Computer
Applications, 68, 2016, pp:173-200.
[6] Awad. A. I., El-Hefnawy N. A. and Abdel-kader. H. M., “Enhanced Particle Swarm Optimization for Task Scheduling in Cloud
Computing Environments”, Procedia
Computer Science, 65, 2015, pp: 920-929.
[7] Bansal. N., Maurya. A., Kumar. T., Singh. M. and Bansal. S., “Cost performance of QoS
Driven task scheduling in cloud
computing”, Procedia Computer Science, 57, 2015, pp: 126-130.
[8] Sinnen. O., “Reducing the solution space of optimal task scheduling”, Computers &
Operations Research., 43, 2014, pp:201-214.
[9] Awad. A. I., El-Hefnawy N. A. and Abdel_kader. H. M., “Enhanced Particle Swarm Optimization for Task Scheduling in Cloud Computing Environments”, Procedia
Computer Science, 65, 2015, pp:920-929.
[10] Keshanchi. B., Souri. A. and Navimipour. N. J., “An improved genetic algorithm for task scheduling in the cloud environments using the priority queues: formal verification, simulation, and statistical testing”, Journal of
Systems and Software, 2016.
[11] Jena. R. K.., “Multi Objective Task Scheduling in Cloud Environment Using Nested PSO Framework”, Procedia Computer
Science, 57, 2015, pp:1219-1227.
[12] Yuming. X., Kenli. L., Jingtong. H. and Keqin. L., “A genetic algorithm for task scheduling on heterogeneous computing
systems using multiple priority
queues”, Information Sciences, 270. 2014, pp:255-287.
[13] Sinnen. O., To. A. and Kaur. M., “Contention-aware scheduling with task duplication”,
Journal of Parallel and Distributed Computing, 71(1), 2011, pp:77-86.
[14] Hashimoto. K., Tsuchiya. T. and Kikuno. T., “A new approach to fault-tolerant scheduling using task duplication in multiprocessor systems”, Journal of Systems and Software,
53(2), 2000, pp:159-171.
[15] Arafeh. B. R., “A task duplication scheme for
resolving deadlocks in clustered
DAGs”, Parallel Computing, 29(6), 2003, pp:795-820.
[16] Jasraj. M., Kumar. M. and Vardhan. M., “Cost Effective Genetic Algorithm for Workflow Scheduling in Cloud under Deadline Constraint”, IEEE Access, 4, 2016, pp:5065-5082.
[17] Ali. A. F. and Mohamed. A. T., “A hybrid particle swarm optimization and genetic algorithm with population partitioning for large scale optimization problems”, Ain
Shams Engineering Journal, 2016.
[18] Gülcü. Ş. and Kodaz. H., “A novel parallel
multi-swarm algorithm based on
comprehensive learning particle swarm optimization”, Engineering Applications of Artificial Intelligence, 45, 2015. pp:33-45. [19] Jun-qing. L., Quan-ke. P. and Fa-tao. W., “A
hybrid variable neighborhood search for solving the hybrid flow shop scheduling problem”, Applied Soft Computing, 24, 2014, pp:63-77.
[20] Yuming. X., Kenli. L., Jingtong. H. and Keqin. L., “A genetic algorithm for task scheduling on heterogeneous computing
systems using multiple priority
queues”, Information Sciences, 270, 2014, pp:255-287.
[21] Keshanchi. B., Navimipour. J., “Priority-based task scheduling on cloud computing environment using a memetic algorithm”,
Journal of Circuits, Systems and Computers,
2015.
[22] Keshanchi. B., Souri. A. and Navimipour. N. J., “An improved genetic algorithm for task scheduling in the cloud environments using the priority queues: Formal verification, simulation, and statistical testing”, Journal of
Systems and Software, 124, 2017, pp:1-21.
[23] Yu. H., “Optimizing task schedules using an artificial immune system approach”,
Proceedings of the 10th Annual Conference
on Genetic and Evolutionary Computation.
6214 [24] Topcuoglu. H., Hariri. S. and Wu. M.,
“Performance-effective and low-complexity
task scheduling for heterogeneous
computing”, IEEE Transactions on Parallel
and Distributed Systems, 13, 2002, pp:260–
274.
[25] Davidovic. T., Hansen. P. and Mladenovic. N., “Permutation-based genetic, tabu and variable neighborhood search heuristics for multi VM scheduling with communication delays”, Asia–Pacific Journal of Operational
Research, 22, 2005, pp:297–326.
[26] Wu. A., Yu. H., Jin. S. Lin. K. and Schiavone G., “An incremental genetic algorithm approach to multi VM scheduling”, IEEE Transactions on Parallel and Distributed