THE LONDON SCHOOL OF ECONOMICS AND
POLITICAL SCIENCE
Essays in Applied Microeconomics
Gianpaolo Caramellino
A thesis submitted to the Department of Economics of
the London School of Economics for the degree of
Declaration
I certify that the thesis I have presented for examination for the PhD degree of the London School of Economics and Political Science is solely my own work other than where I have clearly indicated that it is the work of others (in which case the extent of any work carried out jointly by me and any other person is clearly identified in it).
The copyright of this thesis rests with the author. Quotation from it is permitted, provided that full acknowledgement is made. This thesis may not be reproduced without my prior written consent.
I warrant that this authorization does not, to the best of my belief, infringe the rights of any third party.
I declare that my thesis consists of approximately 44,000 words.
Statement of conjoint work
Acknowledgements
I wish to thank several people that gave me fundamental inputs through my PhD. First, I express my gratitude to my supervisors Francesco Nava, Leonardo Felli, and Yona Rubinstein. They constantly encouraged me during the hard times of the PhD by always being friendly and sympathetic. I truly believe that this thesis would not have been possible without their help. Furthermore, the exposure to their intellectual curiosity and rigor, often discussing topics that go well beyond these pages, will be beneficial also in my professional life.
I am grateful to other professors at the LSE, too. Carola Frege has been an extraordinary co-author, while Guy Michaels and Steve Pischke offered me many helpful comments at different stages of my work.
I acknowledge the financial support of the Economic and Social Research Council (ESRC) and the Fondazione Einaudi di Torino. At the Fondazione Einaudi, I thank Fabrizio Goria for his help and Giuseppe Bertola for his interest and comments on my research.
For their kindness and support during the transition between the undergraduate studies and the PhD, I am indebted to Dino Gerardi, Filippo Taddei and Pietro Garibaldi. I also thank Raffaello Bronzini and Silvia Magri, two great co-authors of mine, for being excellent guides during the initial phase of my research activity.
Special friends deserve special mentions. Alexandra Scudo has been almost like an additional sister in London. Sometimes I failed to be in touch, yet she has always offered me real breaks from the stress of my PhD, with inspiring chats and tasty dinners. Francesco Sannino and Matteo Benetton have been my greatest discoveries in London, and a great source of fun. I am indebted to Francesco, a sharp co-author, for always being thoughtful and supportive with me. I greatly benefited from his breathtaking ability to understand and address my needs, as well as from his intriguing viewpoints on several issues. Matteo, one of the kindest people I have ever met, is a true source of inspiration. In our long-lasting experience as officemates, he taught me how to practically pursue my dreams.
Finally, I am blessed to share the joy of my PhD with the people that are always on my side. Giulia was the main reason for doing my PhD in London and I will always be grateful to her for inducing me to take the right decision. I am thankful for her love and for her never ending support. Lalla inspires me every day with her examples and she has been truly important for me over these years. I feel extremely lucky to have her as my sister and I thank her for always being confident in my talent. My deepest gratitude goes to Mamma and Pap`a for their unconditional love and tireless support.
My greatest academic achievement is for my most
Abstract
This thesis consists of three chapters that belong to the realm of Applied Microe-conomics. The first two chapters are empirical projects that assess the role of time for human capital development of immigrants in the U.S.. The third one is a theory project that studies how managerial career concerns and experimentation influence risk-taking behaviours.
Chapter 1 studies how age at arrival in the U.S. affects the skill development of young immigrants in the U.S.. Using the within family variation across siblings entered in the U.S. at different ages, I document a cognitive / non-cognitive trade-off induced by age at arrival. As for cognitive skills, the effect of age at arrival is negative, in particular for the ability to learn English. The effect on cognitive skills is reflected in immigrants’ educational achievements. However, age at arrival plays a positive role for illicit behaviours. Children of immigrants arrived later tend to show less problematic behaviours than their siblings arrived earlier, also controlling for their English ability. Through an indirect accounting exercise, I estimate the negative effect of age at arrival on the labor market performance of immigrant adults. I conclude the paper showing that more educated parents anticipate the arrival of their children in the U.S..
Contents
1 Do not Put Off Until Tomorrow What You Can Do Today: Age at
Arrival and Immigrants’ Human Capital 16
1.1 Introduction . . . 16
1.2 Empirical strategy . . . 21
1.3 Data . . . 26
1.4 Results . . . 29
1.5 Further considerations . . . 33
1.6 Robustness checks . . . 38
1.7 Conclusion . . . 41
2 The Immigrant American Dream 67 2.1 Introduction . . . 67
2.2 Data and sample selection . . . 70
2.3 Econometric model . . . 73
2.4 Results . . . 77
2.5 Further considerations . . . 85
2.6 Robustness checks . . . 87
cerns 120
3.1 Introduction . . . 120
3.2 Baseline model . . . 124
3.3 An extension: N agents . . . 141
3.4 Conclusion . . . 148
A Appendix to chapter 1: Do not Put Off Until Tomorrow What You Can Do Today: Age at Arrival and Immigrants’ Human Capital 151 The model . . . 152
Robustness checks . . . 155
Presence of both parents in households . . . 155
Excluding immigrants arriving as dropouts . . . 167
Controlling for time trends in educational system . . . 169
Excluding immigrants arrived after the age of 14 . . . 171
Heterogeneity . . . 176
Accounting exercise . . . 193
B Appendix to chapter 2: The Immigrant American Dream 196 Samples and countries of origin . . . 197
Robustness checks . . . 203
Different empirical specification: outcomes in levels and family fixed effects . . . 203
Educational achievements: different sampling strategy . . . 212
Different measures of reading comprehension and word knowledge . . 215
Additional tables . . . 217
Proofs . . . 224
Beliefs . . . 225
Proof of Proposition 1 . . . 227
Proof of Lemma 1 . . . 230
Proof of Corollary 1 . . . 233
Additional beliefs with N agents . . . 237
Proof of Proposition 3 . . . 240
Proof of Proposition 4 . . . 243
Additional beliefs with N agents with conditionally independent sig-nals ω . . . 251
Results with N agents with conditionally independent signals ω . . . 253
List of Figures
1-1 The correlation between different outcomes and age at arrival in the U.S. . . 44 1-2 The correlation between different outcomes and age at arrival in the
U.S. . . 45
2-1 The analysis with cross sectional data . . . 93 2-2 The analysis with the NLSY79 and the NLSY79 Children and Young
List of Tables
1.1 Summary statistics; NLSY79 . . . 46 1.2 The correlation between educational achievement and age at arrival;
NLSY79 and Census . . . 47 1.3 The effect of age at arrival on years of education; ordinary least
squares and family fixed effects regressions . . . 48 1.4 The effect of age at arrival on word knowledge; ordinary least squares
and family fixed effects regressions . . . 50 1.5 The effect of age at arrival on paragraph comprehension; ordinary
least squares and family fixed effects regressions . . . 52 1.6 The effect of age at arrival on arithmetic reasoning; ordinary least
squares and family fixed effects regressions . . . 54 1.7 The effect of age at arrival on numerical operations; ordinary seast
squares and family fixed effects regressions . . . 56 1.8 The effect of age at arrival on mathematics knowledge; ordinary least
squares and family fixed effects regressions . . . 58 1.9 The effect of age at arrival on illicit behaviours; ordinary least squares
and family fixed effects regressions . . . 60 1.10 The effect of age at arrival on several outcomes controlling for english
1.11 The effect of age at arrival on several outcomes controlling for english
ability; same year of arrival sample . . . 64
1.12 The parental selection in age at arrival . . . 66
2.1 Summary statistics; NLSY79 . . . 96
2.2 Summary statistics; NLSY79 Children and Young Adults . . . 97
2.3 ∆ child-mother education . . . 98
2.4 ∆ child-mother cognitive skills . . . 100
2.5 ∆ child-mother problematic behaviours . . . 102
2.6 ∆ child-mother presence of both parents in household . . . 104
2.7 ∆ child-mother parenting . . . 106
2.8 Exploring the heterogeneity: different immigrant definitions . . . 108
2.9 Exploring the heterogeneity: different immigrant definitions . . . 110
2.10 Exploring the heterogeneity: Mexican vs non-Mexican immigrants . . 112
2.11 Exploring the heterogeneity: Mexican vs non-Mexican immigrants . . 114
2.12 Principal component analysis; all individuals in NLSY79 . . . 116
2.13 Principal component analysis; ∆ child-mother in NLSY79 Children And Young Adults . . . 117
2.14 Summary statistics by area of origin; NLSY79 . . . 118
2.15 Summary statistics by area of origin; NLSY79 Children And Young Adults . . . 119
A.1 The effect of age at arrival on years of education; family fixed effects regressions controlling for presence of both parents . . . 156
A.2 The effect of age at arrival on word knowledge; family fixed effects regressions controlling for presence of both parents . . . 157
A.4 The effect of age at arrival on arithmetic reasoning; family fixed effects regressions controlling for presence of both parents . . . 159 A.5 The effect of age at arrival on numerical operations; family fixed
effects regressions controlling for presence of both parents . . . 161 A.6 The effect of age at arrival on mathematics knowledge; family fixed
effects regressions controlling for presence of both parents . . . 163 A.7 The effect of age at arrival on illicit activities; family fixed effects
regressions controlling for presence of both parents . . . 165 A.8 The effect of age at arrival on years of education; family fixed effects
regressions excluding dropout immigrants . . . 168 A.9 The effect of age at arrival on years of education; controlling for time
trends . . . 170 A.10 The Effect of Age at Arrival on Years of Education; Family Fixed
Effects Regressions on Small Sample . . . 172 A.11 The Effect of age at arrival on various English outcomes; family fixed
effects regressions on small sample . . . 173 A.12 The effect of age at arrival on various mathematics outcomes; family
fixed effects regressions on small sample . . . 174 A.13 The effect of age at arrival on illicit behaviours; family fixed effects
regressions on small sample . . . 175 A.14 The effect of age at arrival on schooling; heterogeneity based on
Mex-ican origin . . . 177 A.15 The effect of age at arrival on English knowledge; heterogeneity based
on Mexican origin . . . 179 A.16 The effect of age at arrival on mathematics knowledge; heterogeneity
A.17 The effect of age at arrival on illicit behaviors; heterogeneity based on Mexican origin . . . 183 A.18 The effect of age at arrival on schooling; heterogeneity based on arrival
from English speaking country . . . 185 A.19 The effect of age at arrival on English knowledge; heterogeneity based
on arrival from English speaking country . . . 187 A.20 The effect of age at arrival on mathematics knowledge; heterogeneity
based on arrival from English speaking country . . . 189 A.21 The effect of age at arrival on illicit behaviors; heterogeneity based
on arrival from English speaking country . . . 191 A.22 The mincerian regressions . . . 194
B.1 Sample selection; NLSY79 and NLSY79 Children And Young Adults 198 B.2 Countries of origin; NLSY79 . . . 199 B.3 Different empirical specification: outcomes in levels and family fixed
effects . . . 204 B.4 Different empirical specification: outcomes in levels and family fixed
effects . . . 206 B.5 Different empirical specification: outcomes in levels and family fixed
effects . . . 208 B.6 Different empirical specification: outcomes in levels and family fixed
effects . . . 210 B.7 Educational achievements: different sampling strategy . . . 213 B.8 Different measures of reading comprehension and word knowledge . . 216 B.9 Summary statistics; mothers in NLSY79 Children And Young Adults 218 B.10 Principal component analysis; immigrants in NLSY79 . . . 219 B.11 Principal component analysis; ∆ child-mother immigrants in Children
Chapter 1
Do not Put Off Until Tomorrow
What You Can Do Today: Age at
Arrival and Immigrants’ Human
Capital
1.1
Introduction
Is age at arrival an important factor in explaining the pre-labour market out-comes of children of immigrants in the U.S.? Is a late arrival unambiguously bad? These are the issues that I take up in this paper. In trying to answer these questions, I make use of the NLSY79 dasaset, that allows me to shed light on the differential role of age at arrival in shaping several dimensions of individuals’ personality, often considered unobservable. In the pages that follow I show that age at arrival has, in general, a negative effect on the educational achievement of children of immigrants, that is also reflected in the performance in standardized cognitive tests. It has, however, a positive effect on the likelihood of not being involved in anti-social and illicit activities. I also provide indirect evidence that the net effect of this trade-off is tilted toward a preference for arriving earlier.
NLSY79 is that it offers the possibility of observing immigrants whose age at arrival is different, but that are instead similar along the other dimensions that affect their human capital. Specifically, to assess the role of age at arrival on the human capital development of immigrants, I use family fixed effects and I exploit the variation in age at arrival across different siblings within the same household.
Another advantage of the data I use is the richness of individuals’ information I can observe. A part from the numbers of years of education, I am able to study immigrants’ performance in standardized cognitive tests across several subject ar-eas1, as well as to understand their social behaviour. I find that an extra year in
the home country reduces the number of years of education by 0.14 to 0.2, with the critical period around the age of 10. As for cognitive skills, my results indicate that the degree to which a late arrival is detrimental is subject-specific. In particular, the effect is stronger for the knowledge of English language, and milder in case of mathematics. Furthermore, my results indicate that reducing the age at arrival by one year increases the amount of illicit, risk-taking, and problematic behaviours by about 0.05 to 0.15 of a standard deviation. Despite this apparent traoff in the de-velopment of cognitive and non-cognitive skills, I then provide suggestive evidence that an earlier arrival is preferable compared to a later one, as it leads to better labour-market outcomes. I also show that parents with higher education bring their children earlier.
Researchers have hinted at several possibilities for explaining the role of age at arrival in the assimilation process of children of immigrants. The inability in acquiring language proficiency after a certain threshold age2, tied to the importance
of verbal ability in acquiring non-linguistic skills or in attaining success in school, is
1Other papers proposed the performance in these tests as important predictors of labour market
outcomes. See, for example Heckman et al. (2006).
conceivably an important one. Although I lack the exogenous variation in English knowledge to run the ideal experiment and to assess its causal effect as a channel through which age at arrival has an impact on non-verbal outcomes, when I use verbal ability as an additional controller in my regressions of schooling and cognitive skills on age at arrival, the estimates reduce substantially. I rule out, instead, any role of linguistic knowledge in determining the relation between age at arrival and the likelihood of being involved in illicit behaviours.
Relation to the literature. This paper contributes to the debate on the role of age at arrival on the immigrants’ human capital formation and their socio-economic performance. Several papers study the effect of age at migration on academic achievements; examples are Gonzalez (2003), Bleakley and Chin (2004), Van Ours and Veenman (2006), Ohinata and van Ours (2012), B¨ohlmark (2008), Basu (2016) and Lemmermann and Riphahn (2017). While the studies based on U.S. data (Gon-zalez (2003) and Bleakley and Chin (2004)) do not account for the endogeneity of age at arrival (with the exception of Basu (2016)) and use the number of years of education as the main outcome of interest, I use family fixed effects and a broader set of measures of cognitive skills. From a methodological perspective, my paper is similar to those based on Swedish and German data (B¨ohlmark (2008) for Swe-den and Lemmermann and Riphahn (2017) for Germany). In this respect, my paper adds to these studies because the characteristics of the host country and its selection of immigrants are different3 and because I also consider some non-cognitive skills.
My paper also speaks to the literature on the importance of verbal knowledge for educational and economic achievements. Bleakley and Chin (2004) show that English ability is an important predictor in wage regressions of immigrants and the
3For example, the estimates for the effect of age at arrival on years of education in Lemmermann
effect is mainly due to its role in affecting immigrants’ education. Isphording et al. (2016) finds that increasing linguistic ability by one standard deviation increases the math performance in standardized tests by 0.6 of a standard deviation. Aucejo et al. (2016) conclude that linguistic ability is more important than math skills in determining university enrolment and that teenage years are particularly important for developing skills. In my paper I find a strong negative effect of age at arrival on the ability to learn English. In the context of this literature, my result implies that reducing children of immigrants’ age at arrival, by increasing their English ability, should be beneficial for the development of their non-linguistic skills and for their labor market outcomes. This result is in contrast to Lemmermann and Riphahn (2017), that using German data find that linguistic knowledge is not a relevant channel through which age at arrival affects educational achievements.
More broadly, my paper is related to the studies documenting gaps between first generation immigrants and natives (see for example Chiswick and DebBurman (2004) and Algan et al. (2010)), as well as to the literature on the cognitive and non-cognitive skill formation of young individuals and on early childhood intervention (see Cunha and Heckman (2007) and Cunha et al. (2010)). As such, my study indicates that providing incentives to immigrant parents to anticipate their arrival in the host country would reduce the cognitive barriers their children face in investing in human capital, thus reducing the gap between them and the children of native parents.
1.2
Empirical strategy
In order to guide the empirical analysis, I start by developing a simple conceptual framework that describes different determinants of immigrant children’s age at ar-rival. A toy model formalizing the discussion can be found in the Appendix. I then show why in my empirical model the endogeneity of age at arrival makes the esti-mation problematic and how I can address this problem using family fixed effects and the NLSY79 data.
Conceptual framework
The sample in my study consists of immigrant children arrived in the U.S. when they were teenagers or younger. Presumably, for most of them, the decision on when to arrive was their parents’ choice. For simplicitly, let us think of the economy as a two-period world. In the first period, immigrant parents choose when to move to the U.S.. In the second one, immigrant children observe their age at arrival and choose their investment in human capital, accordingly. The cross-sectional empirical relation between the investment in human capital and age at arrival is the combination of an age at arrival effect and a selection one, that arises because of common factors affecting both parents’ and children’s optimal decisions.
linguistic proficiency (see the seminal paper Lenneberg (1967) on the critical period hypothesis to acquire linguistic proficiency). On the other hand, certain aspects of the new local environment might as well be detrimental for the future individual’s success. In this case, a higher age at arrival could be beneficial for children of im-migrants, by increasing the likelihood of retaining certain positive cultural traits typical of their home countries.
The selection effect, instead, suggests that age at arrival in the U.S. is likely not as good as randomly assigned. Immigrant children that arrived earlier may be sys-tematically different from those arrived when they were older, in terms of attitudes towards skills accumulation or costs in acquiring them. There are several reasons that support this possibility. Parents select the timing of migration, and hence the age at arrival of their children, depending on their own preferences, abilities or ma-terial resources. Furthermore, some families might be forced to leave their home countries without the possibility to select the best timing. Those family character-istics might, in turn, be correlated with some determinants of children’s investment in skills.
that larger family size, whose effect on achievements is negative (see, for example, Black et al. (2005)), increases the cost of arriving earlier4. In general, individuals arrived earlier are not necessarily those more willing to invest in U.S.-specific human capital. Immigrants enter in the U.S. for different purposes and some immigrant cat-egories, particularly refugees or asylees, are less likely to freely choose the timing of migration. Simultaneously, some of them may be more easily eligible for permanent residence or naturalization (see, for example, Woodrow-Lafield et al. (2004)) or less likely than others to migrate back to their origin countries, and thus possibly more willing to invest in U.S-specific human capital.
Econometric model
The objective of my study is to estimate the coefficient βa in the regression
yit =cons+βaait+βxXit+it
whereyitis a measure of skills of individualtliving in householdi, whileaitrepresents his age at arrival in the U.S.. Xit is a set of characteristics that may vary at the individual level and affect the skill accumulation, and it is an idiosyncratic error term.
In the previous subsection I explained some reasons for why ait and the shock
it might be correlated. If these concerns are valid, ordinary least squares estimates that make use of the whole cross-sectional variation in age at arrival would provide biased estimates of the causal effect of age at arrival on skill accumulation, βa. In this subsection I explore what I can do, as an empirical researcher, using fixed effect regressions and the NLSY79 dataset.
4For example, grandparents’ help in the home country may be an increasing function of the
In an ideal experiment I would randomly select immigrant children in the sample and force them to enter the U.S. at different ages. In this way, there would be no systematic link between the age at arrival in the U.S., ait, and the realization of the shock it. As such an experiment is impossible, I use a model with family fixed effects,
yit =cons+βaait+βxXit+ it
z }| {
γi+γit
where I assume that the shock it has two components: γi is a fixed family compo-nent, whereas γit is the idiosyncratic individual component.
The critical assumption to estimate consistently the causal effect of age at arrival,
address this concern, I always control for sex and, when specified, for a birth order indicator.
When I use the outcomes in standardized tests to measure the cognitive skill accumulation of children of immigrants, as well as when I consider attitudes toward illicit behaviours, I also face an additional problem. The concern, in this case, is the perfect collinearity between age at arrival and age at the time of the interview. In the NLSY79, indeed, individuals take the cognitive tests or answer to behavioural questions in the same year, but at different ages. Potentially, both these two com-ponents have an effect in determining the outcomes. To solve this problem, when the outcome variable of the regression is the performance in cognitive tests, or the attitude towards illicit behaviours, I add natives to my sample. By assuming iden-tical cohort effects for natives and immigrants, the variation across native siblings identifies the age effect, while, once the cohort effect is partialled out, the residual variation across immigrant siblings identifies the age at arrival effect on the outcome of interest.
To conclude this section, I also want to stress that measurement error in age at arrival is likely to occur in this study. As some individuals are asked several years later about the year in which they entered in the U.S., some of them could report it wrongly. The fixed effect estimates exacerbate this problem. If the conditions for the classical measurement error apply to my analysis, my estimates would be biased toward 05. It is important to notice, however, that restricting the sample to siblings
arrived in the same calendar year should make the measurement error less severe.
1.3
Data
Data sources and variables of interest
In my study I use the National Longitudinal Survey of Youth 1979 (NLSY79) and the U.S. Census.
The NLSY79, that is the basis for the main part of this study, is a survey ad-ministered by the U.S. Bureau of Labor Statistics to 12,686 individuals living in the U.S.. The survey participants were born during the period 1957 through 1964 and have been interviewed annually since 1979 through 1994 and, since then, on a bien-nial basis. The NLSY79 has been intensively used in the labor literature, because it offers detailed information on several socioeconomic outcomes of a representative sample of the youth population in the U.S.. From the NLSY79, I obtain the indi-viduals’ number of years of education, the outcomes in standardized cognitive tests and an index of illicit behaviours, as well as information on age at arrival in the U.S. and family structure.
sion ones, determines the Armed Forces Qualification Test (AFQT). The AFQT has been often used in the literature as a proxy of IQ (see, for example, Cameron and Heckman (1998), Cameron and Heckman (2001), and Heckman et al. (2006)). In the arithmetic reasoning part, candidates face math word problems and the goal of these questions is to assess their ability to apply mathematics in solving real world problems6. The mathematics knowledge section covers basic high school mathemat-ics, including questions on algebra and geometry. The numerical operation part of the test is a speed test in performing simple mathematical computations. In the word knowledge section candidates must pick the best synonym of a given word in a sentence7. In the paragraph comprehension one, candidates are evaluated on their ability to understand brief reading passages8. My measures of linguistic knowledge
differs substantially from other measures used in the immigration literature, that are often self-reported and expressed as categorical variables with few potential values. In my analysis, I standardize the cognitive skill measures to have a mean of zero and a standard deviation of one in the NLSY79 population.
The index of illicit behaviours is useful to obtain a glance at the development of a particular sociability trait of immigrants in the U.S., that is often a motive of debate, although difficult to measure. I construct an index which is computed using questions from the 1980 survey, and measuring the degree to which an individual engages in aggressive, risk-taking, and illicit behaviors. Each survey participant was asked to answer to twenty questions: seventeen are about delinquency and
6For example, candidates must solve the problem: “One in every 9 people in a town vote for
party A. All others vote for party B. How many people vote for party B in a town of 810?”
7As an example, candidates must choose the most appropriate synonym of unblemished in
the sentence “The employee was proud of her unblemished reputation,” out ofimpaired, flawless,
sporadic,unorthodox.
8For example, respondents must read the passage “The Mississippi River is key to New Orleans’
flavor and pizzazz. The seafood, the steamboat cruise, the swamp tours, and the history-it’s all there. And the jazz? There are those who would swear that the uncanny beat of the music comes from the intrepid rhythm of the Mississippi’s waters.” Then they have to pick the element that mainly affects the atmosphere and reputation of New Orleans betweenjazz music,its unique food,
three relates to problems with the police. To be more specific, the topics of these questions include property damaging, fighting with classmates, shoplifting, robbery, drug use, drugs dealing, charges or conviction by the police with an illegal activity. Following Heckman and Rubinstein (2001), I assign for each question a value of one if the person engaged in that activity and zero otherwise, I add these values and divide by twenty. I then standardize the index, which is available for about 90% of the sample, to have a mean of zero and a standard deviation of one in the NLSY79 population.
Importantly, immigrants in the NLSY79 were asked about their year of arrival in the U.S. in two survey years, in 1983 and in 1990. In the main part of the analysis, if both answers are non missing but are different, I use the average of the two as year of arrival in the U.S.. If one of the two is missing, I only use the remaining one. To study the relation between age at arrival of immigrants in the U.S. and their parents’ characteristics, I also use the U.S. Census data 1970-2000. These represent random samples of the American population and the sample size is consistently larger than in the NLSY79. It is important to notice that for Census years 1970 to 1990, the year of arrival (and, therefore, also the constructed age at arrival) is reported in intervals. In Census 2000, instead, people were asked about the exact year of entry in the U.S..
NLSY79 sample selection and summary statistics
In the NLSY79, I restrict the sample to individuals born abroad with both parents and the paternal grandfather9 born abroad. I further limit the analysis to those
arrived in the host country when they were seventeen years old or younger, the sometimes called 1.5 immigrant generation. First, these individuals likely did not
choose to migrate to the U.S.. For them, it is less likely that personality traits are part of the decision to become an immigrant, and, in particular, to arrive at a specific age in the U.S., rather than a consequence of that. Importantly, this choice also allows me to focus on people for which human capital investments in the host country are in part a matter of choice. Most U.S. states, in fact, have compulsory schooling laws requiring to attend school until at least the age of sixteen.
There are 537 individuals in the NLSY79 that satisfy these sampling require-ments. For 256 of them, that live in 113 distinct households, I can identify at least one sibling in the survey. However, only 213 of them, corresponding to 94 families, declare a year of arrival that matches the one indicated by their sibling(s).
Table 1.1 reports the summary statistics of the main variables of interest for natives and immigrants in the NLSY79. As for immigrants, I report the summary statistics for the whole sample and for the sample of siblings. As expected, immi-grants have worse educational achievements and get lower scores in cognitive tests. The gap in schooling between the average American and the average first generation immigrant is about 0.5 years. The gap in cognitive skills ranges between 0.3 and 0.8 of a standard deviation, depending on the subject. Perhaps not surprisingly, it is smaller for mathematics and larger for English ability. Interestingly, first generation immigrants behave better than natives, by about 0.35 of a standard deviation. The average age at arrival in the U.S. for first generation immigrants in the NLSY79 is just below the age of 10.
1.4
Results
Graphical analysis
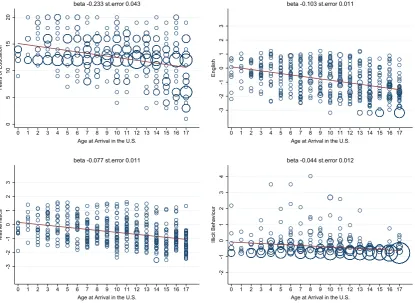
There is a strong negative correlation between age at arrival and educational outcomes. An extra unit in age at arrival corresponds to a decrease in completed education by 1/4 of a year. The mode in education for most ages of arrival is 12 years. However, for people that arrived at the age of 4 or later it is not uncommon to attend school for less than 10 years, and for individuals arrived after the age of 9 it is quite frequent to complete no more than 6 years of education10. Furthermore, although there are individuals achieving the highest grades for almost any age at arrival, the relative frequency decreases with age at migration.
The results in educational achievements also reflect those in performance in cog-nitive tests. One extra unit in age at arrival decreases the performance in mathe-matics tests by 0.077 of a standard deviation, while it reduces the performance in English tests by 0.103 of a standard deviation. For both measures, the lowest scores are obtained by individuals arrived at the age of 10 or later. However, although the relative frequency appears decreasing with age at arrival, there are individuals able to perform better than the average individual in the NLSY79 even among immigrant children arrived after the age of 10.
In terms of probability of being involved in illicit activities, instead, age at arrival plays a positive role. The relation between the two is negative, meaning that the later an immigrant enters in the host country the less he acts illicitly. In particular, the correlation is driven by the almost complete absence of individuals that, arriving after the age of 11, behave more than a standard deviation worse than the mean individual in the NLSY79. It is also evident from the picture that the share of individuals that behave perfectly is an increasing function of age at arrival.
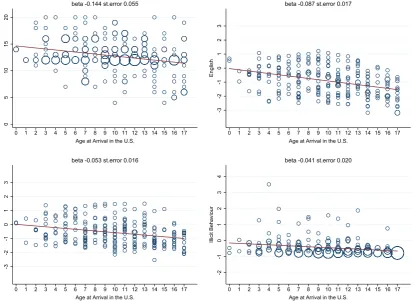
Similar patterns emerge when I use the sample consisting of immigrant siblings, reported in Figure 1-2. Apart from illicit behaviours, however, the correlation
tween the various outcomes and age at arrival are, in this case, reduced by 20% to 40%. It is also worth mentioning that the correlation between years of education and age at arrival is similar in the NLSY79 and in the Census dataset, as shown in Table 1.2. In the Census one extra unit in age at arrival is associated to a reduc-tion in educareduc-tional achievement by between 0.19 and 0.23 of a year, compared to a reduction between 0.14 and 0.26 in the NLSY79.
Main regression results
In Tables 1.3 to 1.9 I show the results of age at arrival on the accumulation of skills using the econometric model described before.
As for cognitive skills, the results are in Tables 1.4 to 1.811. Similarly to
edu-cational achievement, age at arrival has a negative effect on cognitive skills. The results of the linear models estimated with OLS regressions or with family fixed effects without controls for birth order, reported in columns 1 and 3, show that an extra year in age at entry in the U.S. lowers the measured outcomes by 0.02 to 0.07 of a standard deviation. Importantly, the effect is lower and non significantly differ-ent from zero for cognitive mathematical achievemdiffer-ents, whereas it is stronger and significant for English knowledge. As for English knowledge, the effect on paragraph comprehensions is more important than the one on word knowledge. These conclu-sions are unaffected by the inclusion of birth order controls, as shown in columns 5. When I use a more flexible model with categorical ages at arrival and individuals arrived between the age of 0 and 5 as benchmark group, the gap, increasing in age at arrival, is significant for immigrants arrived after the age of 11. Also in this case the effect is stronger for paragraph comprehension, reaching, in the specifica-tion with all the controls, a difference of more than 1 standard deviaspecifica-tion between individuals arrived around the age of 16 and those arrived before the age of 6. As for mathematics, it is instead lower and often very noisy, although significant for individuals arrived around the age of 13 in different specifications for each outcome. Once again, the results on both English knowledge and mathematics proficiency do not change much when I restrict the sample to siblings arrived in the same calendar year.
The results on illicit behaviour are shown in Table 1.9. The linear model es-timated with OLS in column 1 shows that anticipating the arrival in the U.S. by one year reduces the probability of being involved in illicit activities by a statisti-cally significant 0.05 of a standard deviation. Although the estimates of the fixed
obser-effects models in columns 3 and 5 are not significantly different from zero, the point estimates are larger, reaching the level of 0.09 with the full set of controls. The more flexible model using family fixed effects, whose results are shown in columns 4 and 6, suggests that individuals arrived around the age of 7 show substantially better behaviours than those arrived before the age of 6, by about 0.5 of a standard deviation less problematic. Without controls for birth order, however, the results are similar to the ones obtained with OLS, but not significant. With the inclusion of birth order controls, instead, the difference in attitude toward behavioural problems becomes significant for individuals arrived around the age of 8 and around the age of 16. Restricting the sample to siblings arrived in the same year makes the estimates bigger in absolute terms and more often significant.
1.5
Further considerations
In this section I add further considerations to the the main results. I first check if age at arrival has an effect on education, skills accumulation and illicit behaviours through its effect on English proficiency. I then use an accounting exercise to es-timate the effect of the trade-off between cognitive skills and illicit behaviours on labour market outcomes. Third, I study parental selection in age at arrival.
Possible mechanism
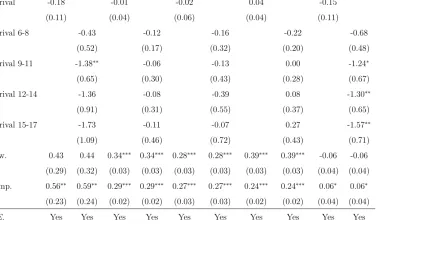
edu-cational and cognitive outcomes, while only paragraph comprehension is marginally correlated with attitudes toward illicit behaviours. Second, the point estimates of the age-at-arrival effect on education and accumulation of cognitive skills reduce substantially, whereas the estimates on illicit behaviours are almost identical to those in the main specification reported in Table 1.9. This means that, differently from Lemmermann and Riphahn (2017), I cannot reject the possibility that verbal ability is one of the channels through which age at arrival affects the development of cognitive skills. Instead, it does not seem to play any role in explaining the effect on illicit behaviours.
An accounting exercise
Overall, my estimates in Section 1.4 suggest that age at arrival is detrimental for educational achievements and for the accumulation of cognitive skills. It reduces, however, the attitude toward illicit behaviours. This implies a potential trade-off in designing migration policies aimed at attracting young children of immigrants.
To address this potential trade-off, I quantify the effect of an extra-year in the home country on labor market outcomes of immigrants in the U.S.. The small sample size, together with the attrition in the participation to the NLSY79 survey, prevents me to directly estimate the effect of age at arrival on labour market outcomes. I then proceed in two steps. In the first one, I estimate the following Mincerian equation
yt=cons+βeet+βcct+βiit+γ1expt+γ2expt2+γXXt+t
whereytrepresents the labour market outcome of interest of individualt, such as the likelihood of being employed and the wage. et stays for educational achievements,
individual. In the set of controls Xt, I include gender and ethnicity. In the second step, I use the estimates ofβe,βcand βi, together with the estimates of the previous section, to approximate the labour market impact of an extra unit in age at arrival, as follows,
c
d y d a =βbe
c
d e d a +βbc
c
d c d a +βbi
c
d i d a
The various βb are the estimates from the first step of my accounting exercise,
re-ported in Table A.22, while cd e
d a, c d c
d a and c d i
d a are the partial effects of age at arrival on education achievements, cognitive skills and illicit behaviour, respectively, estimated in Section 1.4.
The results of this exercise indicate that an extra unit in age at arrival reduces the probability of being employed by less than 0.003, while, conditional on being employed, the likelihood of being employed full time by 0.0025. Both the hourly wage and the yearly earnings decrease by about 0.02 as age at arrival increases by one unit. The results are very similar when I use the much larger sample of American in estimating the Mincerian equation. The only difference is the estimated likelihood of being employed full time, close to zero in this case.
In any case, it is important to notice that if policymakers interpret immigrants’ assimilation as looking like an American the trade-off is non-existent. As Table 1.1 shows, indeed, first generation immigrants tend to behave better than natives and my results suggest that by arriving earlier immigrant children would be more similar to the average American individual along all the human capital dimensions.
Parental selection
negative, those that possess the material or intellectual resources to move earlier to the U.S. should do so.
The results are shown in Table 1.12. Using the whole immigrant sample in the NLSY79, an extra year in mother’s education is associated to a reduction in age at arrival by more than 0.1 units, while the effect of father’s education is a reduction by 0.03. I obtain similar results focusing on families with two or more siblings arrived in the U.S. as children of immigrants. In this case, the effect of father’s education increases in absolute value, being associated to a reduction of 0.17 units in age at arrival. The coefficients are, however, not statistically different from zero. Interestingly, when I also control for family income, I find that the correlation between parental education and age at arrival is basically unchanged, while family income has no role in explaining the age at arrival of children in the U.S.. Since in the NLSY79 I observe family income only in the 1979, I re-estimate in column 4 the same model focusing on immigrants not yet in working age in 1979, and my conclusion does not change. In this case, however, the effect of maternal education on age at arrival of children is smaller in absolute terms.
The findings in this section suggest that parents move to the U.S. taking into account the age at arrival of their children. The selection effect in theory might be driven by material resources allowing to choose the timing of migration from a larger opportunity set, or by parental intellectual ability to anticipate the age at arrival effect on children’ cognitive and non-cognitive development. Although my exercise is limited, my findings suggest that the second element is likely more important than material resources.
stan-education decreases the age at arrival by around 0.12 units, while father’s stan-education by 0.07. These estimates are robust to the inclusion of cohort of arrival fixed effects and to the exclusion of Census years 1970 to 1990, when age at arrival was defined by intervals.
Heterogenity
In the following paragraphs I explore the extent of heterogeneity in the age at arrival effect, depending on the country of origin of immigrant children. Due to the small sample size most of the heterogeneity effects that I describe below are not statistically different from 0. Nonetheless, I believe it is useful to report these results.
In Tables A.14 to A.17, I interact age at arrival with an indicator for immigrants of Mexican origin. In the immigrant siblings sample of the NLSY79 there are 108 individuals arriving from Mexico and 148 arriving from other countries. In Tables A.18 to A.21, instead, I interact age at arrival with an indicator for immigrants ar-riving from countries where English is an official language. Unfortunately, however, there are only 28 immigrant individuals in the immigrant siblings sample that arrive from countries where English is an official language, thus one should be cautions in drawing conclusions on this exercise.
deviations, while the reduction for immigrants from other countries is 0.08 to 0.12. As for illicit behaviors, age at arrival has a larger role for individuals arrived from other countries, while smaller for Mexicans. Thus, for them the trade-off induced by age at arrival is milder.
In Tables A.18 to A.21 I study, instead, the heterogeneity based on the language spoken in the origin country of immigrants. It is important to notice that, given the small sample of individuals coming from countries where English is an official language, the estimates are very noisy and they might be misleading. Particularly when using the empirical model with categorical variables for age at arrival, it is possible, indeed, that the estimates are induced by very few individuals. Further-more, because of cultural and institutional differences across countries, this exercise should not be considered as the solution for disentangling the linguistic component of the age at arrival effect. First, the effect of age at arrival on schooling, in Table A.18, seems stronger in absolute terms for individuals that speak English in their origin countries. In terms of the effect of age at arrival on linguistic achievements, perhaps surprisingly, there is no big difference between the two groups. For immi-grants that speak English in their origin countries, instead, arriving later in the U.S. has no or very limited role in affecting their mathematical scores. To conclude, in Table A.21 I find no differences between the two groups in terms of the effect of age at arrival on social behaviors.
1.6
Robustness checks
American educational system. Forth, I run the regressions using a subsample of individuals arrived at the age of 13 or younger.
Presence of both parents in households
The presence of both parents in households is likely correlated with both the de-velopment of personality traits of young individuals, as well as with age at arrival. In particular, within families, children arrived when they are younger are also those more likely to suffer the absence of one parent (or both) for a longer period of time. This may be due, for example, to parental separation or death.
To address this concern, in Tables A.1 to A.7 I repeat the analysis controlling for the presence of both parents in the household. Both the magnitude and the significance of the estimates of this exercise are almost identical to those described in the main section.
Excluding immigrants arriving as dropouts
The results on schooling, reported in Table 1.3, might mix two effects. On the one hand, age at arrival might increase the likelihood of leaving school after arriving in the U.S., on the other hand it might reduce the likelihood of re-enrolling after arriving in the U.S. as a dropout.
arrived between the ages 15 and 17 are partly driven by the high likelihood of not re-enrolling in school after becoming dropouts in the home countries. Nonetheless, for individuals attending at least one year of formal education in the U.S., an arrival around the age of 16 still accounts for a reduction of 1.15 to 1.8 years of completed education, compared to individuals arrived before the age of 6.
Controlling for time trends in the education system
A possibility for the results on schooling, reported in Table 1.3, is that the age at arrival variable captures time trends in the American educational systems. For ex-ample, individuals that arrived younger in the U.S. attended school in more recent years. Thus, if the American educational system evolved in the period under con-sideration, my estimates could be biased even when considering the within family variation.
First, given that the individuals used in my study are all born within a window of 7 years, it is quite unlikely that major changes in the American schooling system dif-ferentially affected their educational outcomes. However, I additionally re-estimate my model using a pooled sample of immigrants and natives, controlling for a time trend. As long as changes in the schooling systems have the same impact on im-migrants and natives, this empirical strategy addresses the concern. In particular, the age at arrival effect is estimated via the within immigrant family variation in age at arrival in the U.S., while the time trends in the American educational system is controlled for using the within family variation in year of birth across siblings in native families. I report the result of this robustness test in Table A.9. I conclude from this Table that the main result on schooling is robust to time trends in the American schooling system12.
Excluding immigrants arrived after the age of 14
One concern of my empirical setting is that children of immigrants can affect the parental decision on the timing of migration. Children in their teenage years, in particular, might be those more likely to influence their parents.
To address this concern, I exclude from my analysis individuals arrived after the age of 14. I only report, in Tables A.10 to A.13, results for the linear model. The coefficients of the more flexible model, with age at arrival defined as categorical variable, are indeed unaffected by this sampling strategy. The magnitudes of the estimated coefficients are very similar to those described in the main section. In general, the coefficients are a bit larger in absolute value, although reducing the sample size increases the standard errors, too. Therefore, most of the coefficients, in these cases, turn out to be insignificant.
1.7
Conclusion
In this paper I studied the effect of age at arrival on the development of children of immigrants’ personalities. As the number of immigrants is rising in most of the richest economies, they are becoming increasingly important in shaping the human capital of the average individual in these economies. Young immigrants are a peculiar category in that they do not choose to become immigrants, but they might face more severe challenges and bring additional benefits to their host countries. Indeed, relative to their parents, they need to switch to a new educational system and, on average, they stay in the host countries for longer.
behaviours. Using the variation in age at arrival across siblings living in the same household, I showed that age at arrival has a negative effect on schooling and cogni-tive outcomes, but it also reduces the likelihood of being involved in illicit activities. In other words, the earlier an immigrant enters in the U.S., the more similar he becomes to the average American, along several human capital dimensions often used in the literature. This suggests the presence of a policy trade-off in targeting immigrant families arriving with their children, as, perhaps contrary to a popular belief, Americans in the NLSY79 tend to behave more illicitly than first generation immigrants. I also showed through indirect estimates that the net effect of age at arrival on labour market outcomes is negative.
As for cognitive skills, the effect is stronger for linguistic ability, and milder for mathematics. I also documented that linguistic ability might be a relevant channel through which age at arrival affects the cognitive achievements, but it is unlikely to be an important one for the effect of age at arrival on illicit activities. From a policy perspective, providing linguistic support to immigrants might then be beneficial to reduce their barriers in the accumulation of cognitive skills, retaining some positive aspects of being a foreign-born individual.
Figure 1-1: The correlation between different outcomes and age at arrival in the U.S. 0 5 10 15 20
Years of Education
0 1 2 3 4 5 6 7 8 9 10 11 12 13 14 15 16 17
Age at Arrival in the U.S. beta -0.233 st.error 0.043
-3 -2 -1 0 1 2 3 English
0 1 2 3 4 5 6 7 8 9 10 11 12 13 14 15 16 17
Age at Arrival in the U.S. beta -0.103 st.error 0.011
-3 -2 -1 0 1 2 3 Mathematics
0 1 2 3 4 5 6 7 8 9 10 11 12 13 14 15 16 17
Age at Arrival in the U.S. beta -0.077 st.error 0.011
-2 -1 0 1 2 3 4 Illicit Behaviour
0 1 2 3 4 5 6 7 8 9 10 11 12 13 14 15 16 17
Age at Arrival in the U.S. beta -0.044 st.error 0.012
Figure 1-2: The correlation between different outcomes and age at arrival in the U.S. 0 5 10 15 20
Years of Education
0 1 2 3 4 5 6 7 8 9 10 11 12 13 14 15 16 17
Age at Arrival in the U.S. beta -0.144 st.error 0.055
-3 -2 -1 0 1 2 3 English
0 1 2 3 4 5 6 7 8 9 10 11 12 13 14 15 16 17
Age at Arrival in the U.S. beta -0.087 st.error 0.017
-3 -2 -1 0 1 2 3 Mathematics
0 1 2 3 4 5 6 7 8 9 10 11 12 13 14 15 16 17
Age at Arrival in the U.S. beta -0.053 st.error 0.016
-2 -1 0 1 2 3 4 Illicit Behaviour
0 1 2 3 4 5 6 7 8 9 10 11 12 13 14 15 16 17
Age at Arrival in the U.S. beta -0.041 st.error 0.020
Table 1.1: Summary statistics; NLSY79
Sample Native 1st Generation
Whole Siblings Years of Schooling 13.50 13.06 13.05 Word Knowledge -0.02 -0.75 -0.79 Paragraph Comprehension -0.01 -0.70 -0.70 Arithmetic Reasoning -0.02 -0.48 -0.45 Numerical Operations -0.02 -0.34 -0.32 Mathematics Knowledge -0.03 -0.38 -0.32 Illicit Behaviours 0.00 -0.35 -0.40
Age At Arrival 9.90 9.71
Table 1.2: The correlation between educational achievement and age at arrival; NLSY79 and Census
Dataset NLSY79 Census
Sample Whole Siblings All Years, Whole All Years, NLSY Years of Birth 2000, Whole 2000, NLSY Years of Birth
(1) (2) (3) (4)
Age At Arrival -0.26∗∗∗ -0.14∗∗∗ -0.19∗∗∗ -0.21∗∗∗ -0.21∗∗∗ -0.23∗∗∗
(0.03) (0.06) (0.00) (0.00) (0.00) (0.00)
N 537 256 614800 141314 304626 70205
The Table above reports the results of regressions of years of education on immigrants’ age at arrival in the U.S.. As for NLSY data, Whole refers to immigrant individuals arrived in the U.S. at the age of 17 or younger, while Siblings refers to immigrant individuals with at least one brother or sister in the same sample. As for Census data, Whole refers to immigrant individuals in prime age, arrived in the U.S. at the age of 17 or younger. NLSY Years of Birth refers to immigrant individuals in prime age arrived in the U.S. at the age of 17 or younger, and belonging to the same cohorts of immigrants in the NLSY79. ∗,∗∗ , and∗∗∗ denote significance at the 10%, 5%, 1% level, respectively.
Table 1.3: The effect of age at arrival on years of education; ordinary least squares and family fixed effects regressions
Sample Full Same Year of Arrival
(1) (2) (3) (4) (5) (6) (7) (8) (9) (10) (11) (12)
Age At Arrival -0.14∗∗ -0.14∗∗ -0.15 -0.17∗∗ -0.16∗∗ -0.20
(0.06) (0.06) (0.09) (0.08) (0.08) (0.13)
Age At Arrival 6-8 0.60 0.12 0.12 0.57 -0.31 -0.37
(0.91) (0.45) (0.50) (1.05) (0.47) (0.52)
Age At Arrival 9-11 -0.22 -0.92∗ -0.91∗ -0.24 -1.41∗∗ -1.51∗∗
(0.61) (0.49) (0.54) (0.78) (0.63) (0.72)
Age At Arrival 12-14 -0.77 -1.33∗∗ -1.31∗ -0.99 -1.76∗∗ -1.97∗∗
(0.57) (0.58) (0.78) (0.68) (0.71) (0.97)
Age At Arrival 15-17 -2.27∗∗ -1.69∗∗ -1.66∗ -2.66∗∗ -2.09∗∗ -2.37∗∗
(0.88) (0.72) (0.98) (1.01) (0.82) (1.18)
The Table above reports the results of regressions of years of education on immigrants’ age at arrival in the U.S.. In odd columns I report the results of a linear regression model, whereas even columns display the results of a model using categorical variables for intervals of age at arrival in the U.S.. In each specification I control for a sex indicator and, when specified, for family fixed effects and a birth order control. In the first six columns the sample consists of immigrant individuals arrived in the U.S. at the age of 17 or younger, with at least one sibling in the sample. In columns seven to twelve the sample consists of immigrant individuals arrived in the U.S. at the age of 17 or younger, with at least one sibling in the sample, with the additional requirement that each sibling arrived in the U.S. in the same calendar year. Heteroskedasticity robust standard errors are clustered at the family level and they are shown in parenthesis. ∗,∗∗ , and∗∗∗ denote significance at the 10%, 5%, 1% level, respectively.
Table 1.4: The effect of age at arrival on word knowledge; ordinary least squares and family fixed effects regressions
Sample Full Same Year of Arrival
(1) (2) (3) (4) (5) (6) (7) (8) (9) (10) (11) (12)
Age At Arrival -0.06∗∗ -0.06∗∗ -0.05∗ -0.05∗ -0.05∗ -0.04
(0.02) (0.02) (0.03) (0.02) (0.03) (0.03)
Age At Arrival 6-8 -0.03 -0.03 -0.01 -0.06 -0.06 -0.06
(0.14) (0.14) (0.15) (0.15) (0.13) (0.15)
Age At Arrival 9-11 -0.17 -0.17 -0.14 -0.15 -0.15 -0.12
(0.12) (0.11) (0.14) (0.12) (0.10) (0.16)
Age At Arrival 12-14 -0.50∗∗∗ -0.50∗∗∗ -0.47∗ -0.48∗∗ -0.48∗∗∗ -0.49∗∗
(0.19) (0.19) (0.25) (0.19) (0.18) (0.25)
Age At Arrival 15-17 -0.60∗∗ -0.60∗∗ -0.53 -0.51∗∗ -0.51∗∗ -0.51
(0.25) (0.25) (0.33) (0.25) (0.25) (0.35)
The Table above reports the results of regressions of word knowledge on immigrants’ age at arrival in the U.S.. In odd columns I report the results of a linear regression model, whereas even columns display the results of a model using categorical variables for intervals of age at arrival in the U.S.. In each specification I control for a sex indicator and, when specified, for family fixed effects and a birth order control. All these controls are interacted with a dummy variable indicating the immigration status. The sample in each column consists of native and immigrant siblings. In the immigrant sample of the first six columns I keep individuals arrived in the U.S. at the age of 17 or younger, with at least one sibling in the sample. In columns seven to twelve the immigrant sample consists of immigrant individuals arrived in the U.S. at the age of 17 or younger, with at least one sibling in the sample, with the additional requirement that each sibling arrived in the U.S. in the same calendar year. Heteroskedasticity robust standard errors are clustered at the family level and they are shown in parenthesis. ∗, ∗∗ , and ∗∗∗ denote significance at the 10%, 5%, 1% level, respectively.
Table 1.5: The effect of age at arrival on paragraph comprehension; ordinary least squares and family fixed effects regressions
Sample Full Same Year of Arrival
(1) (2) (3) (4) (5) (6) (7) (8) (9) (10) (11) (12)
Age At Arrival -0.07∗∗ -0.07∗∗ -0.09∗∗ -0.07∗∗ -0.07∗∗ -0.12∗∗
(0.03) (0.03) (0.04) (0.03) (0.03) (0.06)
Age At Arrival 6-8 0.15 0.15 0.05 0.08 0.08 -0.06
(0.16) (0.15) (0.17) (0.18) (0.16) (0.18)
Age At Arrival 9-11 -0.17 -0.17 -0.29 -0.17 -0.17 -0.37
(0.17) (0.17) (0.19) (0.22) (0.21) (0.25)
Age At Arrival 12-14 -0.67∗∗∗ -0.67∗∗∗ -1.00∗∗∗ -0.68∗∗ -0.68∗∗ -1.15∗∗∗
(0.23) (0.23) (0.28) (0.27) (0.26) (0.34)
Age At Arrival 15-17 -0.80∗∗∗ -0.80∗∗∗ -1.23∗∗∗ -0.85∗∗∗ -0.85∗∗∗ -1.45∗∗∗
(0.29) (0.29) (0.37) (0.32) (0.32) (0.42)
The Table above reports the results of regressions of paragraph comprehension on immigrants’ age at arrival in the U.S.. In odd columns I report the results of a linear regression model, whereas even columns display the results of a model using categorical variables for intervals of age at arrival in the U.S.. In each specification I control for a sex indicator and, when specified, for family fixed effects and a birth order control. All these controls are interacted with a dummy variable indicating the immigration status. The sample in each column consists of native and immigrant siblings. In the immigrant sample of the first six columns I keep individuals arrived in the U.S. at the age of 17 or younger, with at least one sibling in the sample. In columns seven to twelve the immigrant sample consists of immigrant individuals arrived in the U.S. at the age of 17 or younger, with at least one sibling in the sample, with the additional requirement that each sibling arrived in the U.S. in the same calendar year. Heteroskedasticity robust standard errors are clustered at the family level and they are shown in parenthesis. ∗,∗∗ , and ∗∗∗ denote significance at the 10%, 5%, 1% level, respectively.
Table 1.6: The effect of age at arrival on arithmetic reasoning; ordinary least squares and family fixed effects regressions
Sample Full Same Year of Arrival
(1) (2) (3) (4) (5) (6) (7) (8) (9) (10) (11) (12)
Age At Arrival -0.02 -0.02 -0.05 -0.01 -0.01 -0.06
(0.03) (0.03) (0.03) (0.04) (0.04) (0.05)
Age At Arrival 6-8 -0.10 -0.10 -0.19 -0.04 -0.04 -0.16
(0.14) (0.12) (0.15) (0.16) (0.13) (0.18)
Age At Arrival 9-11 -0.11 -0.11 -0.22 -0.03 -0.03 -0.21
(0.19) (0.16) (0.22) (0.24) (0.20) (0.29)
Age At Arrival 12-14 -0.21 -0.21 -0.53∗∗ -0.14 -0.14 -0.58∗
(0.29) (0.25) (0.26) (0.32) (0.27) (0.33)
Age At Arrival 15-17 -0.19 -0.19 -0.60 -0.15 -0.15 -0.70
(0.31) (0.29) (0.40) (0.35) (0.31) (0.49)
The Table above reports the results of regressions of arithmetic reasoning on immigrants’ age at arrival in the U.S.. In odd columns I report the results of a linear regression model, whereas even columns display the results of a model using categorical variables for intervals of age at arrival in the U.S.. In each specification I control for a sex indicator and, when specified, for family fixed effects and a birth order control. All these controls are interacted with a dummy variable indicating the immigration status. The sample in each column consists of native and immigrant siblings. In the immigrant sample of the first six columns I keep individuals arrived in the U.S. at the age of 17 or younger, with at least one sibling in the sample. In columns seven to twelve the immigrant sample consists of immigrant individuals arrived in the U.S. at the age of 17 or younger, with at least one sibling in the sample, with the additional requirement that each sibling arrived in the U.S. in the same calendar year. Heteroskedasticity robust standard errors are clustered at the family level and they are shown in parenthesis. ∗,
∗∗ , and∗∗∗ denote significance at the 10%, 5%, 1% level, respectively.
Table 1.7: The effect of age at arrival on numerical operations; ordinary seast squares and family fixed effects regressions
Sample Full Same Year of Arrival
(1) (2) (3) (4) (5) (6) (7) (8) (9) (10) (11) (12)
Age At Arrival -0.04 -0.04 -0.04 -0.05 -0.05 -0.06
(0.04) (0.04) (0.05) (0.04) (0.04) (0.06)
Age At Arrival 6-8 -0.03 -0.03 -0.04 -0.16 -0.16 -0.19
(0.28) (0.27) (0.29) (0.30) (0.29) (0.31)
Age At Arrival 9-11 -0.06 -0.06 -0.07 -0.21 -0.21 -0.26
(0.30) (0.31) (0.32) (0.35) (0.36) (0.40)
Age At Arrival 12-14 -0.50 -0.50 -0.54 -0.70∗ -0.70∗ -0.83
(0.34) (0.36) (0.42) (0.39) (0.42) (0.52)
Age At Arrival 15-17 -0.37 -0.37 -0.41 -0.44 -0.44 -0.60
(0.50) (0.54) (0.62) (0.54) (0.58) (0.70)
The Table above reports the results of regressions of numerical operations ability on immigrants’ age at arrival in the U.S.. In odd columns I report the results of a linear regression model, whereas even columns display the results of a model using categorical variables for intervals of age at arrival in the U.S.. In each specification I control for a sex indicator and, when specified, for family fixed effects and a birth order control. All these controls are interacted with a dummy variable indicating the immigration status. The sample in each column consists of native and immigrant siblings. In the immigrant sample of the first six columns I keep individuals arrived in the U.S. at the age of 17 or younger, with at least one sibling in the sample. In columns seven to twelve the immigrant sample consists of immigrant individuals arrived in the U.S. at the age of 17 or younger, with at least one sibling in the sample, with the additional requirement that each sibling arrived in the U.S. in the same calendar year. Heteroskedasticity robust standard errors are clustered at the family level and they are shown in parenthesis. ∗,∗∗ , and∗∗∗ denote significance at the 10%, 5%, 1% level, respectively.
Table 1.8: The effect of age at arrival on mathematics knowledge; ordinary least squares and family fixed effects regressions
Sample Full Same Year of Arrival
(1) (2) (3) (4) (5) (6) (7) (8) (9) (10) (11) (12)
Age At Arrival -0.04 -0.04 -0.03 -0.03 -0.03 -0.00
(0.02) (0.02) (0.04) (0.03) (0.03) (0.04)
Age At Arrival 6-8 -0.24 -0.24 -0.24 -0.27 -0.27 -0.25
(0.17) (0.17) (0.18) (0.19) (0.19) (0.20)
Age At Arrival 9-11 -0.27 -0.27 -0.25 -0.19 -0.19 -0.14
(0.18) (0.19) (0.21) (0.23) (0.24) (0.27)
Age At Arrival 12-14 -0.48∗∗ -0.48∗∗ -0.49 -0.42 -0.42 -0.39
(0.22) (0.23) (0.30) (0.26) (0.27) (0.35)
Age At Arrival 15-17 -0.40 -0.40 -0.38 -0.34 -0.34 -0.27
(0.26) (0.26) (0.36) (0.29) (0.30) (0.42)
The Table above reports the results of regressions of mathematics knowledge on immigrants’ age at arrival in the U.S.. In odd columns I report the results of a linear regression model, whereas even columns display the results of a model using categorical variables for intervals of age at arrival in the U.S.. In each specification I control for a sex indicator and, when specified, for family fixed effects and a birth order control. All these controls are interacted with a dummy variable indicating the immigration status. The sample in each column consists of native and immigrant siblings. In the immigrant sample of the first six columns I keep individuals arrived in the U.S. at the age of 17 or younger, with at least one sibling in the sample. In columns seven to twelve the immigrant sample consists of immigrant individuals arrived in the U.S. at the age of 17 or younger, with at least one sibling in the sample, with the additional requirement that each sibling arrived in the U.S. in the same calendar year. Heteroskedasticity robust standard errors are clustered at the family level and they are shown in parenthesis.
∗,∗∗ , and∗∗∗ denote significance at the 10%, 5%, 1% level, respectively.
Table 1.9: The effect of age at arrival on illicit behaviours; ordinary least squares and family fixed effects regressions
Sample Full Same Year of Arrival
(1) (2) (3) (4) (5) (6) (7) (8) (9) (10) (11) (12)
Age At Arrival -0.05∗∗∗ -0.06 -0.09 -0.05∗∗∗ -0.08 -0.15
(0.01) (0.06) (0.08) (0.01) (0.07) (0.11)
Age At Arrival 6-8 -0.34∗∗ -0.49 -0.54 -0.32 -0.55 -0.66
(0.17) (0.37) (0.37) (0.20) (0.47) (0.48)
Age At Arrival 9-11 -0.36∗∗∗ -0.73 -0.83∗ -0.32∗∗ -0.97 -1.22∗
(0.13) (0.48) (0.50) (0.16) (0.62) (0.66)
Age At Arrival 12-14 -0.54∗∗∗ -0.55 -0.75 -0.58∗∗∗ -0.89 -1.32∗∗
(0.14) (0.46) (0.50) (0.15) (0.56) (0.64)
Age At Arrival 15-17 -0.71∗∗∗ -0.65 -0.93∗ -0.71∗∗∗ -0.98∗ -1.58∗∗
(0.13) (0.47) (0.54) (0.15) (0.57) (0.70)
The Table above reports the results of regressions of illicit behaviours on immigrants’ age at arrival in the U.S.. In odd columns I report the results of a linear regression model, whereas even columns display the results of a model using categorical variables for intervals of age at arrival in the U.S.. In each specification I control for a sex indicator and, when specified, for family fixed effects and a birth order control. All these controls are interacted with a dummy variable indicating the immigration status. The sample in each column consists of native and immigrant siblings. In the immigrant sample of the first six columns I keep individuals arrived in the U.S. at the age of 17 or younger, with at least one sibling in the sample. In columns seven to twelve the immigrant sample consists of immigrant individuals arrived in the U.S. at the age of 17 or younger, with at least one sibling in the sample, with the additional requirement that each sibling arrived in the U.S. in the same calendar year. Heteroskedasticity robust standard errors are clustered at the family level and they are shown in parenthesis. ∗, ∗∗ , and∗∗∗ denote significance at the 10%, 5%, 1% level, respectively.
Table 1.10: The effect of age at arrival on several outcomes controlling for english ability; whole sample
Schooling Arithmetic Num. Operations Maths Knowledge Illicit
(1) (2) (3) (4) (5) (6) (7) (8) (9) (10)
Age At Arrival -0.11 -0.01 -0.00 0.01 -0.10
(0.08) (0.03) (0.05) (0.03) (0.09)
Age At Arrival 6-8 0.03 -0.20 -0.05 -0.24 -0.54
(0.49) (0.15) (0.28) (0.17) (0.38)
Age At Arrival 9-11 -0.79 -0.09 0.05 -0.12 -0.89∗
(0.54) (0.22) (0.33) (0.21) (0.52)
Age At Arrival 12-14 -0.74 -0.08 -0.14 -0.07 -0.88∗
(0.79) (0.24) (0.42) (0.30) (0.50)
Age At Arrival 15-17 -1.07 -0.06 0.07 0.12 -1.06∗