2017 2nd International Conference on Software, Multimedia and Communication Engineering (SMCE 2017) ISBN: 978-1-60595-458-5
Ratings Distribution Recommendation Model-based Collaborative
Filtering Recommendation Algorithm
Tao-tao PAN
*, Qin-rang LIU and Chang LIU
China National Digital Switching System Engineering and Technological R&D Center, Zhengzhou 450002, China
*Corresponding author
Keywords: Collaborative filtering, Similarity, Popular ratings, Rating scale.
Abstract. In order to solve the problem of the popular item ratings interfering in similarity calculation, we proposed the ratings distribution recommendation model. Based on this model, we designed a new collaborative filtering algorithm. According to ratings distribution, this algorithm firstly get the amount of information carried (The Shannon Entropy). Then, it calculated the rating weights to filter into traditional similarity calculation. The experimental results show that the algorithm can effectively alleviate the above problem and improve the performance of the algorithm.
Introduction
With the development of Internet technology, the problem of information overload is becoming more and more serious. It is very difficult for people to get the information they need from the ocean of
knowledge[1]. In this context, the recommendation system arises at the historic moment.According to
the different methods used in recommendation, recommendation system can be divided into content-based recommendation system, collaborative filtering recommendation system and hybrid
recommendation system.Collaborative filtering algorithm first finds a set of users with similar interests
and goals of the user as the neighbor users, then according to the neighbor users on the item's rating to predict the target user rating and recommendation. Collaborative filtering algorithm is widely used in
recommendation system because it is not limited by the content of the recommended item[2].
Despite the great success of collaborative filtering technology in the field of recommender systems,
there are still serious problems such as data sparsity[3], which affect the performance of
recommendation system. In order to improve the accuracy of recommendation, scholars have put
forward some solutions. Huang Chuangguang[4] proposed a method to adaptively select the
recommended target user group and on the basis of selected subgroups of uncertain neighbor trust as
method, finally get the neighbor. Kaleli[5] uses the information of the user to get the information
entropy of the user and the item rating, so as to adjust the choice of the nearest neighbor. The nearest
neighbor selection is more reasonable by clustering method, in the study of Wang[6]. Some scholars
study from the perspective of similarity calculation. Jang [7] and Xu[8] used the matrix filling to
alleviate the sparsity, but the rating filled the subjectivity is too strong. Guo[9] adopt the method of
matrix decomposition, the decomposition process will lose useful information. Luo[10] is introduced
to improve the number of common rating similarity calculation accuracy.
In order to solve the above problem, this paper designs a recommendation model based on the traditional recommendation model. In the model, the amount of the information of the rating in the item is estimated and the weight of the rating is distinguished, so as to reduce the interference to the similarity calculation. Based on this model, this paper proposes a collaborative filtering algorithm (RDRM-CF), which is based on the distribution model of the rating value distribution. The algorithm can effectively filter the interference of the popular item ratings and improve the accuracy of the algorithm.
Related Concepts and Model Design
Related Concepts and Definitions
Aiming at the problems existing in the traditional algorithm, this paper defines the concept of "item rating heat value".
(Definitions 1)Item rating heat:Item i in the rating value j (j=1, 2, 3, 4, 5) the frequency of use,
set to j
i
d .
(Definitions 2)Item rating using probability: The heat value of the rating j in the item i
accounts for the proportion of the sum of all the ratings, set to j
i
p , and
5
1 1
j i j
p
. The greater theprobability of the use of the rating, the greater the interference in the calculation of similarity
(Definitions 3)Item rating probability vector:In the item, the probability of 5 scoring values
(1, 2, 3, 5,), which is denoted as pi, 1 2 3 4 5
( , , , , )
i i i i i i
p p p p p p , is a vector, which reflects the personalized
distribution trend of the rating value.
(Definitions 4)Item rating information content: The amount of information carried by the
rating value j in the item i (i.e., Shannon entropy) is set to j
i
H . The amount of information is a
measure of the amount of information in the field of statistics, if the probability of occurrence of the event, the less the amount of information, that is, the amount of information is inversely proportional
to the probability of occurrence. Assuming that the probability of occurrence of an event is p, the
amount of information for this event is shown in equation (1):
( ) log( )
H X p (1) (Definitions 5) Item rating weight: The weight of the rating j in the item i, which represents
the degree of credibility of the rating value, is set to j
i
tr . j i
tr and j i
H are proportional to the larger the
j i
H , the greater the j
i
tr .
(Definitions 6) Item rating weight vector: The weights of the 5 ratings in the item (1, 2, 3, 5)
were recorded in Tri,
1 2 3 4 5
( , , , , )
i i i i i i
Tr tr tr tr tr tr .
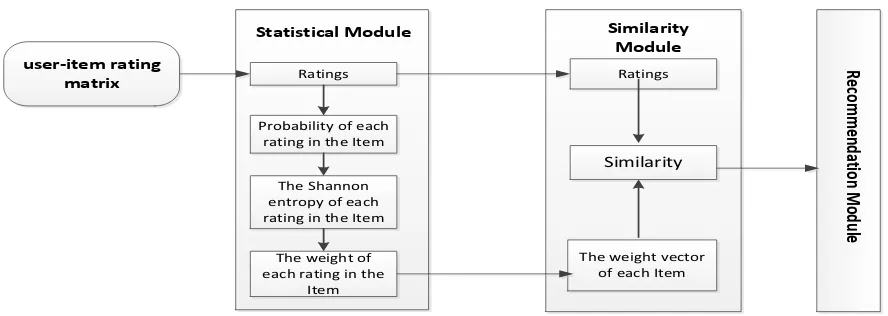
Model Design
user-item rating matrix
Statistical Module
Ratings
Probability of each rating in the Item
The Shannon entropy of each rating in the Item
The weight of each rating in the
Item
The weight vector of each Item
[image:3.595.79.523.67.225.2]Ratings Similarity Similarity Module Re co m m en da tio n M od ule
Figure 1. Rating value distribution recommendation model.
Algorithm Design
The Statistics of Each Rating Value in the Item
If there are m users and n items in the system, the rating information can be expressed by the rating matrix X. X which represents the user u on the item I rating, with the 1~5 5 grades to express the user's preference for the item, the user - item rating matrix as shown in formula (2):
1,1 1,
,1 ,
n
m m n
r r R r r (2)
In the item, the distribution of the rating value presents a personalized trend, that is, the different
values of the items in the item are different. The introduction of parameter tu i, , u [1,m], if ru i, j,
{1,, 2,3, 4,5}
j , then tu i, 1, else tu i, 0. The value of the i value of the item j j
i
d as shown in formula
(3).
, 1
m j
i u i
u
d t
(3)Probability Statistics of Each Rating in the Item
According to the value of the value of the calculation of the probability of heat, the item i rating value
of the probability of j
i
p , as shown in the formula (4) :
1 2 3 4 5
j
j i
i
i i i i i
d p
d d d d d
(4) Because the problem of data sparseness can affect the accuracy of the probability calculation of the rating value, this paper introduces the adjustment parameter t, t is a certain non negative number, the improved formula (4) as shown in formula (5):
1 2 3 4 5
( ) 5
j
j i
i
i i i i i
d t p
d d d d d t
(5)
Weight Calculation of Each Rating in the Item
The core idea of this section is to divide the corresponding weights according to the size of the value of the information, in order to filter the interference. The greater the probability of a rating value, the smaller the amount of information, the smaller the meaning, so the smaller the value of the rating. The
formula of the rating value j
i
tr and its probability j
i
tr is shown in (7):
1 = 1log2 , 1 0
j j j
i i i
tr k H k p k (7)
At the same time, due to the presence of
1 2 3 4 5
( ) 5
j
j i
i
i i i i i
d t p
d d d d d t
. Because of parameter t,
j i
p is generally in the 0.2 floating up and down. In order to make the weight formula with a uniform
standard, so that j=0.2
i
p , its weight is 1, the weight formula into formula (8) shown:
2 2 log log 5 j j i i p
tr (8)
The weight vector of each rating information in the item i is shown in formula (9):
1 2 3 4 5
( , , , , )
i i i i i i
Tr tr tr tr tr tr (9)
Similarity Calculation
The traditional similarity calculation algorithm commonly used methods are the following three types: cosine similarity, modified cosine similarity and Pearson correlation coefficient. The similarity calculation method is improved based on the correlation coefficient of Pearson. The user u and user V use the Pearson correlation coefficient to calculate the similarity as shown in formula (10):
, , , , , 2 2 , , ( )( ) ( , ) ( ) ( )
i u v
i u v i u v
u i u v i v I I
u i u v i v
I I I I
r r r r
sim u v
r r r r
(10),
u i
r , rv i, , respectively, that the user u, V on the item I rating value. ru,rv, respectively, that the user u,
the average rating of v. Iu,Iv, respectively, indicating that the user u, v has rating the item. Iu v, said
the user u, v joint scoring items. The similarity calculation using Pearson correlation coefficient, the weight of each default item rating the same, but did not take into account the "interference rating value" in the similarity calculation process, the calculation result is not accurate enough. In this paper, the item rating value information is used to measure the weight of the different scoring values in the
item, and the weight of the item rating weight vector Tri. is divided into different weights in the item I
by Tri. The improved similarity calculation method is shown in formula (11):
, , , , , , , , , 2 2 , , ( )( ) ( , ) ( ( )) ( ( ))
u i v i
i u v
u i v i
i u v i u v
r r
u i u v i v i i I I
r r
i u i u i v i v
I I I I
r r r r tr tr
tsim u v
tr r r tr r r
(11),
u i
r i
tr is the weight of the rating value for the user u in the item i. ru i, is the weight of the user's v
rating rv i, . Use the value of the amount of information to adjust the weights of the different items in
Experimental Results and Analysis
Data Sets and Comparison Algorithms
Movielens_100K was used in the experiment. Movielens_100K stores 943 users for the 1682 films of the 100000 scoring. In the experiment, 20% of the data sets were randomly selected as the test set and the other as the training set, and then the performance of the following three algorithms was compared with that of the 80% algorithms.
(1) The traditional collaborative filtering recommendation algorithm (Per-CF) based on the similarity of Pearson correlation coefficient;
(2) Collaborative filtering recommendation algorithm (LFRM-CF) based on low pass filtering recommendation model proposed by [11];
(3) A collaborative filtering recommendation algorithm (RDRM-CF) proposed in this paper based on the rating value distribution recommendation model.
Evaluation Criterion
In this paper, the average absolute deviation (MAE) is used as the evaluation standard to evaluate the accuracy of the proposed algorithm:
, , 1
N
u i u i i
p q MAE
N
(12), u i
p , which represents the user's u forecast rating on the item i, qu i, said the user u the true rating of
the item i, N said the user u has been the number of items.
Experiment and Result Analysis
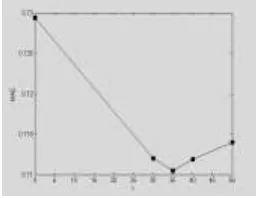
Experiment 1 Selection of threshold λ and parameter t
[image:5.595.233.361.485.584.2]In order to select the appropriate parameter t, MAE is the best. The experiment makes the nearest neighbor number N=30, take t=5, 10, 15, 20, 25, 35, 40,50 and observe the value of MAE, the experimental results in Movielens_100K data set are shown in Figure 4:
Figure 4. Relationship between t and MAE.
As can be seen from Figure 4: focus on the Movielens_100K data, for different number of nearest neighbors, when t=35, the best RDRM-CF algorithm, several experiments are the best when t=34, so the follow-up experiment t=34.
Experiment 2 The influence of nearest neighbor number on algorithm accuracy
Figure 5. The relationship between the k and MAE.
As can be seen from Figure 5:
(1) The accuracy of the three algorithms increases gradually with the increase of k, and the accuracy of the algorithm tends to be stable around k=40.
(2) The accuracy of RDRM-CF algorithm is higher than the other two algorithms. Analysis of experimental results:
(1) When the number of neighbors increases, the useful information increases, and the accuracy of the algorithm is improved. When the number of neighbors is higher than 40, the accuracy of the algorithm tends to be stable. Therefore, the k=40.
(2) Movielens_100K belongs to the high sparse data set, and the interference of the item heat rating is very obvious, which leads to the decrease of the accuracy of the similarity calculation. The RDRM-CF algorithm through the statistics item rating information value to reasonably classify the weight rating and filter the interference of the popular item ratings to the similarity calculation, so RDRM-CF algorithm accuracy ratio the other two methods.
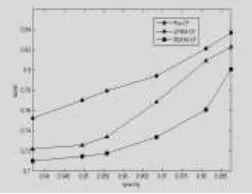
Experiment 3 The influence of sparsity on algorithm accuracy
In order to further analyze the data set of sparsity effects on RDRM-CF algorithm, the random user rating to reduce set different sparsity, focuses on the comparison of three algorithms in Movielens_100K data accuracy, the experimental results are shown in figure 6.
Figure 6. The relationship between sparsity and MAE sparsity.
As can be seen from figure 6:
With the increase of sparsity, the accuracy of the three algorithms is gradually decreased, but the accuracy of the algorithm RDRM-CF is also decreased, but it has been higher than the other two algorithms.
Analysis of experimental results:
With the increase of the sparsity, the rating information is reduced and the rating of the items is decreased rapidly, and the reliability of the result is reduced. At the same time, with the increases of sparsity, the interference of the popular item ratings to similarity calculation will be more obvious, and the RDRM-CF algorithm can reasonably divide the different weight of ratings, so the performance of RDRM-CF has been better than the other two algorithms.
Conclusion
[image:6.595.234.360.438.535.2]algorithm is proposed. The experimental results show that the RDRM -CF algorithm improves the performance compared with the traditional algorithm.
Reference
[1] He C, Parra D, Verbert K. Interactive recommender systems: A survey of the state of the art and future research challenges and opportunities [J]. Expert Systems with Applications, 2016, 56: 9-27.
[2] Su X, Khoshgoftaar T M. A survey of collaborative filtering techniques [J]. Advances in artificial intelligence, 2009, 2009: 4.
[3] Kim H N, Ji A T, Ha I, et al. Collaborative filtering based on collaborative tagging for enhancing the quality of recommendation[J]. Electronic Commerce Research and Applications, 2010, 9(1): 73-83.
[4] Huang Chuangguang, Yin Jian, Wang Jing, et al. Uncertain neighbor’s collaborative filtering recommendation algorithm [J]. Chinese Journal of Computers, 2010, 33(8): 1369-1377.
[5] Kaleli C. An entropy-based neighbor selection approach for collaborative filtering [J]. Knowledge-Based Systems, 2014, 56: 273-280.
[6] Wang Z, Yu X, Feng N, et al. An improved collaborative movie recommendation system using computational intelligence [J]. Journal of Visual Languages & Computing, 2014, 25(6): 667-675.
[7] Jang S, Yang J, Kim D K. Minimum MSE design for multiuser MIMO relay. IEEE
Communications Letters, 2010, 14(9): 812-814
[8] Xu R, Wang S, Zheng X, et al. Distributed collaborative filtering with singular ratings for large scale recommendation [J]. Journal of Systems and Software, 2014, 95: 231-241.
[9] Guo G, Zhang J, Yorke-Smith N. TrustSVD: Collaborative Filtering with Both the Explicit and
Implicit Influence of User Trust and of Item Ratings[C]//AAAI. 2015: 123-129.
[10] Luo X, Xia Y, Zhu Q, et al. Boosting the K-Nearest-Neighborhood based incremental collaborative filtering [J]. Knowledge-Based Systems, 2013, 53: 90-99.