2018 International Conference on Modeling, Simulation and Optimization (MSO 2018) ISBN: 978-1-60595-542-1
VISSIM Simulation Based Expressway Exit Control Modes
Yan-qun YANG
1, Ai-xiu HU
2, Sheng YU
1and Mei-feng CHEN
1,*1College of Civil Engineering, Fuzhou University; Fuzhou, Fujian 350108
2Jinshan College of Fujian agriculture and Forestry University; Fuzhou, Fujian 350108
*Corresponding author
Keywords: Expressway, Off-ramp, VISSIM, Traffic zoning map, Control mode.
Abstract. In order to investigate the urban expressway off-ramp control problems, the traffic simulation software VISSIM was adopted. According to the traffic characteristics of the expressway off-ramp, the parameters of traffic model were determined. Furthermore, dichotomy and control variables were used to obtain the thresholds as vehicles start queuing in off-ramp, and comprehensive zoning map was made based on the traffic flow on the side roads and the main road. By selecting delay of main and side road as accessing indices, traffic control modes of the Shoushan entrance and exit of South Second Ring Expressway in Fuzhou were built. On account of the different stages of the comprehensive zoning map, the following simulation experiments are conducted: (1) priority of vehicles on the main roads, (2) simulation of induction control of off-ramp, (3) simulation of present situation. The optimal control method was determined according to the simulation results.
Introduction
As the main body of urban road network and future developing orientation of urban rapid transit, urban expressway takes up a very important position in the urban road network system. Urban Expressway is an important way to solve urban traffic congestion problem. Therefore, it is of great significance for the effective operation of urban transport to ensure the efficient operation of expressway. Nevertheless, as the traffic demand surged, the geometry bottlenecks of road design or emergency incident influences leads to traffic congestion, and even "paralysis" in expressway mainline easily (Carlos F. Daganzo et al. 2002; Dr. Lazar et al. 2004). In Fuzhou, for example, the city's central urban functions are highly concentrated, which changes the function of second ring road from alleviating cross-border traffic to serving surrounding city development. In consequence, the capacity of the second ring road is insufficient, which leads to severe traffic jams in some parts. In many factors of causing the express congestion, queue spill back near the off-ramp is one of the most significant (Wang Li et al. 2014). Among the currently conducted studies, few studies have been done on the control modes of off-ramp in urban expressway. Therefore, exploring actual traffic characteristics on entrances and exits of urban expressway, concurrently learning from the control scheme of freeway exit ramp to ease urban expressway traffic congestions is significant to improve the level of service and capacity of urban expressway (ZONG T. 2007).
Congestion Zoning Theory
VISSIM simulation. The advantage of this theory is that taking into account the main road traffic and side road traffic, simultaneously. Besides, it can visually determine the congestion status on different traffic situation conditions. According to the different traffic stages, different control methods were used on urban expressway exits.
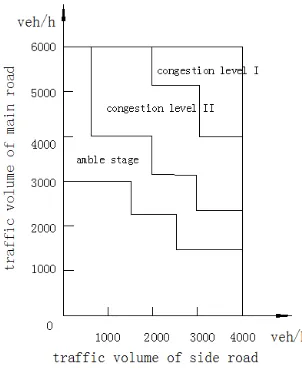
Figure 1. Synthesis sketches about the traffic volume of main roads and side roads.
VISSIM Simulation Experiment Objectives
1. To obtain the critical traffic of queue spill back near the off-ramp.
2. Through comparing delay of the off-ramp with delay of other lanes on expressway caused by side roads traffic, three “critical traffic of side road” were conceived. “Critical traffic 1”: when the side road traffic volumes does not reach it, the off-ramp traffic is not or little affected by side roads traffic; “critical traffic 2”: when traffic volumes of the side roads go over it, the off-ramp arise queuing phenomenon; “critical traffic 3”: when the side road traffic volumes go over it, effect of the side road traffic on main road traffic changes only slightly, or nearly constant.
3. Through studying the influence of traffic volume change in the main road on traffic running in the off-ramp and side road, three “critical traffic of main road” were conceived. “Critical traffic 1”: when the main road traffic volumes does not reach it, the off-ramp and side road traffic are not or little affected by side roads traffic; “critical traffic 2”: When traffic volumes of the main roads go over it, queuing phenomenon arises in the off-ramp; “critical traffic 3”: when traffic volumes in the main road go over it, effect of the main road traffic on main road traffic changes only slightly, or nearly constant.
4. According to threshold of the main and the side road, traffic congestion zoning map of off-ramp was obtained as shown in Figure 1
To achieve the above purposes, following simulation factors were chosen: the main road traffic, the side road traffic, and evaluation indices including delay of off-ramp, delay of side road and the total delay of system.
Calibration of Simulation Model
Considering the VISSIM software is imported from abroad, based on the difference between the features of urban roads in China and foreign countries, the simulation model was calibrated, and the follow parameters was selected, including road geometrical conditions, vehicle composition, the desired speed and the export environment.
The desired speed referred to the operating speed that is not bound by or based on the other vehicles under free flow condition. In VISSIM software, the speed of vehicles in different sections was controlled by the desired speed. With free traffic flow state of all kinds of cars, on the speed of
the cumulative distribution curve of the 85th percentile vehicle speed were as expected.
In domestic urban roadway, the interference of bicycle to motor vehicles is more frequently compared with foreign situations, especially for the motorway and non-motorized road without rigid segregation. Therefore, electric motors were used as the main confounding factors in the export environment.
Induction Control Settings
Based on the induction control theory, signals were installed on the off-ramp to cut off side road traffic, which ensured the off-ramp vehicles discharge first (Huang A-qiong, 2011). With signal control, both side road vehicles and off-ramp vehicles traveled downstream during green phase. However, side road vehicles waited for the green light at the stop sign while off-ramp vehicles traveled during the red phase (Liu Lan et al. 2011; Wang Xiu-ying. 2011).
There is an induction control model in the VISSIM simulator (Deng Zhi-he et al. 2014). Half-induction control method was chosen to set the detectors on the main and side road (Chen Jin-shan et al. 2013). The off-ramp speed, side road speed, and system response time were mainly considered when setting the detectors (seen as D1) in the off-ramp (Jing Tai et al. 2014; Shen Wei et al. 2014). Therefore, the setting mode of D1 was defined as Eq. 1:
1 0
2 2
1 t t v
v L L
. (1)
Where: L1——the distance from the detectors (D1) to off-ramp(m);
L2——the distance from the stop line of side road to off-ramp(m);
t0——system response time(s), that is the lag between receiving the induction signal and
the signal being on;
t——safety time interval(s);
v1——off-ramp speed(m/s);
v2——side road speed(m/s)
The queues detectors (seen as D2) were set at side road, 30~50 meters from off-ramp. Meanwhile, the side road detectors (named as D3 and D4) were set at the place where is 20~30 meters from side road stop line.
The minimum red of side road was set to cut off side road traffic in order to ensure the vehicles detected by detectors on the main road moving to side road first, and to improve efficiency of vehicles driving out the main road. The minimum red of side road was defined as Eq. 2:
1 1
min v
L
R . (2)
Where: L1——the distance from the detectors(D1) on the off-ramp to off-ramp(m);
v1——off-ramp speed(m/s);
Example Analysis
General Situation of the Shoushan Intersection
Figure 2. Geometric of the Shoushan exit of Fuzhou South Second Ring Expressway. Table 1. Geometric features of the Shoushan exit of Fuzhou South Second Ring Expressway.
Exit type Single off-ramp; Main and side roads connected with off-ramp to parallel type
Width of main road 1(right) 2(middle) 3(left)
3.5 m 3.5 m 3.5 m
Width of side road 1(right) 2(middle) 3( auxiliary Lanes)
3.5 m 3.5 m -
Length of deceleration
lane 145 m
Length of transition 60 m
Length of off-ramp 50 m
Traffic Current Condition of the Shoushan Intersection
According to the survey, we determined the peak of Shoushan exit was during 17: 00 to 18: 00. The traffic situation of Shoushan exit are shown in Figure 3. E-dog radar was used to collect the speed data, and the results are as shown in Table 2. Artificial counting method was used to investigate the traffic volume of intersection in peak hour, the results are shown in Table 3.
[image:4.612.87.530.428.515.2][image:4.612.96.521.552.726.2]
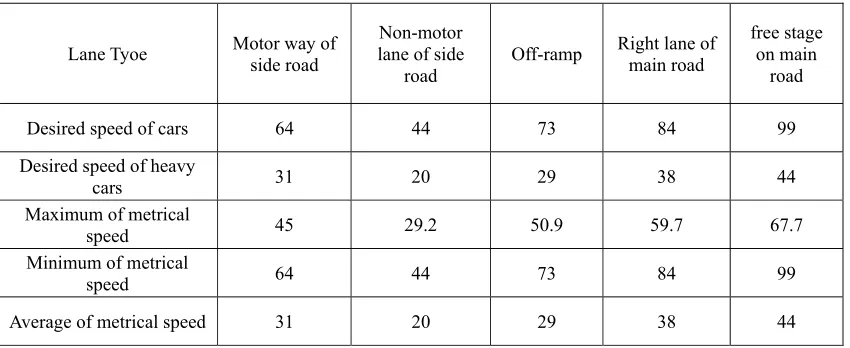
Figure 3. Traffic current condition of the Shoushan exit and side road. Table 2. Speed value of the Shoushan exit of South Second Ring Expressway(km/h).
Lane Tyoe Motor way of side road
Non-motor lane of side
road
Off-ramp Right lane of main road
free stage on main
road
Desired speed of cars 64 44 73 84 99
Desired speed of heavy
cars 31 20 29 38 44
Maximum of metrical
speed 45 29.2 50.9 59.7 67.7
Minimum of metrical
speed 64 44 73 84 99
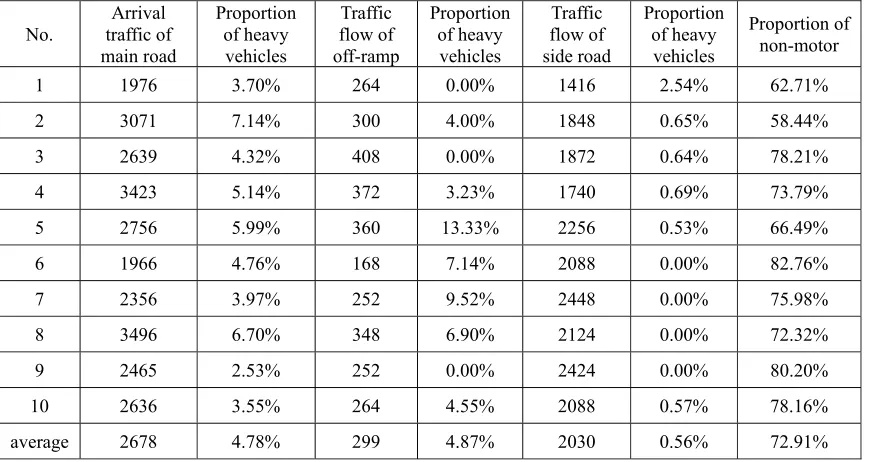
Table 3. Peak hourly volume of the Shoushan exit(veh/h).
No. traffic of Arrival main road
Proportion of heavy vehicles
Traffic flow of off-ramp
Proportion of heavy vehicles
Traffic flow of side road
Proportion of heavy vehicles
Proportion of non-motor
1 1976 3.70% 264 0.00% 1416 2.54% 62.71%
2 3071 7.14% 300 4.00% 1848 0.65% 58.44%
3 2639 4.32% 408 0.00% 1872 0.64% 78.21%
4 3423 5.14% 372 3.23% 1740 0.69% 73.79%
5 2756 5.99% 360 13.33% 2256 0.53% 66.49%
6 1966 4.76% 168 7.14% 2088 0.00% 82.76%
7 2356 3.97% 252 9.52% 2448 0.00% 75.98%
8 3496 6.70% 348 6.90% 2124 0.00% 72.32%
9 2465 2.53% 252 0.00% 2424 0.00% 80.20%
10 2636 3.55% 264 4.55% 2088 0.57% 78.16%
average 2678 4.78% 299 4.87% 2030 0.56% 72.91%
Simulation Process and Results
According to the geometric features of Shoushan exit (Table 1), the road network was established in VISSIM. The side road is dual carriageway in general, which has an additional lane at the exit. Thus, there are three lanes at the exit of side roads, with 3.5 meters lane width each and straight line in priority. There are three lanes in general section of main road, with additional lanes set up at the exit, and with 3.5 meters lane width each and straight line in priority. Vehicle composition is shown in Table 3: proportion of heavy vehicles in side roads was 0.56%; proportion of motorcycles in side roads was 72.91%; proportion of heavy vehicles in main road was 4.78%. Traffic volume of exit ramp: the reach traffic volume of the main road was 1: 6. Desired speed was calibrated according to Table 2.
[image:5.612.152.463.542.727.2]Effect of Main Road Traffic Volume on System Delay. Controlling traffic volume of side road unchanged, delay of off-ramp, main and side road was analyzed by changing traffic volume of main road. And then the simulation data was processed in the form of line chart. In the experiment design, the length of simulation time was set as 600 seconds, and the main road arrival traffic volume was set as 2000, 3000, 4000, 5000, 6000 veh/h, respectively. Analysis diagrams of delay are shown in Figure 4, Figure 5, Figure 6.
Figure 5. Analysis diagrams of delay when side road traffic was 2000(veh/h).
Figure 6. Analysis diagrams of delay when side road traffic was 3000(veh/h).
According to the above simulation results, effects of the main road traffic on delay of off-ramp, main and side road changed only slightly when traffic volume of side road was constant, as well as the main road traffic volume was less than 3000 veh/h. However, when the main road volume was over 3000 veh/h, delay of off-ramp, main and side road changed greatly. As can be seen from above chart, the main road traffic flow showed the most influence on delay of off-ramp, but it showed
little influence on delay of side road.
Figure 7. Analysis diagrams of delay when main road traffic was 2000(veh/h).
Figure 8. Analysis diagrams of delay when main road traffic was 3000(veh/h).
Figure 9. Analysis diagrams of delay when main road traffic was 4000(veh/h).
[image:7.612.144.466.345.659.2]influence on delay of off-ramp most, but it showed little influence on delay of main road, and the delay of side road was also increasing.
[image:8.612.227.378.359.543.2]The Thresholds Caused by Off-ramp Queue. Different traffic volumes of main and side road were chosen as the input, and mean downtime of off-ramp was selected as the output. Then the critical traffic volume was obtained by dichotomy using VISSIM (Table 4).
Table 4. The thresholds by means of dichotomy.
Traffic volume of main road(veh/h) Traffic volume of main road(veh/h) Mean downtime of off-ramp (s)
2000 1000 0
3000 1000 0
3000 2000 1.1
4000 2000 4.6
6000 3000 9
The results indicate that, it is the combinations of critical traffic volume as vehicles start parking on off-ramp with the main road traffic volume of 3000 veh/h and the side road traffic volume of 2000 veh/h. And according to Figure 4~Figure 6, critical traffic volume of the main road was 4000Veh/h when traffic volume of side road kept unchanged. According to the above critical value, traffic congestion zoning map of off-ramp was made as shown in Figure 10.
Figure 10. Traffic congestion zoning map of the side roads and the main road traffic flow.
On the basis of traffic congestion zoning map, the corresponding control method for different traffic situation was determined. During free-flow stage, non-control mode was used for off-ramp, while stage for amble and congestion level II, adaptive control was used. Traffic congestion zoning map partitioned the traffic situation of expressway exit, which provided control area for the use of expressway control mode.
Comparison Analysis of Three Control Modes
Induction Control Scheme of the Shoushan Intersection
According to the geometrical features of the Shoushan Intersection and traffic survey data, using
Eq. 1 and Eq. 2: the distance from the stop line of side road to off-ramp wasL2=5m; off-ramp speed
wasv1=50.9km/h =14.1m/s, and side road speed was v2=45km/h=12.5m/s; system response time
off-ramp was L1=80m; the speed of driving away off-ramp was v3=12.5m/s. The minimum red
(denoted by Rmin) of side road was 7s. And unit red time extension of side road (see asR0) can be
less than R min. R was set as 5s in this research.
The queues detectors (seen as D2) were set at side road, 50 meters from off-ramp. Meanwhile, the side road detectors (named as D3 and D4) were set at 25 meters from side road stop line.
Simulation Evaluation of Three Control Schemes
Average delay was used as the evaluation index of different control schemes on the Shoushan Intersection. Different control schemes were analyzed by means of with and without comparison.
On the basis of the simulation analysis, during the free flow stage, no control was applied due to the off-ramp traffic was not or little affected by side road traffic. Therefore, only the inductive control at off-ramp was simulated, while main road vehicles had priority over off-ramp and the current situation. Delay analyses were as following.
Simulation of congestion level I. Congestion level I was in the top right corner of comprehensive zoning map showing the side roads and the main road traffic flow. During the simulation experiments, the traffic volume of main road was set as 6000Veh/h and the traffic volume of side road was 4000Veh/h, so that three control modes could be easily compared. Simulation outputs included mean downtime of off-ramp, delay of main road, mean downtime of side road and total delay. Delay of the higher congestion stage was shown in Table 5.
Table 5. Delay of stage for higher congestion(unit: s).
Average delay Off-ramp Main road Side road System vehicles
Actuality 347.5 20.4 4.7 16.6
Main traffic priority
control 296.1 19.9 12.8 11.4
Inductive control 158.8 9.1 17.2 17.7
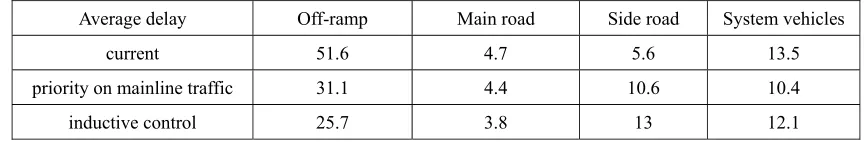
[image:9.612.88.522.549.620.2]Simulation of Amble Stage and Congestion Level II. As shown in comprehensive zoning map, the traffic volume of main road and side road fell in between the volume of free flow stage and congestion level I during stage for amble and congestion level II. During simulation, the traffic volume of main road was set as 5000Veh/h and the traffic volume of side road 3000Veh/h, so that three control modes could be easily compared. And simulation outputs included mean downtime of off-ramp, delay of main road, mean downtime of side road, total delay. Delays of both the amble and congestion level II stage were shown in Table 6.
Table 6. Delays of stage for amble and congestion level II(unit: s).
Average delay Off-ramp Main road Side road System vehicles
current 51.6 4.7 5.6 13.5
priority on mainline traffic 31.1 4.4 10.6 10.4
inductive control 25.7 3.8 13 12.1
Conclusions
In this research, dichotomy and control variables was used to obtain the thresholds as vehicles start queuing at off-ramp, and simulated in VISSIM, to obtain the critical traffic volume threshold of different control mode. Taking the traffic control mode of the Shoushan Intersection of South Second Ring Expressway in Fuzhou as the experiment site, the comprehensive traffic congestion zoning map was made. The simulation comparison analyses were conducted with different control modes on account of the different stages of the comprehensive zoning map. The simulation results showed that the optimal control methods could be: non-control mode for free flow stage ; induction control for during stage for amble and congestion level II; priority of main road vehicles or closing off-ramp for stage for higher congestion. This study provides a reference for expressway off-ramp control applications.
Acknowledgements
The research is supported by the project “Evaluation and optimization of highway traffic safety facilities”, supported by the Fuzhou Highway Bureau and the Department of Transportation of Fujian Province.
References
[1] Carlos F. Daganzo, Jorge Laval, Juan Carlos Mu~oz. Ten Strategies for Freeway Congestion Mitigation with Advanced Technologies [R. California PATH Research Report, UCB-ITS-PRR-2002-3, 2002.
[2] Dr. Lazar, N. Spasovic, Jakub P. Rowinski. Alternative Performance Measures for Evaluation Congestion [R], FHWA-NJ-2004-006, New Jersey Institute of Technology University Heights, 2004.
[3] Wang Li, Li Zhi-jun, Xiu Wei-jie, Liu Xiao-ming. Freeway Off-ramp and Downstream Intersection Signal Coordination Based on MLD Model and MPC Approach [J]. Control Engineering of China: 2014, 21(4): 487-490.
[4] Zong T. Modeling and implenmentation of an integrated ramp metering-diamong interchange control system [J]. Journal of Transportation Systems Engineering and Information Technology, 2007, 7(1): 61-72.
[5] Wang Wei, Guo Xiu-cheng. Traffic Engineering[M]. Jiangsu: Southeast University Press. 2011. [6] Zhao Li-hong. Real-time traffic evaluation method using the Neuro-Fuzzy Consequence [D]. Guangdong: Guangdong University of Technology. 2009.
[7] Huang A-qiong. Traffic Flow Analysis and Control Methods for Urban Freeway Main Lane & Auxiliary Lane [D]. Beijing: Beijing Jiaotong University. 2011.
[8] Liu Lan, Sun Jian, Li Ke-ping. On-ramp Speed Control of Urban Expressway [J]. Journal of Transport Information and Safety, 2011, 29(3): 15-18.
[9] Wang Xiu-ying. Control methods research of off-ramp on expressway [D]. Beijing: North China University of Technology. 2011.
[10] Deng Zhi-he, Li De-hui, Lin Ke. Research on the Signal Progression on Zhuhai Meihuaxi Road[J]. Road Traffic & Safety, 2014, 14(3): 52-59.
[12] Jing Tai, Lv Bin, Hao Bin-bin. Actuated Intersection Signal Control Using Probability Model [J]. Journal of Transport Information and Safety: 2014, 32(1): 16-20.