© 2017, IRJET | Impact Factor value: 5.181 | ISO 9001:2008 Certified Journal
| Page 3411
Optimization of surface roughness of mild steel (EN-8) using Taguchi
and ANOVA
Sagar B Nandani
1, R V Kulkarni
21
M. Tech Student, Dept. of Mechanical Engineering, KLS GIT College, Belagavi, Karnataka, India
2Professor, Dept. of Mechanical Engineering, KLS GIT College, Belagavi, Karnataka, India
---***---Abstract -
For many years considerable research work hasbeen carried out in industrial and academic perspective to monitor the CNC machines. Still works are going on to improve its accuracy and make it precise and flexible. Every manufacturing industry is working towards improving the surface finish of their product. As surface finish of the product improves, the cost of the product goes on increasing. Many research has been carried out in this field and is well documented. In this project, work has been carried out to find the optimum conditions for surface roughness using suitable methods like Taguchi and ANOVA (Analysis of Variance) for Mild Steel (EN-8 grade) material. The experiment is conducted in an industry ‘Galaxy Machinery Pvt. Ltd.’ on MIDAS 10 CNC turning machine. The machining parameters like Cutting speed, feed and depth of cut are optimized by measuring the Surface Roughness of the material. The surface roughness of materials is checked using a device called Surtronic S128 which is Taylor Hobson AMETEK make. The results showed that for Mild steel material feed is the significant parameter influencing the surface roughness.
Key Words: cutting speed, feed, depth of cut, Surface roughness, taguchi, ANOVA.
1.
INTRODUCTION
CNC machines have high accuracy and takes less time to complete tasks assigned to it, but during machining the CNC machine experiences many problems like force generated at the tool tip increases the surface roughness and also reduces tool life, vibrations produced during machining, acoustic emission, thermal problem etc. which affects the performance of the machine. So it is necessary to monitor these problems during machining which helps to increase the performance and accuracy of the machine. Surface roughness is nothing but the deviation of the surface from the flat ideal surface. Friction depends on the surface texture. Considerable study has been carried out to find the effect of surface texture on friction and wear during sliding conditions. There are many processes to modify the initial texture like grinding, honing, lapping, abrasive blasting, electrical discharge machining, laser etching etc. The surface with high roughness usually wear faster and have higher friction as compared to smooth surface. So to control the surface roughness is one of the main objective of every manufacturing company.
Many Researches were carried out in the field of CNC machines. M Sadilek et.al. [1] Investigated the problems with increase in the efficiency of turning centers. They proposed roughing turning cycles by applying variable depth of cut. They found that by utilizing this technique increases durability of cutting tool and efficiency during turning. They worked on two strategies, first is carrying machining process with roughing cycle having constant depth of cut and second with roughing cycle having variable depth of cut. They found that the cutting force generated during constant depth of cut is more compared to force generated during variable depth of cut. By using variable depth of cut strategy, increases tool life, reduces energy load of the machine and reduces cutting force almost by 10%. Anil Gupta et.al. [2] used hybrid taguchi fuzzy approach to optimize the CNC turning conditions of material AISI P-20 tool steel. They monitored performance characteristics of CNC turning machine like surface roughness, cutting force and power consumption. They used full factorial design to find the optimum point of cutting parameters by using minimum number of trials. The experimental design used orthogonal arrays L27 for the
cutting parameters such as cutting speed, depth of cut, feed rate, nose radius and environment with levels 1, 2, 3. As there are three types of the performance characteristics for the analysis of signal to noise ratio like lower the better, nominal better and higher the better out of which they used lower the better because of the reason that effect of performance characteristics has to be reduced. Then they used ANOVA (Analysis of Variance) to find the most effective
parameter which influencing the performance
© 2017, IRJET | Impact Factor value: 5.181 | ISO 9001:2008 Certified Journal
| Page 3412
is the significant parameter for affecting the volume of metal removed.
In the present work, the experiment is conducted on MIDAS 10 turning center with coated CVD Ti(C,N)+Al203+TiN insert for the machining of mild steel (EN-8 grade). L9 orthogonal
array is used to find the optimum cutting parameters using taguchi and ANOVA. The cutting parameters used are cutting speed, feed and depth of cut.
2.
EXPERIMENTAL DETAILS
[image:2.595.348.518.131.420.2]The experiment is conducted on MIDAS 10 turning machine for mild steel (EN-8) bar, which is 50mm length and 44mm diameter. The Chemical and Mechanical properties of mild steel material is shown below.
Table -1: Mechanical properties of mild steel (EN-8)
Material Density stress Yield Hardness (Hot rolled) Tensile stress Young’s modulus Mild steel
[image:2.595.41.282.414.464.2](EN-8) kg/cm7850 3 280 MPa 240 BHN 660 MPa 200 GPa
Table -2: Chemical Properties of mild steel (EN-8)
Material Composition in Wt %
C Si Mn S P
Mild steel
(EN-8) 0.41 0.204 0.70 0.02 0.026
Inserts WNMG080408 PM 4325 Sandvik make is used to machine mild steel coated with CVD Ti(C,N)+Al203+TiN having nose radius 0.794mm. The cutting parameters used to conduct experiment is given in Table 3.
Table -3: Cutting parameters and levels
Cutting
Parameter Notation Units
Level of factor
1 2 3
Cutting Speed v m/min 150 200 250
Feed f mm/rev 0.12 0.15 0.18
Depth of cut d mm 0.5 0.75 1
Based on L9 orthogonal array, 9 experiments were
conducted. The experimented is conducted on MIDAS 10 CNC turning machine by keeping chuck pressure 25kg/cm2,
coolant pressure 5bar and cutting length 25mm during machining. Surface roughness is measured for effective length 2.5 mm using a device called Surtronic S128 which is Taylor Hobson AMETEK make. The surface roughness factors measured are arithmetic mean (Ra), root mean square (Rq) and mean roughness depth (Rz).
The experimental setup to measure surface roughness Ra, Rq and Rz factor.
(a)
(b)
(c)
(d)
Fig -1: (a) (b) (c) (d) setup to measure the surface roughness
The experimental results for mild steel is shown in table 4.
Table -4: Experimental results and S/N ratios for Mild steel
R u n N o
Parameter Level Surface Roughness S/N Ratio V (m/ min) f (mm /rev) d (m m) Ra
(µm) (µm) Rq (µm) Rz (dB) Ra (dB) Rq (dB) Rz
1 1 1 1 0.997 1.267 6.933 0.02610 2.0555 -3
-16.81
84
2 1 2 2 0.997 1.266 6.533 0.02610 2.0486 -7
-16.30
23
3 1 3 3 1.387 1.667 7.400 2.841 -53 -4.4387 1 -17.38 46
4 2 1 2 0.733 1.400 4.500 2.69792 2.9225 -6
-13.06
43
5 2 2 3 1.110 1.367 6.533 0.906 -46 -2.7153 7 -16.30 23
6 2 3 1 1.427 1.667 7.700 3.088 -48 -4.4387 1 -17.72 98
7 3 1 3 0.747 0.933 4.867 2.53359 0.60237 13.74 -52
8 3 2 1 1.293 1.666 8.233 -2.231 97 -4.4335 0 -18.31 12
[image:2.595.302.565.516.789.2] [image:2.595.41.284.560.637.2]© 2017, IRJET | Impact Factor value: 5.181 | ISO 9001:2008 Certified Journal
| Page 3413
The S/N ratios for Ra, Rq and Rz is calculated using software MINITAB 17 software and is also calculated by using equation (1).
3.
ANALYSIS OF RESULTS
In Taguchi for three level of factors and three cutting parameters, L9 orthogonal arrays is used. The objective
function in taguchi is S/N ratio where ‘S’ represents signal and ‘N’ represents noise. There are three characteristics of S/N ratio i.e. smaller the better, nominal the better and higher the better. To monitor the cutting force, surface roughness, tool wear etc. we have to use smaller the better S/N ratio.
--- (1)
Where,
y = Mean square deviation for output characteristics
n = Number of observations
Average S/N ratios of level of experiments are calculated for Ra, Rq and Rz factor based on the experimental values using MINITAB 17 software. Total mean S/N ratios for Ra, Rq and Rz factor of mild steel is shown table 5, 6, 7 respectively.
Table -5: Response Table of Signal to Noise Ratio for ‘Ra’ factor of mild steel
Level Cutting Speed (v) m/mm mm/rev Feed (f) Depth of Cut (d) mm
1 -0.9298 1.7525 -1.7648
2 -0.4323 -1.0374 -0.1477
3 -0.9552 -3.0324 -0.4048
Delta 0.5229 4.7850 1.6170
Rank 3 1 2
Table -6: Response Table of Signal to Noise Ratio for ‘Rq’ factor of mild steel
Level Cutting Speed (v) m/min Feed (f) mm/rev Depth of Cut (d) mm
1 -2.848 -1.459 -3.643
2 -3.359 -3.066 -3.249
3 -2.869 -4.551 -2.184
Delta 0.511 3.093 1.459
Rank 3 1 2
Table -7: Response Table of Signal to Noise Ratio for ‘Rz’ factor of mild steel
Level Cutting Speed (v) m/min mm/rev Feed (f) Depth of Cut (d) mm
1 -16.84 -14.54 -17.62
2 -15.70 -16.97 -15.61
3 -16.51 -17.53 -15.81
Delta 1.14 2.98 2.01
Rank 3 1 2
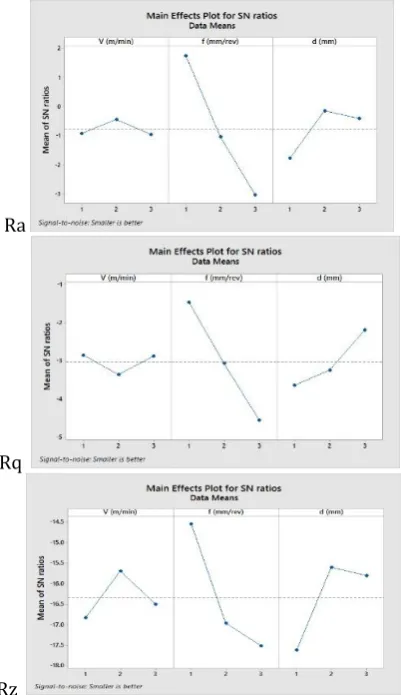
Difference between maximum and minimum S/N ratios is calculated and rank is allotted for each cutting parameter. According to the rank in response table 5, 6, 7 it is found that feed is the significant parameter and next is depth of cut. Optimum cutting parameters is found out by plotting graph for Table 5, 6, 7 as shown below.
Ra
Rq
[image:3.595.334.535.328.676.2]Rz
Fig -2: Mean of S/N ratio v/s cutting parameters for Ra, Rq and Rz factor of mild steel
© 2017, IRJET | Impact Factor value: 5.181 | ISO 9001:2008 Certified Journal
| Page 3414
feed 0.12 mm/rev and depth of cut 1 mm (1 1 3 orthogonal array).
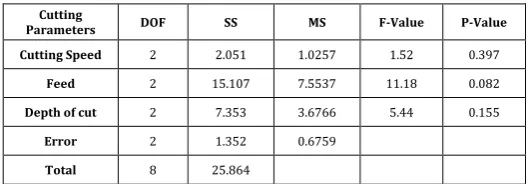
[image:4.595.29.295.589.681.2]ANOVA is used to find the significant cutting parameter which is affecting the performance characteristics. In this project ANOVA is solved for Ra, Rq and Rz factors of mild steel material considered for experimentation. The analysis was carried out with confidence level 95%. With the help of ANOVA, interpretation of S/N ratio and cutting parameters is calculated using MINITAB 17 software. From the table below DOF represents degree of freedom, SS–sum of squares, MS– mean squares, F value–variance ratio and P value–significant factor.
Table -8: Interpretation of S/N ratio and cutting parameters for Ra factor of mild steel
Table -9: Interpretation of S/N ratio and cutting parameters for Rq factor of mild steel
Cutting
Parameters DOF SS MS F-Value P-Value
Cutting Speed 2 0.5018 0.2509 0.08 0.922
Feed 2 14.3533 7.1767 2.42 0.292
Depth of cut 2 3.4172 1.7086 0.58 0.634
Error 2 5.9319 2.9660
Total 8 24.2042
Table -10: Interpretation of S/N ratio and cutting parameters for Rz factor of mild steel
Cutting
Parameters DOF SS MS F-Value P-Value
Cutting Speed 2 2.051 1.0257 1.52 0.397
Feed 2 15.107 7.5537 11.18 0.082
Depth of cut 2 7.353 3.6766 5.44 0.155
Error 2 1.352 0.6759
Total 8 25.864
From the Table 8 and 9 for Ra, Rq and Rz factor the significant parameter is feed, depth of cut and then cutting speed. So as feed increases the surface roughness also increases.
4.
CONCLUSIONS
Taguchi design is used to find the optimum cutting parameters for CNC turning center. Experimental results were analyzed by using ANOVA. L9 orthogonal array is used to solve the three levels of cutting speed, feed and depth of cut. In taguchi the first step is to find the S/N ratios for each experimental values. The second step is to find the optimum cutting parameters from calculated level values. Then ANOVA is used to find the significant factor which affects the surface roughness. After the study following conclusions are made:
1. The optimum cutting parameters for Ra and Rz factor of mild steel (EN-8) is cutting speed 200 m/min, feed 0.12 mm/rev and depth of cut 0.75 mm and for Rq factor cutting speed 150 m/min, feed 0.12 mm/rev and depth of cut 0.5 mm.
2. The results obtained from ANOVA showed that feed is the significant parameter for Ra, Rq and Rz factor of mild steel (EN- 8).
The number of experiments were reduced in taguchi to find the optimum cutting conditions and satisfactory results were obtained which can be used for further industrial studies.
REFERENCES
[1] M Sadilek et.al. “Cutting Force during Turning during variable depth of cut”, VSB-Technical University of
Ostrava, Faculty of Mechanical Engineering,
Perspectives in science (2016) 7, 357-563.
[2] Jonathan Downey et.al. “Real time monitoring of the CNC process in a production environment- the data collection & analysis phase”, Procedia CIRP 41 (2016) 920 – 926. [3] Anil Gupta et.al. “Taguchi fuzzy multi output optimization (MOO) in high speed turning of AISI P-20 tool steel”, Mechanical and Automation engineering department, Maharaja Agrasen Institute of Technology, Expert Systems with Application 38 (2011) 6822-6828. [4] Guicai Zhang et.al. “Modeling Flank Wear Progression Based on Cutting Force and Energy Prediction in Turning Process”, United Technologies Research Center (China), Shanghai, China, Procedia Manufacturing Volume 5, 2016, Pages 536–545.
[5] Suleyman Yaldiz et.al. “A dynamometer design for measurement the cutting forces on turning”, Measurement 39 (2006) 80-89.
[6] K. Venkata Rao et.al. “Cutting tool condition monitoring by analyzing surface roughness, workpiece vibration and volume of metal removed for AISI 1040 steel in boring”, Measurement 46 (2013) 4075-4084.
[7] Amarjit P. Kene et.al. “Experimental Investigation of Tool Wear Behavior of Multi-Layered Coated Carbide Inserts Using Various Sensors in Hard Turning Process”, IFAC-PapersOnLine 49-12 (2016) 180–184.
Cutting
Parameters DOF SS MS F-Value P-Value
Cutting Speed 2 0.5215 0.2607 0.25 0.798
Feed 2 34.6597 17.3299 16.78 0.056
Depth of cut 2 4.5305 2.2652 2.19 0.313
Error 2 2.0654 1.0327
© 2017, IRJET | Impact Factor value: 5.181 | ISO 9001:2008 Certified Journal
| Page 3415
[8] Sara Karam et.al. “Online prediction of cutting tool life in turning via cognitive decision making”, Procedia CIRP 41 (2016) 927–932.
[9] Ching-Feng Chang et.al. “Vibration monitoring of motorized spindle using spectral analysis technique”, Mechatronics 19 (2009) 726-734.