© 2017, IRJET | Impact Factor value: 6.171 | ISO 9001:2008 Certified Journal | Page 917
Development of Controlled Low Strength Material (CLSM) by utilising
Fly ash, M-Sand, Effluent Treatment Plant Sludge, and Cement.
Mithun Sagar P
1, Skanda Kumar B.N
2, Manjunatha S
3, Guruswamy J
41PG Student, Department of Civil Engineering, SKSJTI, K.R. Circle, Bengaluru-560001, Karnataka, India. 2Assistant Professor, Centre for Incubation Innovation Research and Consultancy (CIIRC)
Jyothy Institute of Technology, Bengaluru-560082.
3Assistant Professor, Department of Civil Engineering,SKSJTI, K.R. Circle, Bengaluru-560001, Karnataka, India. 4Research Scholar, Department of Civil Engineering, Jain University, Bengaluru-560069, Karnataka, India.
---***---Abstract:The study involves the development of controlled low strength material (CLSM) by utilising fly ash, M-Sand, effluent treatment plant sludge, cement. Various tests were conducted to test the properties of the materials used in the development of CLSM. The tests for M-Sand includes Specific gravity and Fineness, the tests for Cement were Specific gravity, Consistency, setting time, and Fineness, the tests for Fly ash were Specific gravity and Sieve testing. The test for CLSM has test for Fresh property i.e. Flow table test and test for hardened property is unconfined Compression strength of CLSM at 7 days and 28 days. The CLSM moulds were prepared by varying the proportion of cement, M-Sand, fly ash, Sludge and water. This paper narrates the utilisation of CLSM with an importance on the use of waste materials like industrial sludge, fly ash for infrastructure development.
KEY-WORDS:Controlled Low Strength Material (CLSM), fly ash, M-Sand, effluent treatment plant sludge, cement, Specific gravity, Consistency, setting time, Fineness, Sieve testing, Flow table test, unconfined compression strength.
1.INTRODUCTION
Controlled low-strength material (CLSM) is a self-compressed, adhesive substance which is utilized principally as a refill in substitution to compacted fill. Various words are presently used to describe this substance, including flowable fill, unshrinkable fill, controlled density fill, flowable mortar, fly ash slurry, soil cement slurry, and various different names. This research work consists of information regarding implementation, qualities of the substance, blend ratios, manufacturing, and standard maintaining systems. The inspiration for this investigation is to give some fundamental and essential data on CLSM development, with accentuation on CLSM substance qualities and its performance over regular compacted fill.
Controlled low-strength materials are characterized by American Concrete Institute (ACI) 116R as substances which shows a compaction value of 8.3 MPa or lesser.
This lesser quality prerequisite is important to take into consideration of future removal of CLSM and the substance is flowable, permitting ideal covering of any void.
2. OBJECTIVE OF THIS PAPER
The major intent of this experiment was carried with the intention of utilising Common Effluent Treatment Plant sludge (CETP sludge) in the development of Controlled Low Strength Material. Controlled Low Strength Material is a self-levelling and self-compressing blend with the compaction quality of less than 8.3MPa. The industrial by product sludge which otherwise is discarded as landfill is tested to match the accessibility of its implementation as in the development of CLSM and to examine the resulting properties.
1. To characterize each material utilised in the CLSM blends by conducting suitable experiments as per the guidelines of Bureau of Indian Standards (BIS).
2. To find out the qualities of CETP sludge by conducting physical and chemical analysis.
3. To proportion the CLSM blending as per ACI 229R-99 standards.
4. To replace cement in CLSM by industrial by product i.e. CETP sludge by 5 %, 10%, 15%.
5. To find out the properties of fresh qualities of CLSM. 6. To find out the different qualities, and properties of the hardened CLSM mixtures and compare the results.
3. MATERIALS USED AND TESTS CONDUCTED
In the current chapter, the work is focused on determining and evaluating different parameters and qualities of the components and their mixture as per the specified standards. CLSM mixtures utilised in the current experimental work consisted of different quantity of fly ash, CETP sludge, Ordinary Portland cement, fine aggregates(M-Sand) and water.
3.1 Fine Aggregates:
© 2017, IRJET | Impact Factor value: 6.171 | ISO 9001:2008 Certified Journal | Page 918
sieve analysis were carried on and completed according to IS:2386-1963 and the requirements as per IS 383-1970 is satisfied and is as showed in the table 3.1.
Table 3.1 Properties of Fine aggregates (M-Sand)
3.2 Cement:
Cement provides the cohesion and quality for various CLSM batches. For most applications, cement is normally used. Various sorts of concrete, including mixed blends, can be utilised if earlier testing shows satisfactory outcomes. The Portland cement content for excavatable CLSM is normally
used in the extent of 30 to 120 kg/m3 as per ACI229R-99.
[image:2.595.39.281.416.743.2]In the current experiment, Cement of 43 grade is utilized affirming to IS: 8112- 1989. The physical qualities of bond are acquired by directing suitable experiments as per IS 269:4831 and requirements as per IS 8112:1989 are as indicated in the table 3.2.
Table 3.2 Qualities of Cement
Figure 3.1, 3.2 Vicat apparatus and conducting test on Consistency, Setting time of Cement
3.3 Fly ash:
CLSM is regularly proportioned with fly ash or slag to
enhance workability and pumpability, and reduce
segregation, bleeding, shrinkage, or settlement. Coal
combustion flyash is utilised to improve flowability. High fly
ash components blend following in bring down density of CLSM when contrasted with blends and large aggregate quantity. Trial blends are done to decide if the blend meet the predetermined prerequisites. Class F fly ash components
are regularly utilised in the extent of 60 to 1200 kg/m3.
Table 3.3 Properties of Fly ash
3.4 Common effluent treatment plant sludge:
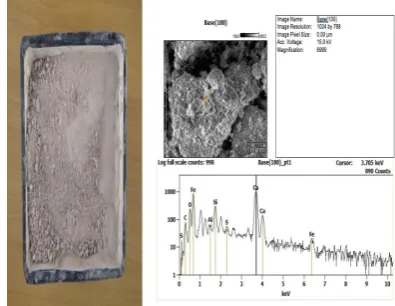
[image:2.595.328.526.495.648.2]Nonstandard materials are utilised in CLSM mixtures, depending upon project requirements after testing their acceptability in CLSM mixtures. Examples of nonstandard materials that are substituted for any of the constituent for CLSM incorporates various coal ignition items, disposed foundry sand, glass cullet, and recovered crushed cement. In the current experiment, Common Effluent Treatment Plant (CETP) sludge used is a non-standard material. It was acquired from an effluent treatment plant source in Bengaluru. The specific gravity for CLSM obtained is 1.95.
Figure 3.3, 3.4 Industrial Sludge and results of SEM test on CETP Sludge
4. MOULDS PREPARATION
4.1 Mix Proportioning:
Mix proportioning is a progression of choosing suitable constituents and finding their proportions which would create a blend that satisfy the job requirements. The mixing
Serial No Properties Results
1 Specific gravity 2.80
2 Fineness 4.44
Sl No
Properties Results
obtained
Requirements as per IS: 8112- 1989.
1 Fineness 3.5% Not more than 10%
2 Normal
consistency
30 27 to 33
3 Initial
setting time
160(in minutes)
Not lower than 30
4 Final setting
time
220(in minutes)
Not more than 600
5 Specific
gravity
3.4
-S. NO Properties Results obtained
1 Specific gravity 2.1
2 Percentage retained on 45 μm
Sieve
22.5%
3 Percentage retained on 90 μm
Sieve
© 2017, IRJET | Impact Factor value: 6.171 | ISO 9001:2008 Certified Journal | Page 919
of the materials of concrete is a significant section of concrete technology as it protects standard and money saving. Since self-compaction is largely impacted by the description of components and the blend ratios, it becomes requisite to discover a method for blending of CLSM. ACI 229R-99 have proposed a mix proportioning system based on trial and error until blended with appropriate qualities are attained.
4.2 Mixing:
The mix formulation added in the experiment is shown in the tables below (Table 4.1 to Table 4.5). The formulation of the CLSM compound were prepared for OPC constituents
varying from 30 to 120 kg/m3 with an increase in 20 kg/m3
of cement content. Fly ash compound is kept as invariable at
500 kg/m3. Water content is used fixed for every blend at
500 kg/m3. Cement was partially replaced by CETP sludge (5
%,10 %and 15%).
4.3 Mix Proportioning
A B C D E
Mix number
A1 A2 A3 A4
B1 B2 B3 B4
C1 C2 C3 C4
D1 D2 D3D4
E1 E2 E3 E4 Sludge
(%)
0 5 10 15
0 5 10 15
0 5 10 15
0 5 10 15
0 5 10 15 Cement 30
kg/m3 50 kg/m3 70 kg/m3 90 kg/m3 120 kg/m3
SERIES A: Cement = 30 kg/m3, Fly ash = 500 kg/m3 and
Partial replacement of cement.
In the tables below the following abbreviations are used.
Se No – series number, Sl – sludge,
[image:3.595.336.553.79.221.2]OPC – cement, H20 – water.
Table 4.1 Mix design of series A
SERIES B:Cement = 50 kg/m3, Fly ash = 500 kg/m3 and Partial replacement of cement.
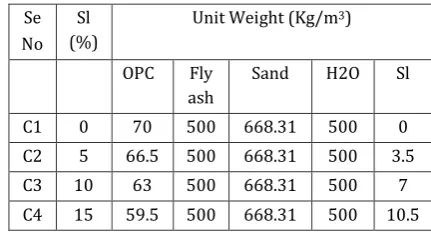
Table 4.3 Mix design of series C
SERIES D: Cement= 90 kg/m3, Fly ash = 500 kg/m3 and
[image:3.595.334.550.288.405.2]Partial replacement of cement.
Table 4.4 Mix design of series D
SERIES E: Cement = 120 kg/m3, Fly ash = 500 kg/m3 and
Partial replacement of cement.
Table 4.5 Mix design of series E Se
No Sl (%)
Unit Weight (Kg/m3)
OPC Fly
ash
Sand H20 Sl
A1 0 30 500 700.44 500 0
A2 5 28.5 500 700.44 500 1.5
A3 10 27 500 700.44 500 3
A4 15 25.5 500 700.44 500 4.5
Se No
Sl (%)
Unit Weight (Kg/m3)
OPC Fly
ash
Sand H20 Sl
B1 0 50 500 684.88 500 0
B2 5 47.5 500 684.88 500 2.5
B3 10 45 500 684.88 500 5
B4 15 42.5 500 684.88 500 7.5
Se No
Sl (%)
Unit Weight (Kg/m3)
OPC Fly
ash
Sand H2O Sl
C1 0 70 500 668.31 500 0
C2 5 66.5 500 668.31 500 3.5
C3 10 63 500 668.31 500 7
C4 15 59.5 500 668.31 500 10.5
Se No
Sl (%)
Unit Weight (Kg/m3)
OPC Fly
ash
Sand H20 Sl
D1 0 90 500 659.86 500 0
D2 5 85.5 500 659.86 500 4.5
D3 10 81 500 659.86 500 9
D4 15 76.5 500 659.86 500 13.5
Se No
Sl (%)
Unit Weight (Kg/m3)
OPC Fly ash Sand H20 Sl
E1 0 120 500 632.06 500 0
E2 5 114 500 632.06 500 6
E3 10 108 500 632.06 500 12
E4 15 102 500 632.06 500 18
Table 4.2 Mix design of series B
SERIES C: Cement = 70 kg/m3, Fly ash = 500 kg/m3 and
[image:3.595.40.282.334.441.2]© 2017, IRJET | Impact Factor value: 6.171 | ISO 9001:2008 Certified Journal | Page 920
5. RESULTS AND DISCUSSIONS
5.1 General
This chapter consists of results and discussions on fresh properties and hardened qualities of CLSM. Fresh properties include workability and density. Hardened properties include the level of compaction achieved at 7 days and 28 days by the various blends of CLSM. The results were tested for their conformance with the needed standards and study of the results have been made.
5.2 FRESH PROPERTIES
5.2.1 Flowability
[image:4.595.309.567.68.250.2]
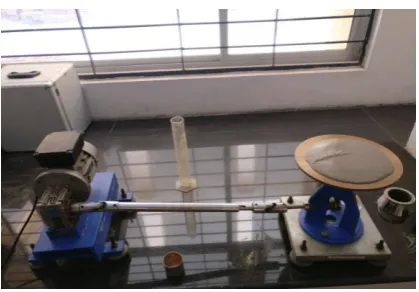
It is the quality that differentiates CLSM with another fill substance. It allows the substance to be self-levelling, and enter into the voids and gets self-compacted without the need of compaction machines. This quality shows a high benefit of CLSM in comparison with traditional fill substance which needs to be compacted by using conventional equipment. The Flowability is done by using Flow Table Test of IS (1199-1959). The apparatus used for Flow table test were of standard IS (5512-1983).
[image:4.595.57.267.384.530.2]Figure 5.1 Conducting Flow table test
Table 5.1 Flow table test values for different mixes (in cms)
Figure 5.2 Flowability of different blends
Flowability was tested and flow of the mixes in this experimental work have achieved values equal to 17 cm or more as given in the table 5.1. This indicates the proportioned CLSM blends have a good flowability. Comparing the flowability of different mixes, it is seen that flowability reduces with the increment of squander, and cement contents as indicated in the Figure 5.1.
5.3 Unconfined Compression Test values for different mix series
[image:4.595.329.537.413.566.2]Figure 5.3 Hand mixing of CLSM
[image:4.595.64.257.600.755.2]© 2017, IRJET | Impact Factor value: 6.171 | ISO 9001:2008 Certified Journal | Page 921
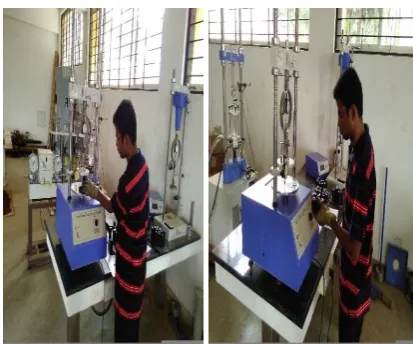
Figure 5.6, 5.7 Conducting Unconfined Compression Test
SERIES A: Cement = 30 kg/m3, Fly-ash = 500 kg/m3, Partial
[image:5.595.324.568.96.176.2]replacement of cement
Table 5.2 Test results for Series A
DISCUSSION: It is observed that for a cement quantity of
30kg/m3, with the decrease of Cement content and increase
in sludge proportions the Compressive Strength has been decreased. It is seen that there is about 37.03% and 39.21% decrease in Compressive Strength at 15% of Sludge at 7 days and 28 days respectively.
SERIES B: Cement = 50 kg/m3, Fly-ash = 500 kg/m3, Partial
replacement of cement
Table 5.3 Test results for Series B
DISCUSSION: It is observed that for a cement quantity of
70 kg/m3, with the decrease of Cement content and increase
in sludge proportions the Compressive Strength has been decreased. It is seen that there is about 25.50% and 26.84% decrease in Compressive Strength at 15% of Sludge at 7 days and 28 days respectively.
SERIES C: Cement = 70 kg/m3, Fly-ash = 500 kg/m3, Partial
replacement of cement.
Table 5.4 Test results for Series C
DISCUSSION: It is observed that for a cement quantity of
70 kg/m3, with the decrease of Cement content and increase
in sludge proportions the Compressive Strength has been decreased. It is seen that there is about 25.50% and 26.84% decrease in Compressive Strength at 15% of Sludge at 7 days and 28 days respectively.
SERIES D:Cement = 90 kg/m3, Fly-ash = 500 kg/m3, Partial
[image:5.595.326.567.331.409.2]replacement of cement
Table 5.5 Test results for Series D
Table 5.6 Test results for Series E
DISCUSSION: It is observed that for a cement quantity of
120 kg/m3, with the decrease of Cement content and
increase in sludge proportions the Compressive Strength has been decreased. It is seen that there is about 4.44% and 2.164% decrease in Compressive Strength at 15% of Sludge at 7 days and 28 days respectively.
Series
No Compressive Strength at 7 Days (N/mm2)
Compressive Strength
at 28 Days (N/mm2)
C1 1.38 2.98
C2 1.250 2.784
C3 1.139 2.55
C4 1.028 2.180
Series
No Compressive Strength at 7 Days (N/mm2)
Compressive Strength
at 28 Days (N/mm2)
C1 1.38 2.98
C2 1.250 2.784
C3 1.139 2.55
C4 1.028 2.180
Series
No Compressive Strength at 7 Days (N/mm2)
Compressive Strength
at 28 Days (N/mm2)
B1 0.979 1.77
B2 0.870 1.60
B3 0.803 1.45
B4 0.713 1.306
Series
No Compressive Strength at 7 Days (N/mm2)
Compressive Strength
at 28 Days (N/mm2)
Series
No Compressive Strength at 7 Days (N/mm2)
Compressive Strength
at 28 Days (N/mm2)
E1 2.16 4.62
E2 2.12 5.055
E3 2.10 4.78
E4 2.064 4.52
DISCUSSION: It is observed that for a cement quantity of
90 kg/m3, with the decrease of Cement content and increase
in sludge proportions the Compressive Strength has been decreased. It is seen that there is about 13.00% and 20.43% decrease in Compressive Strength at 15% of Sludge at 7 days and 28 days respectively.
SERIES E: Cement = 120 kg/m3, Fly-ash = 500 kg/m3,
Partial replacement of cement
D1 1.77 4.11
D2 1.70 3.98
D3 1.58 3.54
[image:5.595.43.279.337.417.2]© 2017, IRJET | Impact Factor value: 6.171 | ISO 9001:2008 Certified Journal | Page 922
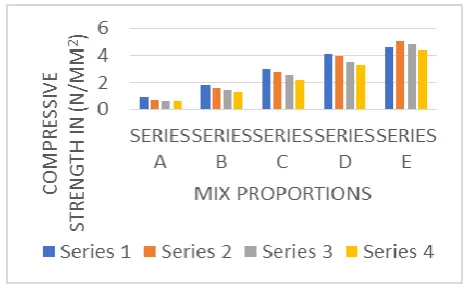
[image:6.595.42.279.81.239.2]5.4 Comparing A, B, C, D and E mixes:
Figure 5.8 Comparing compressive strengths of different blends for 7 Days
Figure 5.9 Comparing compressive strengths of different blends for 28 Days
6. CONCLUSION
The preliminary intention of this experiment was to develop a CLSM blend with industrial by-product utilization and satisfying workability and performance requirements. Results of this experimental study showed that CLSM comprises of high contents of industrial squander by-products, cement, Fly-ash and Common Effluent Treatment Plant sludge, which could be utilised as structural fill.
7. REFERENCES
1)ACI 229R-99, Code specifications for CLSM.
2) Suresh Kumar, Dinesh Kumar and Nancy Mittal [National
Council for Cement and Building Material].“Use of Fly ash in
making Controlled Low Strength Material (CLSM) for use as self-compacted structure backfill’’.
3) Shojaeddin Jamali and Sivakumar Naganathan [Jordan Journal of Civil Engineering, Volume 9, No. 1, 2015] “Performance assessment of cement less Controlled Low-Strength Material (CLSM) utilizing coal ashes’’.
4) David Trejo, Kevin J. Folliard, and Lianxiang Du [International Workshop on Sustainable Development and
Concrete Technology]. “Sustainable development using Controlled Low-Strength Material’’.
5) Claire S. Gemperline and Dr. Stephan Durham [ICPTT 2012] ASCE 2013 “Beneficial Use of Recycled Materials in Controlled Low Strength Materials’’.
[image:6.595.44.276.284.427.2]