ISSN Online: 2161-7198 ISSN Print: 2161-718X
Forecasting S&P 500 Stock Index Using Statistical
Learning Models
Chongda Liu, Jihua Wang, Di Xiao, Qi Liang
Department of Industrial Engineering, University of Illinois at Urbana-Champaign, Urbana, IL, USA
Abstract
Forecasting the movement of stock market is a long-time attractive topic. This paper implements different statistical learning models to predict the movement of S&P 500 index. The S&P 500 index is influenced by other important financial indexes across the world such as commodity price and financial technical indicators. This paper systematically investigated four supervised learning models, including Logistic Re-gression, Gaussian Discriminant Analysis (GDA), Naive Bayes and Support Vector Machine (SVM) in the forecast of S&P 500 index. After several experiments of opti-mization in features and models, especially the SVM kernel selection and feature se-lection for different models, this paper concludes that a SVM model with a Radial Basis Function (RBF) kernel can achieve an accuracy rate of 62.51% for the future market trend of the S&P 500 index.
Keywords
Statistical Learning Models, S&P 500 Index, Feature Selection, SVM, RBF Kernel
1. Introduction
With the dramatic development of financial engineering, quantitative methodologies play an increasingly significant role in forecasting the price of various financial prod-ucts. Among different quantitative methods, statistical learning is one of the most effi-cient and widely applicable tools. This paper focuses on S&P 500 stock index forecast-ing, since the prediction of the movement of stock market is a long-time attractive topic to researchers from different fields.
The S&P 500 Index is a free float-adjusted market capitalization-weighted stock market index in the United States. It is used to record and monitor daily changes of the largest companies of the American stock market and is the main indicator of the overall market performance in the United States. As US is one of the financial centers across How to cite this paper: Liu, C.D., Wang,
J.H., Xiao, D. and Liang, Q. (2016) Fore-casting S&P 500 Stock Index Using Statis-tical Learning Models. Open Journal of Sta- tistics, 6, 1067-1075.
http://dx.doi.org/10.4236/ojs.2016.66086
Received: August 31, 2016 Accepted: September 15, 2016 Published: December 7, 2016
Copyright © 2016 by authors and Scientific Research Publishing Inc. This work is licensed under the Creative Commons Attribution International License (CC BY 4.0).
the world, the S&P 500 is considered as one of the most important global financial in-dicators. This paper finds that the value of S&P 500 may be influenced by other major financial indexes across the world, like FTSE 100, NIKKEI 225, SSE, DJIA and NASDAQ, and exchange rates like USD/CNY, USD/JPY and USD/GBP. Besides, we have to consider the technical indicators of the S&P 500 itself, and the crude oil price as well as gold price could also influence the stock price. Based on that, we tried different statistical learning classification methods to forecast the moving direction of S&P 500 index. The higher accuracy rate we can get, the more confidence we will develop a prof-itable trading strategy.
This paper is organized as follows; section 2 explains how data is collected and processed. Section 3 and 4 introduce various statistical learning models implemented to predict the stock market trends, such as logistic regression, Gaussian Discriminant Analysis (GDA), Naive Bayes (NB) and Support Vector Machines (SVM) [1] for the classification. To optimize these models, the SVM models with three different kernels are used to improve the preformation of SVM. After that, the forward search method is used for the feature selection and further improves the predictability. Finally, section 4 presents the results and analyzed the entire models.
2. Data Preparing
2.1. Feature Types and Date Range
Different financial features data from 01/01/2004 to 12/31/2014 are collected. This pa-per analyzes the features as shown in the Features Table in Appendix. There are three types of features. One type is other global financial market indexes in addition to the S&P 500, such as FTSE 100, NIKKEI 225 and SSE. The second one is some currency rates corresponding to different stock index for different stock exchanges and com-modity price that may have important impact on financial market, particularly crude oil and gold. The third type is the technical indicator of S&P 500 itself, because these mathematic formulas give us clues about the trend of the market. Among many tech-nical indicators, momentum and rate-of-change are chosen as inputs. All features may have possible impacts on S&P 500 index. All feature data is extracted from yahoo finance website and Bloomberg terminal.
2.2. Data Transformation
Data obtained from the above resources is the absolute daily price information. How-ever, the daily return data rather than the absolute daily price is more important from a financial perspective. So this paper transformed the daily price into daily return using the formula as shown below:
1
1 100
n n
n n
P P r
P −
− −
= ∗ (1)
return of S&P 500 index is negative, the output is downward state, which will be pre-sented as −1; otherwise, if the daily return of S&P 500 index is non-negative, the output is upward state, which will be presented as 1.
2.3. Data Cleansing
After data transformation, the next step is data cleansing. There are two main assign-ments of data cleansing. One is dealing with missing data, and the other is data align-ment.
The first consideration is dealing with missing data. Features used in this paper are from different assets and from different area. Because of different holiday setup and different trading day arrangements, there are some missing data in different time zones. Since this paper used enough historical data, it’s reasonable to exclude those data un-available in some dates.
Another consideration is data alignment. The trading periods of different assets and regions are different. Specifically, the market of S&P 500, NASDAQ and DJIA are traded in the same time period while market in Asia such as NIKKEI 225 and SSE are traded before the market in US, though dates are the same. So this paper uses the daily data of NASDAQ and DJIA in previous date and data of NIKKEI 225 and SSE in the same date to forecast the moving direction of S&P 500.
To avoid the influence of different data scales, this paper scales feature values linearly in a range of [−1, 1]. Otherwise the features with large numeric range in value will do-minate those with small numeric range.
2.4. Feature Correlation Analysis
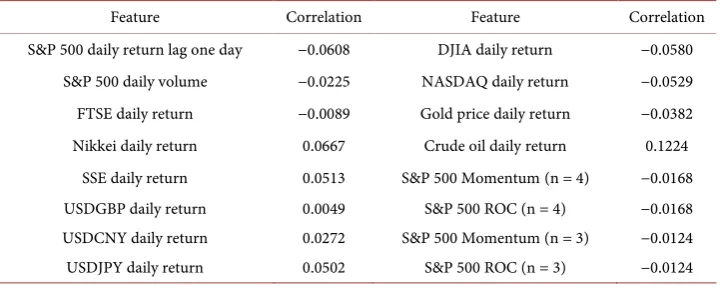
[image:3.595.195.556.562.705.2]For an initial analysis, this paper calculates the correlation coefficients between the moving directions of S&P 500 denoted by 1 and −1, and the processed feature data.
Table 1 shows that crude oil is the main feature for the classification due to its large correlation with the S&P 500 movement. Other features’ correlations with the market movement are not very significant and therefore further analyses about those features are needed. In the following sections, various statistical learning methods were used to model the S&P 500 movement and find out features that provide the best predictability.
Table 1. The correlation of S&P 500 moving direction and different features.
Feature Correlation Feature Correlation
S&P 500 daily return lag one day −0.0608 DJIA daily return −0.0580 S&P 500 daily volume −0.0225 NASDAQ daily return −0.0529 FTSE daily return −0.0089 Gold price daily return −0.0382 Nikkei daily return 0.0667 Crude oil daily return 0.1224
3. Methodology
3.1. Model Selection
There are four kinds of supervised learning models, including Logistic Regression, GDA, Naive Bayes and SVM in the forecast of S&P 500 index [2]. In order to test the validation of those models, 2/3 data are used for training and 1/3 data for testing.
[image:4.595.190.554.534.611.2]Firstly these four models are trained with all 16 features and their accuracies are ex-amined using the testing dataset. The results are shown in Table 2.
Table 2 concludes that without any improvement, logistic regression and GDA per-form better than NB and SVM. Since in theory the accuracy rate of random guessing the movement of stock price should be 50%, these four models all in certain degree help the predictability of stock market trend. However, all the results are not very satisfacto-ry and we have to improve those models in many aspects.
Next, we will focus on improving the four models by feature selection, besides we could further improve SVM by kernel selection.
3.2. SVM Kernel Selection
Before doing feature selection, three different kernels in SVM were implemented such as linear kernel, polynomial kernel and Radial Basis Function (RBF) [3]. This paper also develops programs to decide the parameter values for different models for the best sake of the accuracy. The accuracy of SVM using three kernels are shown in Table 3.
The linear kernel of SVM achieved the highest accuracy among the three kernels for now. But this is just a preliminary result owing to the potential over-fitting between different features. Therefore, we implement feature selection to avoid this problem.
4. Feature Selection
This paper used the forward search method to select features for the logistic regression, GDA, Naive Bayes and SVM model. The set of 16 features that we initially assume could influence the S&P 500 movement may be too large and some features may provide
Table 2. Accuracy rate without improvement.
Model Accuracy
Logistic 58.60%
GDA 58.24%
NB 57.89%
[image:4.595.190.555.643.709.2]SVM 56.82%
Table 3. SVM kernel improvement.
Model Accuracy
Linear 56.82%
RBF 55.87%
over-fitting information. In order to deal with the possible overlapping features, feature selections are implemented on all models and it turns out that it is very necessary in decreasing data complexity and increasing the prediction accuracy.
Generally speaking, feature selection algorithms include the filter methods and wrapped methods. Filter methods require no feedback from the classifier. However, the wrapped methods are classifier dependent, which is suitable for the forecasting of the moving direction of S&P 500. A proper wrapper method can be used to evaluate the fitness of the selected feature subset and yield better performance. Meanwhile, the high computational complexity of wrapper methods can be balanced by the sample size, which further substantiates the use of wrapper methods in the feature selection.
This paper can’t implement all the models under the possible feature subsets for 16 different features. Therefore, this paper should require the feature selection algorithms to proceed greedily, specifically forward selection method and backward selection me-thod. However, eliminating one feature among totally 16 features could cause tiny change for the accuracy. Therefore, it is difficult for backward to eliminate one feature to improve the accuracy efficiently. For forward selection method, this paper chooses these important features firstly from 16 features to reduce the error from the over-fitting problems. When we achieve the biggest accuracy rate, we can train learning models with this subset of selected features. The results are shown below.
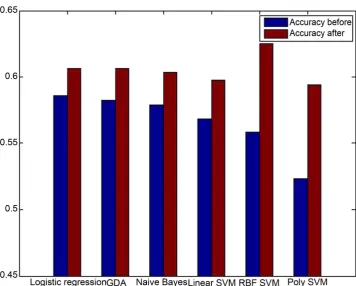
In Table 4 and Figure 1, this paper concludes that each of the forecasting models is improved through feature selection. Especially for SVM with RBF kernel, the accuracy rate increases by 6.64% and achieves the highest accuracy in all the forecasting models. This can be attributed to RBF kernel’s function to map samples non-linearly into a higher dimensional space and that it has fewer hyper-parameters than polynomial ker-nel, which has an impact on the complexity of model selection. Parameters in SVM and RBF need to be turned for the best performance of the machine learning methods such as the penalty factor (C) and Epsilon (ε).
[image:5.595.195.554.596.707.2]In section 2, this paper calculates the correlation between different features and the moving directions of S&P 500. Due to the highest correlation between crude oil and the moving direction, it is the only one feature selected by every model (see Table 5). Be-sides, for other features with high correlation coefficients, including S&P 500 lag one day, Nikkei, SSE and DJIA, many different models also select them. In addition, Table 5 shows that the number of features selected by most of models is no more than 8. It
Table 4. Accuracy rate before and after feature selection.
Model Accuracy Before Accuracy After
Logistic regression 58.6% 60.62%
GDA 58.24% 60.62%
Naive Bayes 57.89% 60.38%
Linear SVM 56.82% 59.79%
RBF SVM 55.87% 62.51%
Figure 1. Accuracy rate before and after feature selection.
Table 5. Feature selected for different models.
Logistic regression GDA Naive Bayes Linear SVM RBF SVM Poly SVM Momentum (n = 4) Crude Oil Crude Oil S&P 500 volume Crude Oil Crude Oil SSE DJIA USDJPY SSE S&P 500 volume Gold Price S&P 500 lag one SSE S&P 500 lag one Nikkei SSE S&P 500 volume
Crude Oil USDCNY Crude Oil S&P 500 lag one USDCNY
DJIA S&P 500 volume NASDAQ NASDAQ
USDCNY Gold price DJIA Nikkei
USDJPY ROC (n = 4)
Gold price SSE
means that feature selection addresses the over-fitting problem efficiently and elimi-nates those less important features. Combined by Table 4, which compares the accura-cy rate with and without the feature selection, SVM with different kernels significantly increases the accuracy rate. Therefore, SVM is the most efficient tool to handle the over-fitting problem in this paper and SVM with RBF kernel performs the best among three kernels.
5. Future Work and Conclusions
from several aspects. For instance, features with different time periods may also influ-ence the forecasting of the stock market. Future research can include several time series features in the classification models and use better feature selection algorithms in order to generate a better prediction result.
Further work may consider how to apply the research method in creating applicable strategies in the real financial market. In order to achieve this, several more steps must be implemented. First of all, more back tests are suggested within different time periods to make sure that the strategy is robustly profitable. In addition, with the new data and results, models need to be updated.
When data is changed, model performance will be affected. Data needs to be cleaned and data imputation is a necessary step before a model is set up. For example, missing values and outlier need to be processed well otherwise unprocessed data will affect the model performance significantly. In addition, training and test datasets need to be carefully selected to reflect the main features of the whole dataset otherwise it’s hard to find the true patterns for this dataset [4][5]. In addition, over fitting problems can be alleviated by cross validation techniques. Also parameters in SVM and RBF need to be turned for the best performance of the machine learning methods. If there are too many features, variance may be too big for the best performance of a regression me-thod. Then a dimension reduction method such as principle component analysis (PCA) is a necessary step to reduce the dimension firstly before a machine learning method is applied. If data is huge, big data techniques such as Spark MLlib is an efficient way to implement the machine learning techniques [6][7].
In addition, future research may examine whether the SVM with RBF kernel is still the best model and whether the features selected are good enough. Second it’s sug-gested to apply the strategy in the real test for a certain period, such as a test beyond the sample data. Besides, the strategy needs to be evaluated with some criteria such as Sharpe Ratio or Maximum Drawdown. In order to obtain an applicable and mature strategy based on the methods of forecasting S&P 500 index discussed above, some further research needs to be done.
References
[1] Huang, W., Nakamori, Y. and Wang, S.Y. (2005) Forecasting Stock Market Movement Di-rection with Support Vector Machine. Computers & Operations Research,32, 2513-2522.
https://doi.org/10.1016/j.cor.2004.03.016
[2] Choudhry, R. and Garg, K. (2008) A Hybrid Machine Learning System for Stock Market Forecasting. World Academy of Science, Engineering and Technology, 39, 315-318.
http://waset.org/publications/8952/a-hybrid-machine-learning-system-for-stock-market-fo recasting
[3] Kim, K. (2003) Financial Time Series Forecasting Using Support Vector Machines. Neuro-computing, 55, 307-319. https://doi.org/10.1016/s0925-2312(03)00372-2
[4] Quinlan, J.R. (2014) C4. 5: Programs for Machine Learning. Elsevier, 58-60.
https://books.google.com/books/about/C4_5.html?id=b3ujBQAAQBAJ
[5] Bradley, A.P. (1997) The Use of the Area under the ROC Curve in the Evaluation of Ma-chine Learning Algorithms. Pattern Recognition, 30, 1145-1159.
https://doi.org/10.1016/S0031-3203(96)00142-2
[6] Meng, X., Bradley, J., Yuvaz, B., Sparks, E., Venkataraman, S., Liu, D. and Xin, D. (2016) Mllib: Machine Learning in Apache Spark. JMLR, 17, 1-7.
http://www.jmlr.org/papers/volume17/15-237/15-237.pdf
[7] Zaharia, M., Chowdhury, M., Franklin, M.J., Shenker, S. and Stoica, I. (2010) Spark: Cluster Computing with Working Sets. HotCloud, 10, 10-10.
Appendix
Feature Table
Feature Category Explanation
S&P 500 daily return lag one day Stock Index Denote Standard & Poor’s 500 adjust close price c(n), daily return is (c(t)-c(t − 1))/c(t − 1) S&P 500 daily volume Stock Index Standard & Poor’s 500 daily trading volume
FTSE daily return Stock Index A stock index for London Stock Exchange with 100 companies’ stocks Nikkei daily return Stock Index A stock index for the Tokyo Stock Exchange
SSE daily return Stock Index A stock index of A shares and B shares that traded at the Shanghai Stock Exchange USDGBP daily return Currency Rate British Pound-US Dollar exchange rate
USDCNY daily return Currency Rate Chinese RMB-US Dollar exchange rate USDJPY daily return Currency Rate Japanese Yen-US Dollar exchange rate
DJIA daily return Stock Index Dow Jones Industrial Average
NASDAQ daily return Stock Index A stock index including common stocks and similar securities listed on the NASDAQ stock market Gold price daily return Commodity Commodity price of gold
Crude oil daily return Commodity Commodity price of crude oil S&P 500 Momentum (n = 4) Stock Index (c(t)-c(t − 4))/c(t − 4)
S&P 500 ROC (n = 4) Stock Index Price rate-of-change c(t)/c(t − 4) S&P 500 Momentum (n = 3) Stock Index (c(t)-c(t − 3))/c(t − 3)
S&P 500 ROC (n = 3) Stock Index Price rate-of-change c(t)/c(t − 3)
Submit or recommend next manuscript to SCIRP and we will provide best service for you:
Accepting pre-submission inquiries through Email, Facebook, LinkedIn, Twitter, etc. A wide selection of journals (inclusive of 9 subjects, more than 200 journals)
Providing 24-hour high-quality service User-friendly online submission system Fair and swift peer-review system
Efficient typesetting and proofreading procedure
Display of the result of downloads and visits, as well as the number of cited articles Maximum dissemination of your research work