http://dx.doi.org/10.4236/eng.2016.86030
Test Study on Navigation in the First
Construction Period of Lize
Navigation-Power Junction
Kai Chen
School of River & Ocean Engineering, Chongqing Jiaotong University, Chongqing, China
Received 2 June 2016; accepted 19 June 2016; published 22 June 2016
Copyright © 2016 by author and Scientific Research Publishing Inc.
This work is licensed under the Creative Commons Attribution International License (CC BY). http://creativecommons.org/licenses/by/4.0/
Abstract
Based on the test results of Lize navigation-power junction construction diversion through the normal fix-bed model with the scale of 1:100, the navigation flow condition in each construction diversion period is studied. There are a lot of problems in the first construction diversion period, such as excessive flow velocity, poor flow pattern, low navigation discharge and so on. To solve these problems, the comprehensive engineering measures for improving the navigation flow con-dition during construction are put forward. Among them, the structure forms of construction di-version cofferdam are optimized. Finally, the highest safe navigation discharge and reasonable navigation route are proposed. The experimental results obtained from the optimization scheme of the first construction diversion period are better than these from the original scheme in terms of flow velocity, flow pattern and so on. The research results may serve as reference for similar engineering.
Keywords
Navigation-Power Junction, Construction Diversion, Navigation Condition, Experimental Research, Optimization Schemes
1. Introduction
In recent years, many scholars have made some studies of the navigation flow condition. According to the
con-struction diversion model test results of Zhuzhou Navigation-power junction, Lun Chao Huang [1] analysed the
issue during the construction of river discharge flow and flow conditions, and some measures are put forward to
and the second phase of the navigable flow condition of Yilan Navigation-power junction. The results showed that the first stage cofferdam was not only increasing the water level, but changing the flow velocity distribution.
Yin Chongqing [3] solved the problem of navigation Long Xikou Navigation-power junction construction
pe-riod. Based on the arrangement conditions of water level treatment hinge and navigation conditions of the
con-struction reach, through theoretical analysis and model experiment, Chen Ye-Ying [4] proposed the navigation
guaranteeing measures which combined waterway dredging, reef explosion for barrier clearance with scientific
station dispatch. In addition, there are also many scholars who have conducted the research in this area [5]-[9].
During the construction diversion period of navigation-power junction, cofferdam and diversion structures will narrow beam reach and reduce section area of water, change the original flow characteristics, thus affecting the river flood capacity and navigation flow condition. In order to ensure the safety of construction and the de-velopment of regional economy, it is necessary to ensure that the current condition of the river in the construc-tion period can satisfy the safe navigaconstruc-tion of the ship. This paper according to the normal physical model test of Lize navigation-power junction, analyses the existing problems, and puts forward the corresponding improve-ment measures.
2. Engineering Situation
Lize navigation-power junction is a comprehensive utilization of navigation-power junction, the construction period is long, the construction layout is complicated, and the construction process includes four dry seasons and four flood season. The four phase of the construction diversion period does not carry out the navigation re-quirements, so this paper mainly studies the navigation flow conditions during the three phase of the construc-tion period. The construcconstruc-tion diversion program adopted in this project: During the first dry period, the ship lock and 6.5 hole gate lock will be surrounded in the left, the fluid passed through the right bank and dismantled the starter cofferdam before the flood season. During the first flood period, the ship lock in continue to construction with the cofferdam protection for the whole year, the fluid passed through the right bank and the repaired 4 hole gate locks. During the second dry period, the power plant in the right will be surrounded, the ship lock will be in continue to construction in the left, the fluid passed through the middle bank and 4 hole gate locks. During the second flood period, the ship lock will be used for navigation, and the fluid will pass through foundation pit of the power plant. During the third dry period, the power plant in the right and the rest of 7.5 hole gate locks are surrounded, the fluid passed through 6 hole gate locks. During the third flood period, the power plant will be in continue to construction, the fluid will pass through 12 hole gate locks.
The recommended diversion standard for the construction period of the project: The dry season cofferdam flood standard is 10 years return period from November to April, and the corresponding design flux Q = 2620
m3/s. The flood season cofferdam flood standard is 10 years return period of the whole year, and the
corres-ponding design Q = 20,500 m3/s.
3. Model Design and Verification
3.1. Model Design
In order to meet the requirements of the research content and reduce model scale effect, and make the research problem directly reflect the actual situation of the project construction period, the model is designed according to the gravity similarity criterion, and the normal solid model is adopted. The geometric scale of the normal model is 1:100. The simulation range is from the dam axis above 1.7 km to the dam axis below 1.3 km, and the navigation problems of the river reach in the period of the cofferdam construction are studied. The each scale of
the model can be seen in Table 1.
3.2. Model Verification
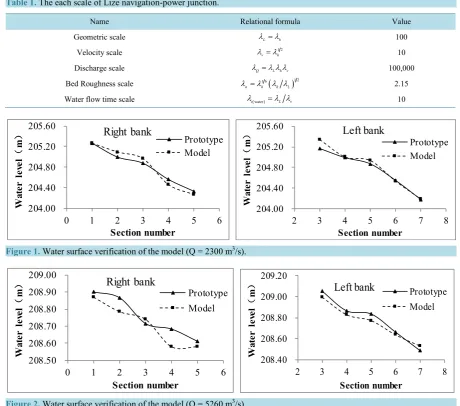
1) Water surface verification
This paper uses the water level gauge section of the field data to verify the accuracy of the model with the
flux Q = 2300 m3/s and Q = 5260 m3/s. And the water level of the model is compared with the measured water
level of the prototype. The results are shown in Figure 1 and Figure 2.
According to the water level deviation values from Figure 1 and Figure 2, the abscissa is the number of
Table 1. The each scale of Lize navigation-power junction.
Name Relational formula Value
Geometric scale λL=λh 100
Velocity scale 1 2
v h
λ =λ 10
Discharge scale λQ=λ λ λL h v 100,000
Bed Roughness scale 1 6( )1 2
n h h L
λ =λ λ λ 2.15
Water flow time scale λt(water)=λ λL v 10
Figure 1. Water surface verification of the model (Q = 2300 m3/s).
Figure 2. Water surface verification of the model (Q = 5260 m3/s).
The maximum deviation occurred in the No. 3 section of the left bank and the No. 4 section of the right bank, where the measured values were 205.17 m and 208.68 m and the corresponding calculated values are 205.34 m and 205.58 m. The difference between the two was 0.17 m and 0.10 m. It shows that the model of the river channel and the prototype channel basically meet the requirements of similar resistance.
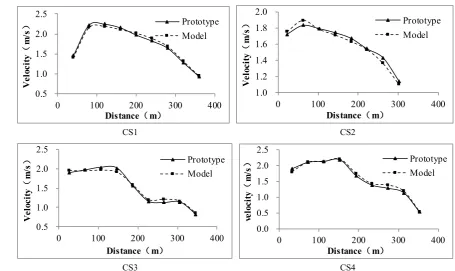
2) Velocity verification
This paper uses the draft water velocity field data to verify the accuracy of the model with the flux Q = 2600
m3/s. And the water velocity of the model is compared with the measured water velocity of the prototype. The
results are shown in Figure 3.
As shown in Figure 3, the abscissa represents the distance between each measuring point on each flow
sec-tion and the left bank. And the vertical coordinate is the corresponding velocity. The value and the distribusec-tion of velocity and the position of the maximum and the minimum of the four flow sections CS1-CS4 are all con-sistent. The difference between the prototype value and the model value is 0.1 m/s, the smallest difference is 0.01 m/s. The results show that the model is consistent with the measured data of the prototype.
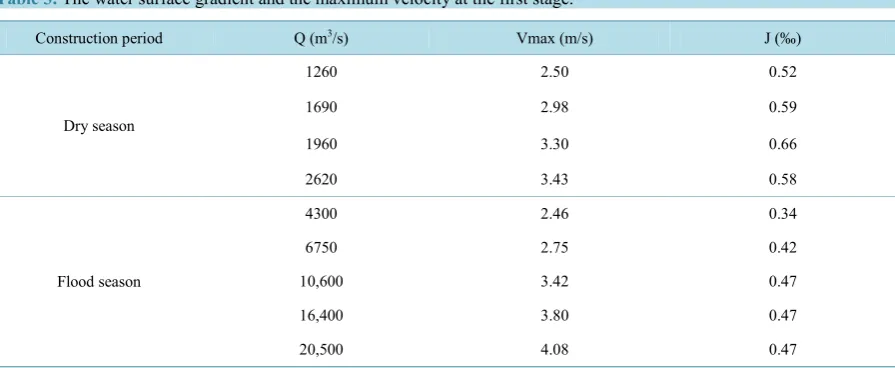
4. Navigation Flow Condition of the First Construction Diversion Period
The hydraulic calculation index of the first stage cofferdam construction diversion is shown in Table 2.
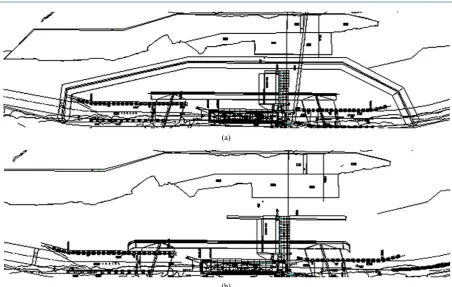
The layout of original scheme in the first construction diversion cofferdam period is shown in Figure 4.
204.00 204.40 204.80 205.20 205.60
0 1 2 3 4 5 6
W at er l ev el ( m ) Section number Prototype Model
Right bank
204.00 204.40 204.80 205.20 205.602 3 4 5 6 7 8
W at er l ev el ( m ) Section number Prototype Model
Left bank
208.50 208.60 208.70 208.80 208.90 209.000 1 2 3 4 5 6
W at er l ev el ( m ) Section number Prototype Model
Right bank
208.40 208.60 208.80 209.00 209.202 3 4 5 6 7 8
CS1 CS2
[image:4.595.81.537.80.351.2]CS3 CS4
Figure 3. The velocity verification of the model (Q = 2600 m3/s).
[image:4.595.87.537.369.688.2](b)
Figure 4. The layout of the first construction diversion cofferdam period. (a) The cofferdam layout in dry season. (b) The
cofferdam layout in flood season.
0.5 1.0 1.5 2.0 2.5
0 100 200 300 400
V
el
oc
ity
(
m/
s
)
Distance(m)
Prototype Model
1.0 1.2 1.4 1.6 1.8 2.0
0 100 200 300 400
V
el
oc
ity
(
m/
s
)
Distance(m)
Prototype Model
0.5 1.0 1.5 2.0 2.5
0 100 200 300 400
V
el
oc
ity
(
m/
s
)
Distance(m)
Prototype Model
0.0 0.5 1.0 1.5 2.0 2.5
0 100 200 300 400
vel
oc
ity
(
m/
s
)
Distance(m)
In order to know the navigation flow condition of the right channel, the relevant data in engineering reach,
such as water level, flow rate and flow pattern, are analyzed deeply. The results are shown in Table 3.
The water retaining cofferdam is arranged in the left bank in the dry season, it reduces the flow area of the reach, and to a certain extent, the original river bed form and flow characteristics of the engineering reach have
been changed. From Table 3, When the upstream flow Q = 1260 m3/s, the minimum depth of project reach is
2.77 m, the water ratio dropped to 0.52 per thousand, and the maximum surface velocity is 2.50 m/s. When the
flow Q > 1260 m3/s, the maximum surface flow velocity of Engineering reach is generally more than 3 m/s, it is
not suitable for navigation.
The dry cofferdam of left bank will be demolished in flood season. When Q = 4300 m3/s, the water ratio
dropped to 0.34 per thousand, the maximum flow velocity is 2.46 m/s; When Q = 6750 m3/s, the river water
ra-tio dropped to 0.42 per thousand, the maximum surface velocity is 2.75 m/s. When Q > 6750 m3/s, the
maxi-mum surface flow rate is generally more than 3 m/s, the engineering reach cannot meet the requirements of na-vigation.
The major measures taken in modification scheme are: The two section of the original scheme is connected to one section of the cofferdam in dry season. It reduces the backflow phenomenon produced at the corner of the two section cofferdam. The ends of annual cofferdam of the ship lock are designed as 1/4 elliptic curve, and its
elliptic equation is x2/102 + y2/202 = 1. The modified dike head reduces the effect of the flow on the head of the
cofferdam and the flow regime is relatively flat. The specific modification scheme layout is shown in Figure 5.
After the modified scheme of the first dry season, when Q ≤ 2620 m3/s, compared with the original plan, the
maximum surface flow velocity of the revised plan is decreased. The overall flow pattern is better than the orig-inal plan. For example, the changes of velocity between the origorig-inal scheme and modified scheme when Q =
1260 m3/s is shown in Figure 6, the changes of the maximum gradient is shown in Figure 7.
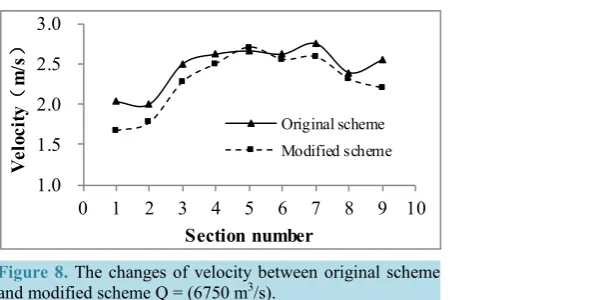
After the modified scheme of the first flood season, when Q ≤ 6750 m3/s, the navigation flow condition of the
engineering reach is better than that of the original scheme. For example, the maximum flow velocity in the
en-gineering reach when Q = 6750 m3/s is shown in Figure 8.
5. Conclusions
[image:5.595.89.537.536.720.2]1) The model has good similarity with the prototype, which can reflect the flow characteristics of the test sec-tion, and meet the requirements of the relevant standards.
Table 2. Hydraulic parameter for the first stage cofferdam construction period.
Q (m3/s) Upstream level (m) Downstream level (m) Average velocity (m/s)
2620 208.17 206.00 4.12
20,500 221.00 219.80 5.38
Table 3. The water surface gradient and the maximum velocity at the first stage.
Construction period Q (m3/s) Vmax (m/s) J (‰)
Dry season
1260 2.50 0.52
1690 2.98 0.59
1960 3.30 0.66
2620 3.43 0.58
Flood season
4300 2.46 0.34
6750 2.75 0.42
10,600 3.42 0.47
16,400 3.80 0.47
(a)
[image:6.595.86.539.76.363.2](b)
Figure 5. The modification scheme layout in the first construction period. (a) The cofferdam layout in dry season. (b) The
[image:6.595.196.537.392.685.2]cofferdam layout in flood season.
Figure 6. The changes of velocity (Q = 1260 m3/s).
Figure 7. The changes of the maximum gradient.
2) Through a comprehensive analysis of the navigation flow condition of Lize navigation-power junction, in view of the river bed of the first construction diversion period is narrow and the velocity changes greatly, the
0.0 1.0 2.0 3.0
0 1 2 3 4 5 6 7 8 9 10
V
el
oc
ity
(
m/
s
)
Section number
Original scheme Modified scheme
0.4
0.5
0.6
0.7
0.8
0.9
1000
1500
2000
2500
3000
J
(
‰
)
Q
(
m
3/s
)
Figure 8. The changes of velocity between original scheme
and modified scheme Q = (6750 m3/s).
navigation section of the construction period should be used as a navigation control section. And one-way traffic should be implemented.
3) The maximum navigation discharge of Lize navigation-power junction in the first construction period is
Q = 1260 m3/s in dry season and Q = 6750 m3/s in flood season.
References
[1] Huang, L.-C., Jing, S.-Q. and Liu, C. (2001)Test and Study of Navigation Flow Condition during Construction Period for Zhuzhou Junction Project of Xiangjiang River. Port &Waterway Engineering, No. 11, 31-34.
[2] Lv, J.-Y., Wang, Y.-A. and Yu, G.N. (2010) Navigation Condition during Construction Period of Yilan Power Junction in Songhua River. Journal of Waterway and Harbor, No. 6, 604-608.
[3] Yin, C.-Q., Liu, F.-Z. and Zhang, Z. (2013) Test Study on Navigation in Construction Period of Longxikou Naviga-tion-Power Junction on Min River. Port &Waterway Engineering, No. 1, 114-120.
[4] Chen, Y.-Y., Hu, X.-W. and Peng, K. (2012) Navigation during Regulation of Tail Water Level of Shuikou Hydroelec-tric Station. Port &Waterway Engineering, No.1, 83-87.
[5] Chao, D.H. (1997) The Applications and Study of Numerical Simulation of Turbulence Flow with Free Surface in Hy-draulic Spillway Structure. Journal of Hydrodynamics, No. B4, 54-59.
[6] Weng, Y.H., Xie, X.R. and Fan, W.Y. (2011) The Construction Design and Practice of Three Gorges Project. Engi-neering Sciences, No. 3, 96-103.
[7] Yang, Y., Peng, B. and Dong, X.-R. (2011) Performance Evaluation Method of Hybrid Navigation Constellations with Invalid Satellites. Science China (Physics, Mechanics & Astronomy), 54, 1046-1050.
http://dx.doi.org/10.1007/s11433-011-4344-7
[8] Li, Z.-J., Zhang, G.-L. and Sun, G.-H. (2014) On Construction Diversion and Cofferdam Scheme of Ship Lock Recon-struction Project on Fuchunjiang River. Port & Waterway Engineering, No. 10, 115-120.
[9] Li, Y., Zhou, H.-X. and Zheng, B.-Y. (2004) Model Test on Diversion Works in Construction of Naji Hydro-Junction.
Journal of Waterway and Harbor, No. 3, 145-149.
1.0 1.5 2.0 2.5 3.0
0 1 2 3 4 5 6 7 8 9 10
V
el
oc
ity
(
m/
s
)
Section number