Munich Personal RePEc Archive
Learning, Generalization and the
Perception of Information: an
Experimental Study
Novarese, Marco and Lanteri, Alessandro and Tibaldeschi,
Cesare
Centre for Cognitive Economics, Università Amedeo Avogadro
2010
Online at
https://mpra.ub.uni-muenchen.de/28007/
1
Learning, Generalization and the Perception of Information: an
Experimental Study
Alessandro Lanteri, Marco Novarese ([email protected]) and Cesare Tibaldeschi
ABSTRACT. This article experimentally explores the way in which human agents learn
how to process and manage new information. In an abstract setting, players should
perform an everyday task: selecting information, making generalizations, distinguishing
contexts. The tendency to generalize is common to all participants, but in a different way.
Best players have a stringer tendency to generalise rules. A high score is, in fact, associated
with low entropy for mistakes, that is with a tendency to repeat the same mistakes over
and over. Though the repetition of mistakes might be considered a failure to properly
employ feedback or a bias, it may instead turn out as a viable and successful procedure.
This result is connected to the literature on learning.
KEY WORDS: behavioural entropy, cognitive economics, complexity, experiments,
feedback, heuristics, learning
2
Sensorial perception, information processing, mental representation, and learning do not
sound like the typical economics jargon. Microeconomic mainstream does not entertain
with these concepts because its approach abstracts from real psychological properties and
actual decision processes. According to the standard microeconomic approach, individual
behaviour is rational – in a substantive sense – when it achieves the given goals of an agent within the exogenous limits of the choice environment. Individual preferences and
meta-preferences, for instance egoism and altruism, are external to this approach and
must be posited a priori. In order to realise given (egoistic or altruistic) goals, an agent must possess complete knowledge of the choice environment and be capable of perfectly
computing all this information in an optimal fashion. Both conditions are hardly ever
realised and the capacity of microeconomic models to explain individual behaviour are
very scarce. Within the ranks of economics, however, on several occasions different
scholars have called for an expansion of economic analysis to include more nuanced and
plausible accounts of human agency.
For instance, Herbert Simon (1976), suggested a concept of rationality which is
bounded – i.e. with limited available information and limited capacity to process it – and
which is based on procedures instead of substantive goals. His research, therefore, had a positive focus on the uncovering of actual decision processes, but inevitably took a
normative lean in the definition of what are the best procedures available to real economic
agents. Uncovering the way people think, decide, and learn affords a better understanding
of the social world, but it also empowers the development of better choice aids and
teaching methods.
This article falls within this approach, which may be called Cognitive Economics,
and it experimentally explores the way in which the participants learn how to process and
manage new information. Our experimental setting is abstract so that the participants
cannot rely on any knowledge they already have and must instead learn everything from
scratch. In such an abstract setting, our players should perform an everyday task: selecting
information, making generalizations, distinguishing contexts. Can they learn how to
consistently make the best choice in a new complex environment?
LITERATURE REVIEW
In standard economics, the pressure of competition (Alchian 1950) ensures that agents
who do not make the best choices are forced out of the market in a fashion akin to natural
selection (Vromen 1995). Individual agents are therefore routinely modelled in such a way
3
perfect information and unlimited computational skills, and to pursue their narrow
material advantage. Although it is implausible that individuals are (or even can be) as
microeconomic models represent them, it may be enough for economists to show that
people become (or tend to become) such. Agents capable of improving their performance
over time and of progressing towards ever more efficient decisions may uphold, and justify
the recourse to, the assumption of perfect individual rationality. This requires the
modelling of some individual capacity to learn.
Some examples of how this has been attempted are the Bayesian and the Least
Square Learning (e.g. Marcet and Sargent 1989). Both describe the optimal processing of
available empirical data by individual agents. These data are then employed in subsequent
decision making in a way that approximates the assumption of complete information.
Though also the assumption of perfect processing of information is implausible, even
psychological models which assume an imperfect processing of the information suggest
that people can learn how to make the best choices. Reinforcement Learning models (e.g.
Erev and Roth 1998), for instance, suggest that agents repeat choices which allowed
positive results in the past and consequently adjust their behaviour to empirical evidence
in a way that makes it increasingly likely to observe a repetition of the same behaviour
(although a, smaller and smaller, probability of making a different choice remains). In
standard and stable contexts, reinforcement learning easily results in consistently optimal
behaviour just like microeconomic models require.
Learning, however, should not be considered as a black-box mechanism that
prompts automatic choices, but rather as a process of assigning specific meanings to
different states of the world. Brian Arthur (1992), for instance, observed learning cannot be
reduced to the acquisition of new data, but it requires the construction of semantic
categories that categorise the data. Moreover, individuals build mental models that
organise large chunks of empirical evidence. Starting from observation, individuals
generate hypotheses about causality and develop models that allow prediction and
decision-making. These hypotheses and models are neither static nor unique. Choices are
thus repeatedly tested against real world phenomena, associated with their observed
outcome, and eventually reinforced or abandoned. The world presents traceable patterns
and Arthur believes that the skill to detect these patterns is both a necessary and
advantageous human cognitive skill.
Richard Nelson (2007) suggests that the search for better ways of doing something
is both oriented and constrained by what agents currently know. Current knowledge
4
either in a more efficient behaviour or in an improved understanding of the specific
decision-making context. The agent "either needs to learn how to identify different
contexts, as well as a set of context specific guides of action, or find a broad guide to action
that works reasonably well in all or most contexts he will face" (Nelson 2007, p. 6).
Therefore, problem solving requires both trial-and-error learning and abstract theorizing.
The study of the capacity to manage information in a complex environment is also central to Ronald Heiner‟s (1983, 1985) model of behavioural entropy. According to Heiner, individuals more or less consciously make a choice between very few of the many
different actions which are possible on each occasion. This subset consisting of „reliable‟
actions, or actions which typically afford satisfactory results, is a result of uncertainty –
which can be defined as a lack of knowledge of (or lack of the skill to define) the link
between contexts and optimal decisions. A reduction in the number of potential options
may be a consequence of reacting only to some information, ignoring the rest, of
disregarding the distinction among certain pieces of information, or of individual failures
in the processing of information, resulting in somewhat generic rules of behaviour that
disregard some context-specific variables.
In the presence of uncertainty, it can be expected that agents try out several
alternative choices until they figure which ones are reliable. Therefore we observe high
variability of behaviour and it is very hard to predict which option will an actor choose
next. Over time, as agents learn to react to selected information, their behaviour should
become less erratic and therefore more predictable. Heiner employs behavioural entropy
as a measurement of the variability of behaviour. It can be computed as follows (see also
the Appendix):
a a
B
h h
E log (1)
where a is an element in the set of possible actions A, and ha=p(a) is the probability (relative frequency) of choosing a given action. The higher the number of different actions
attempted in the same choice-context and the more uniform their frequency (for instance
when an agent gives random answers), the higher an agent‟s behavioural entropy is and the harder it is to predict this agent‟s choices. Conversely, if an agent‟s behaviour is stable (because he always makes the same choice), entropy is zero.
5
interpret decision contexts. This immediately translates in the abandonment of any
concept of perfect rationality, which is instead replaced by a definition of bounded
rationality (à la Simon, 1983) as the capacity to manage only some subsets of useful
information. As people learn, they use larger and larger amounts of important information
and they react in more specialised ways to subtle changes in environmental conditions.
The overall variability of their behaviour therefore scales up, while its predictability is
diminished. Within narrowly defined choice contexts, however, variability shrinks.
Since behaviour reflects individual cognitions, learning ultimately affects an agent‟s behaviour through a change in the type or in the amount of his processed information –
e.g. concerning (un-)attainable or (un-)desirable outcomes; (un-)feasible, (in-)effective or
(in-)efficient actions. In this sense, all learning modifies the knowledge agent possesses
about the task he is facing (Novarese, 2012). The two main vehicles of learning (Bandura
1977, Rizzello and Turvani 2002, Witt 2000) are vicarious learning, which occurs via
observation or imitation of the behaviour of others, and direct learning, which takes place
when actors obtain information from the outcome of their own actions.
This idea of learning can be understood looking at an experiment which analyses
(direct) learning in a complex, but stable, choice environment with strong monetary
incentives and where full feedback is immediately available.
THE EXPERIMENT
The experiment took place at the Centre for Cognitive Economics at the University of
Eastern Piedmont in Alessandria (Italy) on the 5 July 2000.
Participants and Experimental Design
The participants were twenty-three undergraduate students of Law, enrolled in the
first-year optional Seminar of Economics. Each sat in a cubicle with a computer and was not
allowed to take notes or to communicate with the others. After reading the written
instructions (see the Appendix), the participants started the experiment, which lasted
about one hour. The students were compensated with 40 ITL (€ 0,02) per point scored in
the present experiment. They were told that the participation would have no impact on
their academic career outside the Seminar1.
Task
6
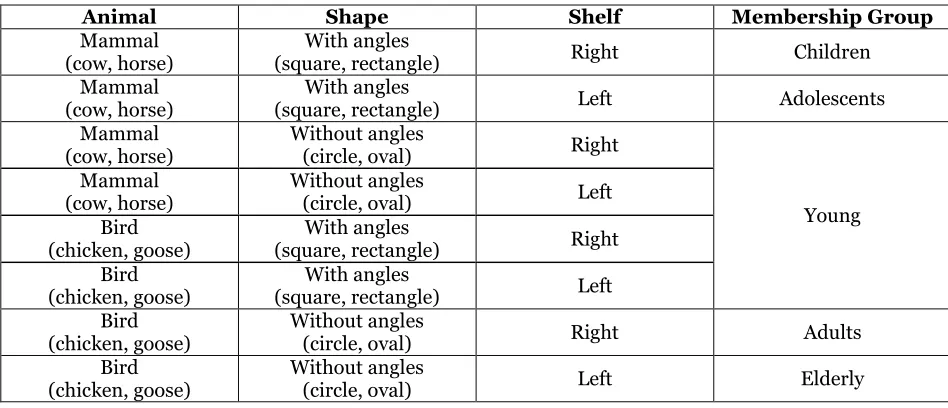
one of five age categories: Children, Adolescents, Young, Adults, and Elderly. The information about members is reported on a set of cards located on either of two shelves
(Right and Left). Each card presents two features: one of four animals (Cow, Horse, Goose, and Chicken) and one of four shapes (Square, Rectangle, Circle, and Oval)2, as in FIG. 1.
On each turn the participants were presented with a sequence of animal, shape, and
shelf, and were asked to guess the corresponding membership category within ten
seconds3. The logical relationship between the card features, the shelves, and the
membership was based on a specified criterion (i.e. it was not random) and it remained
constant throughout the 231 turns of the experiment, but it was not related to any real
world fact and it explicitly did not require any academic knowledge (TAB. 1). The
connection could and should be learned during the experiment in order to fulfil the
[image:7.595.60.534.344.548.2]ultimate goal of scoring as many points as possible.
Table 1 - Solution
Animal Shape Shelf Membership Group
Mammal (cow, horse)
With angles
(square, rectangle) Right Children
Mammal (cow, horse)
With angles
(square, rectangle) Left Adolescents
Mammal (cow, horse)
Without angles
(circle, oval) Right
Young Mammal
(cow, horse)
Without angles
(circle, oval) Left
Bird (chicken, goose)
With angles
(square, rectangle) Right
Bird (chicken, goose)
With angles
(square, rectangle) Left
Bird (chicken, goose)
Without angles
(circle, oval) Right Adults
Bird (chicken, goose)
Without angles
(circle, oval) Left Elderly
1 The best performer thus earned € 25.52, the worst performer earned € 14.32. The average and median compensation were € 18.62 and € 18.08, respectively.
2 The features needed be as neutral as possible. In a previous experiment (Novarese and Rizzello 2006), the
employment of bright/dark colours and large/small sizes may explain why the subjects associated certain features with value judgements (i.e. insufficient to excellent). Here we also tested the features to ensure neutrality.
7
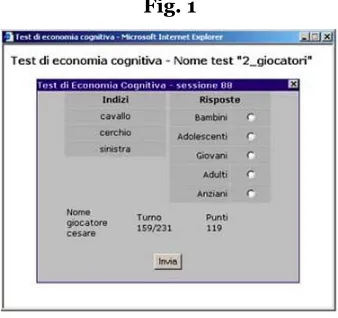
Fig. 1
At the end of each turn, subjects were given full feedback (FIG. 2). The score was calculated
with respect to the distance between the answer given an the correct answer: the distance
is 0 when the answer is correct and in this case the score is 6, the distance is 1 when the
answer given is one membership category above or below the correct answer (e.g.
Children/Adolescent, Elderly/Adults) and in this case the score is 4, etc.
Fig. 2
RESULTS
Earlier articles that investigated experiments such as the present one (Novarese and
Rizzello 2007, Lanteri and Novarese 2007) reveal a clear result: memorization does not
explain individual performance (nor did we expect this to be the case on the basis of our
background literature). There are so many sequences, which change with such frequency,
that memorization is not cognitively speaking an option for the participants. It is both
more natural and more efficient to develop actual theories about the experimental world
that result in the repetition of choices consistent with these theories, both when they are
correct and when they are wrong (because the revision of some theory is time consuming).
Participants progress from random choices at the beginning towards more stable
(and therefore predictable) ones, based on a limited number of elements of the sequence –
[image:8.595.226.369.367.504.2]8
on to a more complete and sophisticated representation of the experimental environment.
The responses of each participant thus become ever more predictable, so that, given a
sequence, we may forecast his responses with increasing accuracy. This is because, on the
one hand, the number of correct answers increases, but so do the number of repeated
mistakes. In the coming paragraphs we explain these trends.
The development of theories
When a participant gives several times the correct answer to a sequence, she must have
understood the exact working of that portion of the experiment. If she often gives wrong
answers, perhaps she has not yet uncovered the principle of that sequence. However, if the
wrong answer is consistently the same, it is very likely that the participant has developed a
mistaken theory.
In this section we study this phenomenon. Since it is possible that theories change
over the experiment, as participants learn, we require that the repetitions occur at least for
a period of time, and specifically for a third of the overall experiment, which gives us three
phases: turns 1-77, 78-154, and 155-231. We only focus on the stable (which allows us to
plausibly assume that it is principled, too) association of an answer with a sequence,
therefore we only consider responses given 75% of the times. Any answer given to a
sequence which only appears once would be given 100% of the times. This, however, does
not seem enough to assume stability of behaviour. Instead, we require that a sequence has
appeared at least four times during the experiment (but on average they appear ten times)
and at least three times in each phase.
Participants indeed develop stable associations between sequences and responses,
just like we expected. The number of theories that qualify for our analysis increases from
130 in the first phase to 235 in the third and they also become increasingly accurate going
from a 56% rate of correct answers in the first phase, up to 67% in the third. Although
participants get better and better, the number of stably mistaken theories is astonishing:
31% in the first phase and 42% in the third. Note that, though our condition was that
answers were given 75% of the time, we have numerous observations with a 100%
frequency. But only 57% of these were correct, while 43% were wrong.
How can this happen? Don‟t participants see their answers are wrong and change them accordingly? They do, but the reception, processing, and implementation of the
9
The limited effect of feedback
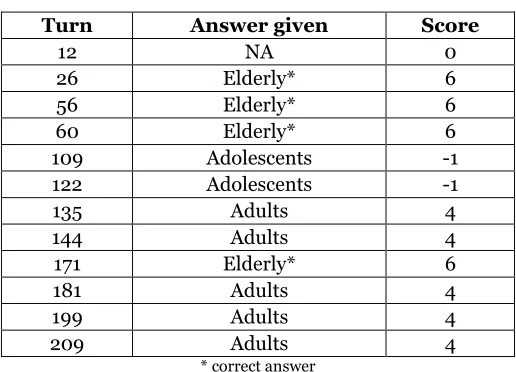
TAB. 2 reports the answers a typical participant gave to the sequence Chicken-Oval-Left,
[image:10.595.169.427.156.342.2]whose correct answer is Elderly.
Table 2 –Response to Chicken-Oval-Left by one Participant
Turn Answer given Score
12 NA 0
26 Elderly* 6
56 Elderly* 6
60 Elderly* 6
109 Adolescents -1
122 Adolescents -1
135 Adults 4
144 Adults 4
171 Elderly* 6
181 Adults 4
199 Adults 4
209 Adults 4
* correct answer
On turn 12, the participant skips the answer, she observes feedback and on turn 26
he or she responds correctly. Also, she probably does so with some reason and not at
random, provided that she repeats the correct answer on turns 56, and 60. One would then
imagine that this participant grasped the criterion and is going to consistently give the
correct answer from then on. Wrong. On turn 109, the participant switched to a mistaken
response, and then repeats it on turn 122. Her theory was probably undergoing some
revisions. But the feedback warned her against that response. Indeed, she abandons the mistake and… makes a different one! Although this mistake is less severe score-wise, she repeats it a few turns later and, after a single correct response on turn 171, from turn 181
until the end of the game she keeps repeating the mistake.
For the sequence under investigation, this participant incurs in a total of eight
mistakes (including the missing answer on turn 12). Seven of these mistakes could be
repeated (on turn 209 the mistake cannot be repetad because it‟s the last turn with this
sequence). We consider repeated an error if the same wrong answer is given in two
following appearance of the given sequence. This player repeats four times the same error .
We can compute a mistake confirmation rate for this sequence (four on seven, that is 57%)
and a mean overall value, for a given player during all the game. The mean value of this
index for all player is 33%4.
4 For 20 out of 23 participants, we can reject the hypothesis that this happened by chance with a 90%
10
The trend of this phenomenon, moreover, is counterintuitive: the number of
confirmed mistakes increases, instead of decreasing: it is 27% on average in the first part of
the experiment and 37% in the last part. It is possible to demonstrate that this results can
hardly be the effect of random choices. Players are building theories and representation of
this world. These theories are often based on simplification and on reduced use of available
[image:11.595.95.542.232.678.2]information, as Table 3 shows.
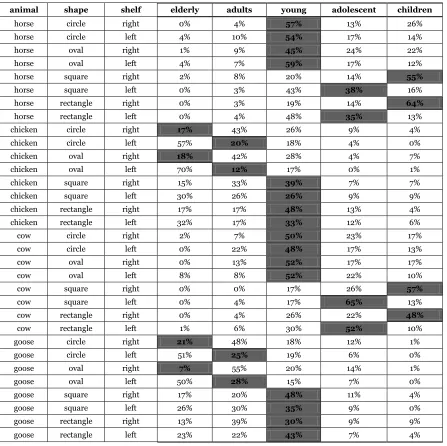
Table 3 – Distribution of Responses, Turns 154-231
animal shape shelf elderly adults young adolescent children
horse circle right 0% 4% 57% 13% 26% horse circle left 4% 10% 54% 17% 14% horse oval right 1% 9% 45% 24% 22% horse oval left 4% 7% 59% 17% 12% horse square right 2% 8% 20% 14% 55%
horse square left 0% 3% 43% 38% 16% horse rectangle right 0% 3% 19% 14% 64%
horse rectangle left 0% 4% 48% 35% 13% chicken circle right 17% 43% 26% 9% 4% chicken circle left 57% 20% 18% 4% 0% chicken oval right 18% 42% 28% 4% 7% chicken oval left 70% 12% 17% 0% 1% chicken square right 15% 33% 39% 7% 7% chicken square left 30% 26% 26% 9% 9% chicken rectangle right 17% 17% 48% 13% 4% chicken rectangle left 32% 17% 33% 12% 6% cow circle right 2% 7% 50% 23% 17% cow circle left 0% 22% 48% 17% 13% cow oval right 0% 13% 52% 17% 17%
cow oval left 8% 8% 52% 22% 10%
cow square right 0% 0% 17% 26% 57%
cow square left 0% 4% 17% 65% 13% cow rectangle right 0% 4% 26% 22% 48%
cow rectangle left 1% 6% 30% 52% 10% goose circle right 21% 48% 18% 12% 1% goose circle left 51% 25% 19% 6% 0% goose oval right 7% 55% 20% 14% 1% goose oval left 50% 28% 15% 7% 0% goose square right 17% 20% 48% 11% 4% goose square left 26% 30% 35% 9% 0% goose rectangle right 13% 39% 30% 9% 9% goose rectangle left 23% 22% 43% 7% 4%
Even mistaken answers are not given at random. Participants indeed employ (imperfect,
incomplete, shifting) theories of the experimental world, so that even their mistakes
become predictable.
11
and Adolescents is indifferent and the same happens for the answers Elderly and Children:
both mistakes have the same distance from the correct answer and therefore results in the
same score. There should thus be no specific reason to expect that, when the correct
answer is Young, mistakes be not random. However, we observe that the mistakes are strongly clustered in an „almost-correct‟ direction: when the Animal is a Mammal, the mistakes group around the two youngest membership categories, while the vice versa is
true for Birds5. This tendency may be explained by the fact that at least some of the
participants disregard the second piece of information, i.e. Shape, for at least some of the
sequences.
These observations serve as starting point for the analysis of the relationship
between entropy and performance.
Performance and predictability
It is our goal in this article to analyse not performance itself, or best strategies, but
learning6. In order to do so we divided the game in periods. Each period has a duration of
58 turns. The first period goes from turn 1 to turn 58, the second from turn 2 to 59, and so
on. This way we obtain 175 periods, largely overlapping.
For each period, we compute:
(i) the score of each player; and
(ii) the behavioural entropy for each animal-shape-shelf sequence which appears at
least 3 times.
(i) is an indication of performance, which we could substitute e.g. with the number of
correct answers, while (ii) measures the stability of mistaken responses. We then calculate
an average for each participant. This way, we obtain two figures per player for each period.
In each period, on the data of all our subjects, we can measure how these two values are
related. The simpler measure of linear relation is the correlation coefficient which indicate
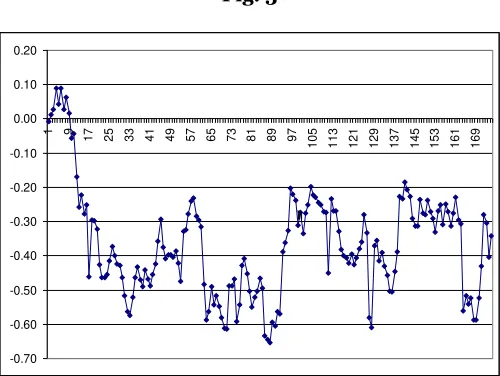
if there is a linear relation between two variables7. FIG. 3 shows the evolution of this value.
5 This is especially puzzling because, in reason of the score system, the most reliable option is always Young,
which cannot be farther than two steps from any membership category and therefore always afford positive score.
6 For deeper analysis of this experimental dataset, see Lanteri and Novarese (2007).
7 The correlation coefficient can assume all values in the range between -1 and 1. It has negative values when
12
Fig. 3
-0.70 -0.60 -0.50 -0.40 -0.30 -0.20 -0.10 0.00 0.10 0.20
1 9
17 25 33 41 49 57 65 73 81 89 97
105 113 121 129 137 145 153 161 169
ììì
Except for a brief time at the beginning, correlations are systematically negative (in 97 out
of 175 cases the values are significantly different from 0), which means that the
participants who perform best in that part of the game also have lower entropy. This result,
on which we shall comment further below, is not trivial.
The irregular trend depends in some measure on technical factors: the sequences
appearing on each period differ. During some periods there are several sequences which
were clearly understood by the participants. This, obviously, reduces the number of
mistakes and makes the correlation lower and less significant8. Since the values remain
negative despite this problem, on the other hand, the results are especially robust. This can
[image:13.595.234.360.533.607.2]also be confirmed by means of a different analysis.
Table 4 –Best’s low entropy, By Period Cluster
1 24
2 35
3 22
4 16
Table 5 –Best’s low entropy, By Period Cluster
1 15
2 31
3 32
4 26
8 Like other indexes, ours is most meaningful when computed on a sufficiently varied sample. If all
13
Consider now the participants who performed best in the last period and who, presumably,
best understood the working of the experimental world. Call Best those who scored above the median and Worst the others. The Best have lower entropy in 159 out of 175 periods, of these 104 were statistically significant with the Kruskal Wallis test and were distributed
across the clusters as in TAB. 4. Here, again, some of the periods do not yield meaningful
results, because the Best perform so well that few mistakes in a single sequence crucially alter the index.
The same comparison for the overall experiment (which is a more relevant and
robust index) reported in TAB. 5 reveals that the Best have an average mistake entropy of .23, versus .33 for the Worst (statistically significant both with the t-test and the Kruskal Wallis). The overall correlation between entropy and score is - .83 (significantly different
from 0 at the 99% confidence interval).
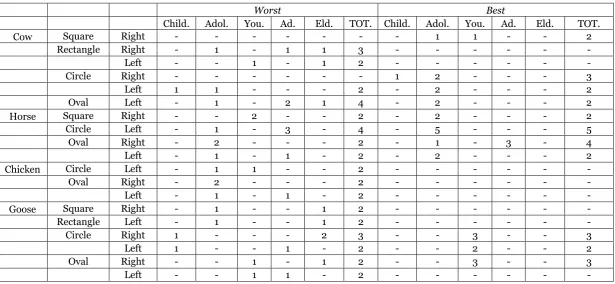
We can show what does this pattern represent in a very intuitive fashion, by means of TAB.
6, which compares the behaviour of one of the Worst and one of the Best players. For each sequence in which the players made at least two mistakes in the period between turn 59
and 117, we calculate the frequency distribution of responses. It is quite evident – even
without sophisticated indexes – that the worse player tends to have more heterogeneous
mistakes, with many wrong answers only given once. The better player, on the other hand,
tends to concentrate her mistakes on few sequences. Not only the mistakes are less
numerous, but they are also more regular. The same results can be found throughout the
experiment and for all players. In the very last turns, however, the Best players have so few mistakes that the comparison is meaningless.
Generally speaking, therefore, it seems that the capacity to give correct answers is
associated with stable behaviour even with respect to mistakes, which is an indication of a
tendency to apply rules even if these rules are wrong. On the other hand, the direction of
causality is not clear, because both can in principle explain each other. Indeed, since this
phenomenon can be observed very early in the game, but it is stronger in the central part
of the experiment, and since it is larger for the Best group, suggests two interpretations. * The participants who develop the most correct rules tend to apply rules even when they
are not correct. In this case we imagine that people employ analogical reasoning and apply some „default‟ or „reliable‟ rule when they lack a context-specific rule.
* It is also plausible that the individual capacity or tendency to focus on some variables and
the disregard of other variables (which produces steady behaviour and little entropy)
14
Table 6 –Players’ Comparison
Worst Best
Child. Adol. You. Ad. Eld. TOT. Child. Adol. You. Ad. Eld. TOT.
Cow Square Right - - - 1 1 - - 2
Rectangle Right - 1 - 1 1 3 - - - -
Left - - 1 - 1 2 - - - -
Circle Right - - - 1 2 - - - 3
Left 1 1 - - - 2 - 2 - - - 2
Oval Left - 1 - 2 1 4 - 2 - - - 2
Horse Square Right - - 2 - - 2 - 2 - - - 2
Circle Left - 1 - 3 - 4 - 5 - - - 5
Oval Right - 2 - - - 2 - 1 - 3 - 4
Left - 1 - 1 - 2 - 2 - - - 2
Chicken Circle Left - 1 1 - - 2 - - - -
Oval Right - 2 - - - 2 - - - -
Left - 1 - 1 - 2 - - - -
Goose Square Right - 1 - - 1 2 - - - -
Rectangle Left - 1 - - 1 2 - - - -
Circle Right 1 - - - 2 3 - - 3 - - 3
Left 1 - - 1 - 2 - - 2 - - 2
Oval Right - - 1 - 1 2 - - 3 - - 3
It is not straightforward to understand whether the repetition of mistakes is caused
by or is responsible for the high score. The observation that the participants who perform
best at the end of (but not necessarily throughout) the experiment also have low entropy all
along the game (and even at the beginning) suggests that it is the low entropy that favours
a superior understanding of the experimental world. A deeper understanding of this issue
is central to uncovering actual learning processes. Moreover, it may prove an important
element towards defining better training and teaching techniques.
We may test this idea as follows. Consider the correlation between entropy in a
period and score in an earlier period (e.g. 25 periods earlier). If low entropy is responsible
for high score, which would mean that participants employ whatever rules they have learnt
when lacking a better rule, this time-lagged correlation will be stronger than the normal
correlation. Before they may apply a rule, participants ought to develop and work it out.
Therefore a low observed entropy in a given turn should be a consequence of the correct
answers given earlier in the experiment. In other words, under this hypothesis, if people do
export to similar contexts the rules they have learnt in some decision contexts, there
should be a slight delay in the correlation between high score and low entropy.
To study this phenomenon, we investigate to what extent does entropy in a given
period depends on the score of the same period and how much does it depend on that of an
earlier period. We confine the most technical parts of our analysis to the Appendix for the
readers willing to dig deeper in the matter. Suffice it to say here that the correlation is
highest between entropy and current score than with score of periods which started 12, 25,
or 35 turns earlier. In fact, the effect of time-lagged score is opposite to what we expect:
those who scored the most in previous turns have higher entropy. One plausible
explanation for this pattern is that the participants who have found some simple strategies
to respond, then try to elaborate on those by means of trial-and-error, therefore their
behaviour is less stable (see also Lanteri and Novarese 2007).
CONCLUDING REMARKS
The conclusions above, though perhaps not final, reinforce the two-headed interpretation.
If the lower entropy of the best performing players depended on the application of past
rules in the present, the effect of time-lagged score should be stronger. The fact that it is
weaker suggests instead that best players tend to generalise rules, therefore reducing the
participants, but a decision context like that of our experiment certainly favours those for
which the tendency is strongest.
The two procedures: <export rules beyond their context> (or analogical
decision-making or learning spillover) and <reduce the amount of information employed> are not
mutually exclusive. It is nonetheless better to keep them separated because they are
conceptually distinct and both may prove either useful or dangerous.
Analogical problem-solving, on the other hand, amounts to a selective use of the
information because it amounts to treating as identical or similar, two situations which
differ in a number of respects. It is natural way of reasoning (Novarese, 2012), but also a
strategy suggested by George Polya in How to Solve It, which can be described as perfectly rational. „Do you know a related problem?‟ is one of the first questions the Polya lists in his strategy to solve any problem, elaborating on a method derived from mathematical theory. The first step to devise a plan is to “ask these questions: „Have you seen it before? Or have you seen the same problem in a slightly different form?‟” (p. xvi).
On the other hand, the reduction of employed variables is part and parcel of
theorisation: it is the very core of ceteris paribus. In order to investigate the effect of one variable, every other variable is excluded from the analysis by being held (or assumed)
constant. Our best chances at understanding the effect of a variable is to investigate it in
isolation.
More generally we may advance the following suggestion. Though we may not yet
say for what specific reason, a high score is associated with low entropy for mistakes and
therefore with a tendency to repeat mistakes over and over. Though the repetition of
mistakes might be considered a failure to properly employ feedback or a bias, it may
REFERENCES
ALCHIAN, A. (1950). “Uncertainty, Evolution, and Economic Theory”. Journal of Political Economy, 58: 211-221.
ARTHUR, W. B. (1992). “On Learning and Adaptation in the Economy”. Santa Fe Institute Working Paper 92-07-038.
BANDURA, A. (1977). Social Learning Theory. Englewood Cliffs, NJ: Prentice-Hall.
BEST, J. (1990). “Knowledge Acquisition and Strategic Action in „Mastermind‟ problems”.
Memory & Cognition, 18 (1): 54-64.
BRUNER, J., GOODNOW, J., and AUSTIN, G. (1956). A Study of Thinking. New York, NY: Norton.
HAYEK, F. (1952). The Sensory Order: An Inquiry into the Foundations of Theoretical Psychology. Chicago, IL: The University of Chicago Press.
HEINER, R. A. (1983). “The Origin of Predictable Behavior”. American Economic Review, 73 (4): 560-595.
HEINER, R. A. (1985). “Origin of Predictable Behavior: Further Modelling and Applications”. American Economic Review, 75 (2): 391-396.
LAKOFF, G., and JOHNSON, M. (1981). Metaphors We Live By. Chicago, IL: The University of Chicago Press.
LANTERI, A., and NOVARESE, M. (2007). “Individual Learning: Theory Formation and Feedback in a Complex Task”. MPRA Paper 3049.
MARCET, A., and SARGENT, T. (1989). “Convergence of least squares learning mechanisms in
self referential linear stochastic models”. Journal of Economic Theory, 48: 337-68.
NELSON, R. (2007). “Bounded Rationality, Cognitive Maps, and Trial and Error Learning”.
Journal of Economic Behaviour and Organization.
NOVARESE M. (2012), “Individual Learning” in Encyclopedia of the Sciences of Learning,
Springer, forthcoming
NOVARESE, M., and RIZZELLO, S. (2006). “A Cognitive Approach to Individual Learning: Some Experimental Results”, in: Arena, R. and A. Festrè (eds.) Knowledge and Beliefs in Economics. Aldershot: Edward Elgar. pp. 203-219.
POLYA, G. (1957). How to Solve It. Princeton: Princeton University Press.
ROTH, A., and EREV, I. (1998). “Predicting how People Play Games: Reinforcement Learning in Experimental Games with Unique, Mixed Strategy Equilibria”. American Economic Review, 88 (4): 848-881.
SIMON, H.A. (1976). “From Substantive to Procedural Rationality”, in: S. Latsis (ed.)
Method and Appraisal in Economics. Cambridge: Cambridge University Press. pp. 129-148.
SIMON, H.A. (1983). Reason in Human Affairs. Stanford: Stanford University Press.
VROMEN, J. J. (1995). Economic Evolution: An Enquiry into the Foundations of New Institutional Economics. London: Routledge.
WITT, U. (2000). “Social Cognitive Learning and Group Selection. A Game-Theoretic Version of Hayek‟s Societal Evolution”, presented at the INEM-ASSA Session
Appendix A - Instructions
In what follows we report the instructions of the game you will take part in. You will be
compensated with real money (40 ITL per point).
The Game
An association has different membership categories which pay different fees and have
access to different services. The categories are:
- children
- adolescents
- young
- adults
- elderly
Children and adolescents do not pay. Young pay a reduced fee. Adults and Elderly pay the
full fee. Members‟ information are recorded on a set of cards, stored on different shelves.
Each card is characterized by:
- the drawing of an animal
- the drawing of a shape
- a shelf
(e.g. A card might have the drawing of a cow and a square, and be placed on the
right shelf.)
You do not know the classification system and thus which cards corresponds to which
category. The goal of the game is to understand this correspondence.
The game lasts 231 turns. In each turn you will be shown the information from one card, so
you will see information about:
- animal
- shape
Based on this information you shall indicate the correct membership category, keeping in
mind that:
- there is a logical relationship between the information and membership categories
- the relationship is constant throughout the game
- the relationship is completely artificial (therefore it is neither necessary nor useful
to have experience of actual filing systems or any other specialised knowledge)
Obviously, the earliest answers will be given at random.
Each turn, therefore, the game will take place in the following way:
1- You see the information;
2- You give your answer (note: you must choose within 10 seconds, after this time
the system proceeds to the next turn);
3- You are told the correct answer and your score in the last turn.
4- You move on to the next turn and you start again.
During the game you are not allowed to talk, nor to take notes
The Score
In order to calculate the score we define the distance between the answer you gave and the
correct answer, as follows:
- if the answer is correct, the distance is 0 and you score +6;
- if the answer given is children and the correct answer is elderly (or vice versa), the
distance is highest: 4 and you score -4;
- if the answer given is children and the correct answer is adult (or vice versa), or if
the answer given is adolescents and the correct answer is elderly (or vice versa), the
distance is 3 and you score -1;
- if the answer given is children and the correct answer is young (or vice versa), if
the answer given is adolescent and the correct answer is adult (or vice versa), or if
the answer given is young and the correct answer is elderly (or vice versa), the
distance is 2 and you score +1;
- if the answer given is children and the correct answer is adolescents (or vice versa),
if the answer given is adolescent and the correct answer is young (or vice versa), if
answer given is adults and the correct answer is elderly (or vice versa), the distance
is 1 and you score +4;
- if you do not answer, you score 0.
Game dynamics
Each turn of the game can be divided into two parts.
The first part requires that you choose one of the five alternatives offered, by means of selecting the corresponding button and then “Enter”.
It is important that you complete these operations within 10 seconds because, when such time has elapsed, the system moves on with the test and it records “No Answer” corresponding to zero points.
After you made your choice, or after 10 seconds, you move on to the second part of the
turn.
The screen will report the outcome of the present turn. It reminds you the choice you
made, the correct answer, and your score for this turn. The window stays open for 6
Appendix B - Time-lagged Score and Entropy
FIG. 4 compares the correlations (after period 26). The values do not differ too much.
Generally speaking, the correlation between entropy and time-lagged score has values
closer to 0 and these values are less significant than the correlation between entropy and
simultaneous score (79 vs. 91 values are significantly different from 0).
To assess more precisely the influence of simultaneous score compared with the
time-lagged one, we shall employ a linear regression analysis, in which entropy is the
dependent variable. The two scores are used as independent variables so to measure their
[image:23.595.156.435.314.467.2]joint effect and compare their relative strength.
[image:23.595.56.556.511.660.2]Fig. 4
Table 7 – Score and Entropy (Time-lag 25)
TIME-LAG SCORE 25
not significant significant Tot.
- + - +
SCORE
not significant - 56 47 103
+ 21 1 22
significant - 1 16 8 25
+ 0 0 0 0 0
Tot. 78 63 1 8 150
In most periods the correlation is not significant. It is sometimes significant, but neither
independent variable is individually significant (this is also because of the correlation
between time-lagged and simultaneous score). The sign of the variables SCORE and
TIME-LAG SCORE are nonetheless noteworthy. TAB. 7 does this and it also distinguishes the
variable is negative in 128 cases out of 150 and it is significant in 25 of these. The
TIME-LAG SCORE variable is significantly different from 0 in just 9 cases, in 8 of which it has
positive sign. Out of 150 repetitions, it is positive 71 times.
We can thus make some inferences.
* The effect of simultaneous score is stronger and it is negative.
* The effect of time-lagged score is less strong. Perhaps during some periods it reinforces
the other effect, but with an opposite sign: for a given score in a period, a higher the
time-lagged score is associated with higher entropy for mistaken answers. During such periods,
the players who previously performed better have higher entropy, possibly because they
are confident with some portions of the solution and are more inclined to try and
[image:24.595.56.555.336.482.2]understand the remaining portions.
Table 8 – Score and Entropy (Time-lag 12)
TIME-LAG SCORE 12
not significant significant
- + - +
SCORE
not significant - 63 50 113
+ 32 2 34
significant - 6 10 16
+ 0
Tot. 95 56 2 10 163
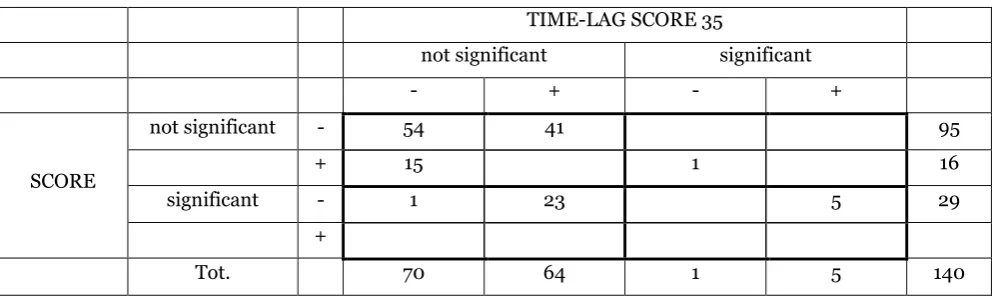
Table 9 – Score and Entropy (Time-lag 35)
TIME-LAG SCORE 35
not significant significant
- + - +
SCORE
not significant - 54 41 95
+ 15 1 16
significant - 1 23 5 29
+
Tot. 70 64 1 5 140
The time-lag we use is obviously arbitrary, but we employ two more time-lags, 12 and 35
periods, to test the robustness of our inferences. In this former case (TAB. 8), there are
fewer significant cases, but the other conclusions hold. In the latter case (TAB. 9), despite a
[image:24.595.57.555.524.672.2]cases grow. The interpretation does not change and TIME-LAG SCORE is ever less
significant and with a positive sign.
The larger the time-lag, therefore, the less significant is time-lagged score (and with
a positive sign), but the more significant the simultaneous score (and with a negative sign)
also because the correlation between the two is reduced and the estimates are more