Content based Image Retrieval using SVM-ID3
Maneela Jain
LNCT, Bhopal
Pushpendra Singh Tomar
Asst. Professor, LNCT, Bhopal
Manish Shrivastava
, PhD HOD,LNCT, Bhopal
ABSTRACT
Content-based image retrieval (CBIR) systems aim to return the most relevant images in a database, according to the user’s opinion for a given query. Due to the dynamic nature of the problem, this may change the meaning of relevance among users for a same query. In this ID3 (Decision Tree) based support vector machine (SVM) method proposed to retrieve several features and shorten the semantic gap between low-level visual feature and high-low-level perception. The analysis of the proposed work is done using MATLAB 2009a simulator.
Keywords:
CBIR, Decision tree, ID3, SVM, Semantic gap.
1.
INTRODUCTION
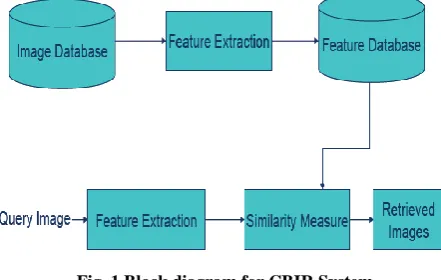
Image retrieval is a way for browsing, searching and retrieving images from a big database of digital images. Most of the conventional and common methods of image retrieval use some method of adding metadata such as captioning, keywords, or explanations to the images so that retrieval can be performed over the explanation words. Handbook image annotation is time-consuming, laborious and costly to address this there has been a large amount of research done on involuntary image explanation. Moreover, the increase in social web applications and the semantic web have inspired the development of several web-based image annotation tools. Content-based image retrieval (CBIR) has attracted much research interest in recent years [1]. In particular, there has been growing interest in indexing biomedical images by content [2]. Handbook indexing of images for content-based retrieval is bulky, error prone, and prohibitively costly [3]. Due to the lack of efficient automated methods, nevertheless, biomedical images are classically annotated manually and retrieved using a text keyword-based search. An ordinary drawback of such systems is that the annotations are imprecise with reference to image feature locations, and text is often insufficient in enabling efficient image retrieval. Even such retrieval is unfeasible for collections of images that have not been explained or indexed. Furthermore, the retrieval of interesting cases, particularly for medical education or building atlases, is a bulky task. CBIR methods developed specifically for biomedical images could present the solution to such problems, by this means augmenting the clinical, research, and educational features of biomedicine, designed for any class of biomedical images, on the contrary, it would be essential to grow suitable feature demonstration and similarity algorithms that capture the content‖ in the image. In the figure 1 illustrate the basic functioning process of the CBIR system. Where at first the input data desired as image format then it proceed for the training and extract feature of all images stored in the database. Similarly at parallel get the user query image and do the same feature extraction process and process it for the similarity matching.
[image:1.595.314.535.287.427.2]The rest part of this paper is organized as follows: Section 2 discussed about the literature review. Section 3 gives detailed description about CBIR. Section 4 described about the proposed methodologies. Section 5 shows the simulation result produced by the proposed algorithm and last section concluded the paper and its future work.
Fig. 1 Block diagram for CBIR System
2.
RELATED WORK
In earlier, there are so many algorithm has been developed for image retrieval. In this section literature of the related work is described which are developed by different author and researchers:
system. Support vector machine is used for classification and thereby to improve retrieval accuracy of the system [7]. A CBIR system based on a multi-scale geometric analysis (MGA) tool, called ripplet transform type-I (RT) have been presented by Chowdhury et al. [8]. Laplacian transform of the sharpened grey-scale image is statistically quantized into colour histogram bins in Malik and Baharudin [9].
3.
CONTENT BASED IMAGE
RETRIEVAL
A typical CBIR system automatically extract visual attributes (color, shape, texture and spatial information) of each image in the database based on its pixel values and stores them in to a different database within the system called feature database [10,11]. The feature data for each of the visual attributes of each image is very much smaller in size compared to the image data. The feature database contains an abstraction of the images in the image database; each image is represented by a compact representation of its contents like color, texture, shape and spatial information in the form of a fixed length real-valued multi-component feature vectors or signature. The users usually prepare query image and present to the system. The system automatically extract the visual attributes of the query image in the same mode as it does for each database image and then identifies images in the database whose feature vectors match those of the query image, and sorts the best similar objects according to their similarity value. During operation the system processes less compact feature vectors rather than the large size image data thus giving CBIR its cheap, fast and efficient advantage over text-based retrieval. CBIR classification can be used in one of the two modes. The first mode is exact image matching that is matching two images, one an example image and the other is image in image database. Second mode is approximate image matching which is finding most closely match images to a query image [12].
Basically CBIR used two approaches for retrieving the images from the image data base.
3.1
Two approaches
Text-based approach (Index images using keywords) Content-based approach (Index images using images)
3.1.1
Text-Based Approach:
Text based method used the keywords descriptions as a input and get the desired output in the form of similar types of images .Examples:- (Google, Lycos, etc.) but Text Based approach [12] have lots of disadvantages over its advantages.
3.1.1.1
Advantages: -
Easy to implement of Text based CBIR systems. Fast retrieval of output images compare to content
based approaches.
Web image search (surrounding text) like Google, Lycos etc.
3.1.1.2
Disadvantages:
Manual explanation is not always available. Manual explanation is impossible for a large DB. Manual explanation is not accurate.
A picture is worth a thousand words. Adjoining text may not explain the image.
3.1.2
Content-Based Approach:
Content based approach [12] using image as a input query and it generate the output of similar types of images.
3.1.2.1
Advantages
Visual features, such as color, texture, and shape information, of images are extracted automatically. Similarities of images are based on the distances
between features.
The CBIR is used in various applications such as medical diagnosis, security check, crime prevention etc.
4.
PROPOSED METHODOLOGY
In this section the discussion about SVM and proposed approaches and their steps followed at the classification time and in the next chapter will show the experimental result of the both two methods discussed here.
4.1
Overview of SVM
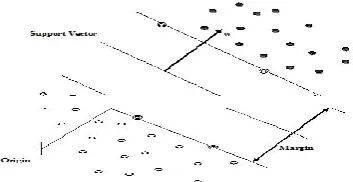
In machine learning there are two types of methods supervised and unsupervised. Supervised learning based on learn by result and unsupervised based on learn by example. Supervised learning takes input as a set of training data. Support vector machine is a supervised learning technique that analyzes data and identify pattern used for classification. It takes a set of input, read it and for each input desired output form [13] such type of process is known as classification, when if output is continuous than regression performed. For constructing maximum separating hyper-planes SVM maps input vector to a higher dimension feature space. Feature space refers to an input space which is reserved for measuring similarity with the help of kernel function. It is high dimension space where linear separation becomes very easier than input space [14]. In this, raw data is transformed into a fixed length sample vectors. There are two terms which are used in feature space i.e. called feature values and feature vectors. The characteristics of image is called feature values and these feature values presented the machine in a vectors is known as feature vectors. Kernel function used in the kernel method performing some operation such as classification, clustering upon different categories of data like text document, progression, vectors, group of points, image and graphs etc. it maps the input data into a higher dimension feature space because in this data could be easily separated or better structured [14]. There are some points in the feature space which are separated by some distance is called support vectors. It is the point among origin and that point and illustrate the position of the separator. The distance from the decision surface to the closet data point determines the margin the classifier.
Fig. 2 Linear separating hyper-planes for two class separation
[image:2.595.314.491.560.651.2]samples for expanding training set. However, the threshold is hard to decide and different queries need different thresholds. Here we propose a new method to append negative samples to the training set automatically and avoid the problem of threshold choosing. The steps can be described as follows:
1) Let Rt denote the result list ranked by similarity score after the tth feedback. There are M records in Rt, and each one is represented as Xi.
Rt = [xt1, xt2… xti… xtM]……… (1)
2) After image query, only top K results are displayed to the user, which is represented as Dt
Dt = [xt1, xt2… xti… xtK]………….... (2)
In addition, we define TSt as the training set.
TSt = TSt.P ᴗ TSt.N……… (3)
Where TSt.P denotes the subset of positive samples in TSt, and accordingly, TSt. N is the subset of negative samples in TSt. Now the user can select the positive samples from Dt and append them into TSt.P. The rest of Dt are put into TSt.N. TSt.P and TSt.N could be represented as (4) and (5).
TSt .P = TSt-1.P {positive samples in Dt}(4)
TSt .N = TSt -1.N {negative samples in Dt}……….. (4.2.5)
We define R as follows:
R= ………(5) Our experience indicates that when r is about 0.3, the SVM classifier obtains good performance. So our system will automatically supply additional negative samples into training set from the tail of Rt.
numT= ………(6) Where size(R) is the number of elements in set R. So the negative samples of training set are updated by (8).
…….(7)
4.2
Proposed Approach
Decision trees are a popular structure for supervised learning. There are various algorithms for constructing a decision tree like C4.5 and CART algorithm. The basic ID3 algorithm works well for limited number of records in data set and it cannot handle missing values and also when the data set size is increased the tree is not accustomed to the changes. The ID3 algorithm uses the entropy to select a splitting attribute and then construct the tree. There are some other algorithms that consider the gini index and gain ratio to select the splitting criterion and attribute.
The basic steps followed in ID3:
a) Choosing the splitting attribute. b) Ordering of the splitting attribute c) Splits
d) Tree structure e) Stopping criteria f) Training data g) Pruning.
For ID3 decision tree, concept used to quantify information is called entropy. Entropy is used to measure the amount of uncertainty in a set of data. A single class the entropy is zero that is there is no uncertainty. Given the probabilities:
p1, p2…pn where ∑i=1 n pi=1 ……… (8)
Entropy (I) is calculated as
I(p1, p2,…pn)= ∑i=1 n (pi log2(1/pi) …………..(9)
And information gain is calculated as
Gain (D, S) = I (pi) - ∑p (Di) I (Di) ……… (10)
Our current algorithm also makes use of gain values to construct the decision tree.
Weighted Minkowski distance formula is used here to measure distance and divergence among query image, Q and database image, I:
Applying Distance Formula
h
DBFi = ith feature of DB image
fQFi = ith feature of query image
Where M is the dimension of feature vector, wi is the weight of the ith feature component, DBfi and Qfi is the feature vector of images and query image respectively.
4.2.1
Algorithm Steps:
1. Input : Image dataset, Query image 2. Verify image dataset.
3. If available = false Then
Error Msg “ Insufficient image in database” Else
Features extract of all images stored in database {Color feature: color histogram, color moments………}
now stored it in M- dimensional feature vector DBFi
4. Query Image : Extract color feature of query image 5. Stored it in separate variable QF
{Used RGB color model to construct a feature vector}
6. Color co-occurrence matrixes of RGB generate. PRGB =[PRGBij]
7. Retrieved pixel information from previous step 8. To use all dimensions of CCM
9. Sum average value of row by column
{i, j are row and columns respectively} 10. Apply distance formula
h h DBFi = ith feature of DB image
11. Procedure_ID3Tree (DBF, QF, D)
{Calculate probability of each assumed class (P1, P2, P3…. Pn)
12. Calculate Entropy
E(P1,P2,….Pn)=
13. If DBF==NULL¦¦QF==NULL Then Build (DBF) and Build (QF)
14. IF (class value==QF) Then Return N as leaf node
Else { j=1;
15. For i=1:Size(DBF) {
16. IF DBFi! Classified Then //Compute Gain
17. Gain(D,QF)=E(Pi)-∑P(Di)E(Di) }
18. IF (Gain>0¦¦Gain> Maximum from Current State) Then
Generate Cj; {
//The current nodes divide into sub node and marked as Cj+1
19. Divide N into Nk and Expand every branch of Node N
} Else {
20. Current Node reject Return previous node }
21. FOR k= Size (N) //each branch Nk 22. Procedure_ID3Tree(N,QF,D) } //else end
} // end
YES
NO
YES NO
NO
Fig. 3 Flowchart for Proposed work
5.
EXPERIMENTAL RESULT
This section presents the simulation results implemented by the proposed method SVMID3 and the simulation is done using the best known simulator MATLAB 2009a and some reputed image dataset.
Feature Extraction Feature Extract
Stored in Database DBF
Stored in QBF
Calculate Entropy & Probability
IF QBFi = Classified?
E(Pi)= ∑ P(Di) E(Di)
Gain> Max?
Cj+1 Reject Current Node
Expand Branch Nk
If QBF= Position?
Stored Retrieved Result YES
5.1
Image Data Set
The coral image data set is very famous image data set for research purpose of image classification and retrieval, in this experimental data set they used 180 images which contain total 18 classes and each class have fixed 10 images from out of coral dataset of thousands images.
5.2
Result analysis of classified images
[image:5.595.331.524.69.214.2]Here in the figure 5.2.1 and figure 5.2.2 compare result with class 12 dinosaur images, class 12 is defined for dinosaur images in our database, where the accuracy measurement of SVM and SVMID3 are 60% and 100% respectively.
Figure 5.2.1 SVM methods for image class12
Figure 5.2.2 SVMID3 methods for image class12
Similarly I have tested both method in eighteen different classes, and next section summerized the all classes result.
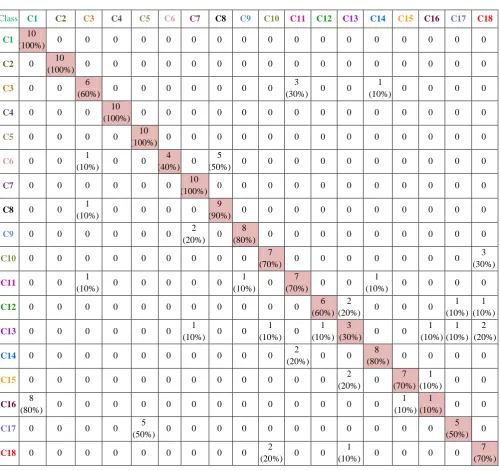
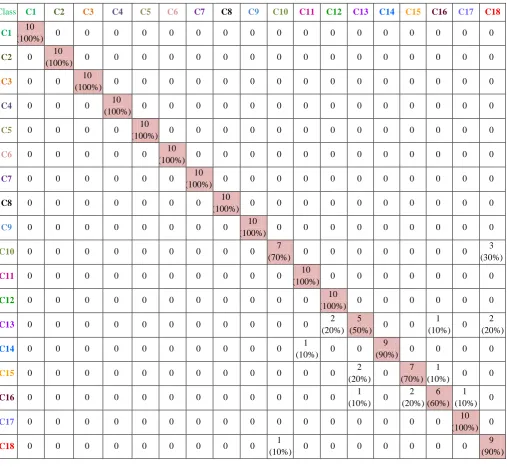
The result analysis of classified images based on compared two methods with retrieved images. The table 5.2.1 and table 5.2.2 shows that the detailed analysis of the both methods with the confusion matrix. The two confusion matrix is shown in table 5.2.1 and 5.2.2 respectively at the last pages, which shows the analysis of the SVM and SVMID3 methods respectively.
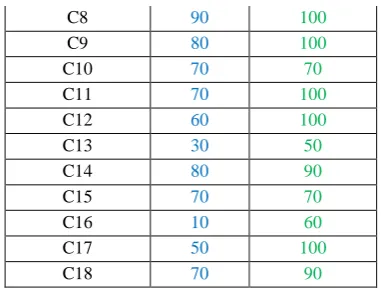
Table 5.2.3 Individual Class wise Accuracy
Class wise Accuracy
Image Class SVM SVMID3
C3 60 100
C6 40 100
C7 100 100
C8 90 100
C9 80 100
C10 70 70
C11 70 100
C12 60 100
C13 30 50
C14 80 90
C15 70 70
C16 10 60
C17 50 100
C18 70 90
Here table 5.2.3 shows that the individual comparative class wise accuracy of both method, where class taken randomly for retrieving the image classes. After that the figure 5.2.3 shows graph analysis of the individual classes accuracy of the both method, where SVMID3 shows the better result up to maximum instant when it compared with SVM method.
Figure 5.2.3: Individual class accuracies
[image:5.595.55.298.208.556.2]Here table 5.2.4 shows the overall accuracy of the both methods where the result is examined in the bases of 18 classes of the images. And finally produced the output where SVM method has overall 71.12 percentage and SVMID3 has overall 90.56 percentage accuracies. After that in the figure 5.2.4 its shows that the comparatitive graph analysis of the both method with the help of 3D bar graph.
Table 5.2.4 Overall Accuracy
Overall Accuracy SVM SVMID3 71.12 90.56 0
20 40 60 80 100 120
C3 C6 C7 C8 C9 C10 C11 C12 C13 C14 C15 C16 C17 C18 Individual Class Accuracy
[image:5.595.313.540.294.553.2] [image:5.595.75.264.698.765.2]
Figure5.2.4 Overall Accuracy
6.
CONCLUSION AND FUTURE SCOPE
A new hybrid approach to support vector machine with decision tree ID3 content-based image classification has been introduced. This technique combines an interactive support vector machine with an extended nearest-neighbor Approach using adaptive distances and gain measurement around several promising regions, instead of computing a single ranking. Although the proposed method has many components with corresponding parameters, the performance results proved to be relative insensitive to many of these. In classifier training, a sample expanding scheme is adopted to balance the proportion of positive Samples and negative samples. And then, ID3 scheme for multiple classifiers based on adaptive weighting is proposed to vote the final query results. The experimental results on coral image dataset show the effectiveness of the proposed scheme. In future Local search for retrieving images and introducing different forgathering policies to manage positive and negative information across iterations when concept drift occurs. In future work, the proposed method can improve and apply for the online web search, or huge datasets. The current method has some limitation such as when the level of tree increases then it’ll complicate for traversing. But if consider dataset like 1000 to 5000 then the efficiency of proposed method is more reliable and given fast result.
7.
REFERENCES
[1] Science, 2012, 5, 32-38 Published Online May 2012 in MECS (http://www.mecs-press.org/) DOI: 10.5815/ijitcs.2012.05.05
[2] K. Ashok Kumar & Y.V.Bhaskar Reddy, “Content Based Image Retrieval Using SVM Algorithm”, nternational Journal of Electrical and Electronics Engineering (IJEEE) ISSN (PRINT): 2231 – 5284, Vol-1, Iss-3, 2012
[3] V. Karpagam, and R. Rangarajan,” Improved content-based classification and retrieval of images using support vector machine”, CURRENT SCIENCE, VOL. 105, NO. 9, 10 NOVEMBER 2013.
[4] Science, 2012, 5, 32-38 Published Online May 2012 in MECS (http://www.mecs-press.org/) DOI: 10.5815/ijitcs.2012.05.05
[5] K. Ashok Kumar & Y.V.Bhaskar Reddy, “Content Based Image Retrieval Using SVM Algorithm”, international Journal of Electrical and Electronics
Engineering (IJEEE) ISSN (PRINT): 2231 – 5284, Vol-1, Iss-3, 2012
[6] V. Karpagam, and R. Rangarajan,” Improved content-based classification and retrieval of images using support vector machine”, CURRENT SCIENCE, VOL. 105, NO. 9, 10 NOVEMBER 2013
[7] Chowdhury, M., Das, S. and Kundu, M. K., Novel CBIR system based on ripplet transform using interactive neuro-fuzzy technique. Electron. Lett. Computer Vision Image Anal., 2012, 11, 1–13.
[8] Malik, F. and Baharudin, B. B., Feature analysis of quantized histogram color features for content-based image retrieval based on Laplacian filter. In International Conference on System Engineering and Modeling. IACSIT Press, Singapore, 2012, vol. 34.
[9] K. C. Sia and Irwin King. “Relevance feedback based on parameter estimation of target distribution” In IEEE International Joint Conference on Neural Networks, pages 1974–1979, 2002.
[10] Simon Tong and Edward Chang.” Support vector machine active learning for image retrieval. In MULTIMEDIA “in Proceedings of the ninth ACM international conference on Multimedia, pages 107– 118.2001.
[11] I. Felci Rajam, S. Valli:” A Survey on Content Based Image Retrieval” Life Sci J 2013; 10(2): 2475-2487]. (ISSN: 1097-8135). http://www.lifesciencesite.com 343
[12] Patheja P.S., Waoo Akhilesh A. and Maurya Jay Prakash, “An Enhanced Approach for Content Based Image Retrieval”, International Science Congress Association, Research Journal of Recent Sciences, ISSN 2277 – 2502 Vol. 1(ISC-2011), 415-418, 2012.
[13] Sandeep Kumar, Zeeshan Khan, Anuragjain, “A Review of Content Based Image Classification using Machine Learning Approach”, International Journal of Advanced Computer Research (ISSN (print): 2249-7277 ISSN (online): 2277-7970) Volume-2 Number-3 Issue-5 September-2012
[14] T. Jyothirmayi, Suresh Reddy, “An Algorithm for Better Decision Tree”, (IJCSE) International Journal on Computer Science and Engineering, Vol. 02, No. 09, 2010, 2827-2830.
[15] T. C. Wong, Medical Image Databases. New York, LLC: Springer–Verlag, 1998.
[16] A. Smeulder, M. Worring, S. Santini, A. Gupta, and R. Jain, ―Contentbased image retrieval at the end of the early years”, IEEE Trans. Pattern Anal. Machine Intell vol. 22, no. 12, pp. 1349–1380, Dec. 2000.
[17] Efficient Relevance Feedback for Content-Based Image Retrieval by Mining User Navigation Patterns -IEEE transactions on knowledge and data engineering, vol. 23, no. 3, march 2011.
[18] Monika Daga, Kamlesh Lakhwani, “A Novel Content Based Image Retrieval Implemented By NSA Of AIS”, International Journal Of Scientific & Technology Research Volume 2, Issue 7, July 2013 ISSN 2277-8616
[19] Tran Son Hai, Nguyen Thanh Thuy, “Image Classification using Support Vector Machine and Artificial Neural Network”, I.J. Information Technology and Computer.
0 20 40 60 80 100
SVM SVMID3 71.12
90.56
Acc
ura
cy
%
C* -> class
Class C1 C2 C3 C4 C5 C6 C7 C8 C9 C10 C11 C12 C13 C14 C15 C16 C17 C18
C1 10
(100%) 0 0 0 0 0 0 0 0 0 0 0 0 0 0 0 0 0
C2 0 10
(100%) 0 0 0 0 0 0 0 0 0 0 0 0 0 0 0 0
C3 0 0 6
(60%) 0 0 0 0 0 0 0
3
(30%) 0 0 1
(10%) 0 0 0 0
C4 0 0 0 10
(100%) 0 0 0 0 0 0 0 0 0 0 0 0 0 0
C5 0 0 0 0 10
(100%) 0 0 0 0 0 0 0 0 0 0 0 0 0
C6 0 0 1
(10%) 0 0 4 (40%) 0
5
(50%) 0 0 0 0 0 0 0 0 0 0
C7 0 0 0 0 0 0 10
(100%) 0 0 0 0 0 0 0 0 0 0 0
C8 0 0 1
(10%) 0 0 0 0
9
(90%) 0 0 0 0 0 0 0 0 0 0
C9 0 0 0 0 0 0 2
(20%) 0 8
(80%) 0 0 0 0 0 0 0 0 0
C10 0 0 0 0 0 0 0 0 0 7
(70%) 0 0 0 0 0 0 0
3 (30%)
C11 0 0 1
(10%) 0 0 0 0 0
1 (10%) 0
7
(70%) 0 0 1
(10%) 0 0 0 0
C12 0 0 0 0 0 0 0 0 0 0 0 6
(60%) 2
(20%) 0 0 0
1 (10%)
1 (10%)
C13 0 0 0 0 0 0 1
(10%) 0 0 1 (10%) 0
1 (10%)
3
(30%) 0 0 1 (10%)
1 (10%)
2 (20%)
C14 0 0 0 0 0 0 0 0 0 0 2
(20%) 0 0 8
(80%) 0 0 0 0
C15 0 0 0 0 0 0 0 0 0 0 0 0 2
(20%) 0 7 (70%)
1
(10%) 0 0
C16 8
(80%) 0 0 0 0 0 0 0 0 0 0 0 0 0
1 (10%)
1
(10%) 0 0
C17 0 0 0 0 5
(50%) 0 0 0 0 0 0 0 0 0 0 0
5 (50%) 0
C18 0 0 0 0 0 0 0 0 0 2
(20%) 0 0 1
(10%) 0 0 0 0
[image:7.595.49.550.91.562.2]C* -> class
Class C1 C2 C3 C4 C5 C6 C7 C8 C9 C10 C11 C12 C13 C14 C15 C16 C17 C18
C1 10
(100%) 0 0 0 0 0 0 0 0 0 0 0 0 0 0 0 0 0
C2 0 10
(100%) 0 0 0 0 0 0 0 0 0 0 0 0 0 0 0 0
C3 0 0 10
(100%) 0 0 0 0 0 0 0 0 0 0 0 0 0 0 0
C4 0 0 0 10
(100%) 0 0 0 0 0 0 0 0 0 0 0 0 0 0
C5 0 0 0 0 10
(100%) 0 0 0 0 0 0 0 0 0 0 0 0 0
C6 0 0 0 0 0 10
(100%) 0 0 0 0 0 0 0 0 0 0 0 0
C7 0 0 0 0 0 0 10
(100%) 0 0 0 0 0 0 0 0 0 0 0
C8 0 0 0 0 0 0 0 10
(100%) 0 0 0 0 0 0 0 0 0 0
C9 0 0 0 0 0 0 0 0 10
(100%) 0 0 0 0 0 0 0 0 0
C10 0 0 0 0 0 0 0 0 0 7
(70%) 0 0 0 0 0 0 0
3 (30%)
C11 0 0 0 0 0 0 0 0 0 0 10
(100%) 0 0 0 0 0 0 0
C12 0 0 0 0 0 0 0 0 0 0 0 10
(100%) 0 0 0 0 0 0
C13 0 0 0 0 0 0 0 0 0 0 0 2 (20%)
5
(50%) 0 0 1 (10%) 0
2 (20%)
C14 0 0 0 0 0 0 0 0 0 0 1
(10%) 0 0 9
(90%) 0 0 0 0
C15 0 0 0 0 0 0 0 0 0 0 0 0 2
(20%) 0 7 (70%)
1
(10%) 0 0
C16 0 0 0 0 0 0 0 0 0 0 0 0 1
(10%) 0 2 (20%)
6 (60%)
1 (10%) 0
C17 0 0 0 0 0 0 0 0 0 0 0 0 0 0 0 0 10
(100%) 0
C18 0 0 0 0 0 0 0 0 0 1
(10%) 0 0 0 0 0 0 0
[image:8.595.46.554.101.568.2]