Simulation of Active Power Factor
Correction Using Boost Type Converter
P.V.R.K.B.A.N.RAJU I.SUDHAKAR BABU Dr. G.V.SIVA KRISHNA RAO PG Scholar Research Scholar ProfessorDepartment of Electrical Engineering, ANDHRA UNIVERSITY College of Engineering (A) VISAKHAPATNAM.
Abstract- With the vast development in the usage
of Power electronic devices like Rectifiers (non-linear loads) the current drawn from the line is distorted resulting in a High Total Harmonic Distortion (THD) and Low Power Factor (PF). Hence there is a continuous need for Power factor improvement and reduction of line current harmonics. The most popular topology for Active PFC is a boost converter as it draws continuous input current. This input current can be manipulated by Average current mode (ACM) control technique. The design and simulation of boost converter with ACM in continuous conduction mode is represented in this paper.
Keywords- APFC, THD, Boost converter, ACM.
I. INTRODUCTION
Now a days there are many appliances that requires DC power supply. So for obtaining this DC power, an interface must be provided between AC line and the DC load. Generally this conversion process is done by single phase
diode rectifiers.
These converters rectify the input AC line voltage to obtain DC output voltage, but this DC voltage oscillates between zero to peak. To reduce this output ripple a filter capacitor is used, and that is where the problem of power factor and THD arises. The capacitor maintains the DC voltage at a constant value but it draws non sinusoidal current from the supply. The capacitor draws current from the
supply only at the line voltage peaks. So the input current becomes pulsating which results in poor power factor and high THD.
PFC is used as a positive method for improving the power quality. Essentially PFC can
eliminate harmonic source of rectifier devices, through input current waveform automatically with input voltage waveform of the grid, and get the former waveform as sine waveform and have the same waveform with voltage waveform on phase.
II. POWER FACTOR CORRECTION
TECHNIQUES
There are two types of power factor correction techniques
a) Passive power factor correction
Harmonic current can be controlled in the simplest way by using a filter that passes the current only at line frequency (50 or 60 Hz). Harmonic currents are suppressed and the non linear device looks like a linear load. Power factor can be improved by using capacitors and inductors. But the disadvantage is they require large value high current inductors which are expensive and bulky.
b) Active Power factor correction
An Active approach is the most effective way to correct power factor of electronic supplies. Here we place a boost converter between the bridge rectifier and the load. The converter tries to maintain a constant DC output bus voltage and draws a current that is in phase with and at the same frequency as the line voltage.
Advantages of boost APFC as follows: Active wave shaping of input current Filtering of the High frequency switching Feedback sensing of the source current for
waveform control
Feedback control to regulate output voltage
III. BOOST CONVERTER
The key principle that drives the boost converter is the tendency of an inductor to resist changes in the current. When being charged it acts as a load and absorbs energy (somewhat like a resistor); when being discharged it acts as an energy source (somewhat like a battery). The voltage it produces during the discharge phase is related to the rate of change of current, and not to the original charging voltage, thus allowing different input and output voltages.
The figure below shows boost converter.
Fig-1: Boost converter Continuous mode:
When a boost converter operates in continuous mode, the current through the inductor (IL) never falls to zero. Figure-2 shows the typical waveforms of currents and voltages in a converter operating in continuous mode. The output voltage can be calculated as follows, in the case of an ideal converter operating in steady conditions.
𝑉𝑜=1−𝐷𝑉𝑖𝑛 ... (1) When switch S is ON:
𝑑𝐼𝐿
𝑑𝑡 = 𝑉𝑖𝑛
𝐿 ... (2) Again when switch is OFF:
𝑑𝐼𝐿
𝑑𝑡 = 𝑉𝑜−𝑉𝑖𝑛
𝐿 ... (3) Here D is Duty cycle
Vin is the rectified input voltage and Vo is the output voltage.
The voltage and current waveforms are shown below.
Fig-2: voltage and current waveforms of boost converter.
IV. ACTIVE POWER FACTOR
CORRECTION CIRCUIT COMPONENT a) The fundamental Principle of APFC
In fact, APFC is meaning that the rectifier voltage which the input alternating-current (AC) signal is converted into direct-current (DC) voltage through the bridge diode and it is changed into the current signal by DC/DC converter with the proper control methods. So the current signal can auto track the voltage signal to get in phase. Figure 4 shows the fundamental principle frame of APFC.
Figure-3: The fundamental principle frame of APFC.
In figure 3 the error compared at the output and input signals is multiplied under time-multiplier operations and given to driving circuit to drive the DC/DC converter.
Control principle:
This converter provides a regulated DC output voltage under varying load and input voltage conditions. The converter component values are also changing with time,temperature and pressure. Hence, the control of the output voltage should be performed in a closed loopmanner using principles
of negative feedback. The two most common closed loop control methods for PWM dc-dc converters, namely voltage mode control and current mode control.
i) Voltage Mode Control
In this control mode converter output voltage is regulated and fedback through a resistive voltage divider. It is compared with a precision external reference voltage, Vref in a voltage error amplifier. The error amplifier produces a control voltage that is compared to a constant-amplitude saw tooth waveform. The comparator or the PWM modulator produces a PWM signal that is fed to drivers of controllable switches in the dc-dc converter. The duty ratio of the PWM signal depends on the value of the control voltage.
ii) Current Mode Control
There are different current mode control techniques to manipulate continuous input current obtained from the boost converter, however them average current mode control provides the best result. In average current mode control the switching frequency is constant and it allows a good input current waveform.
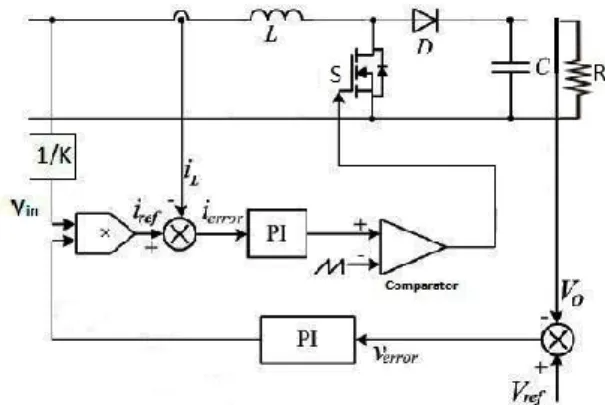
Here for average current mode control; voltage control loop and current control loop are used. Input current iL is compared with the reference current iref.
Figure-4: Current Mode Control
The current reference iref is obtained by scaling down the line voltage by a resistive divider with scaling factor K and multiplying with the actuating signal obtained at the output of, voltage PI controller. This actuating signal is obtained by comparing the output voltage with reference voltage and passing the voltage error verror through the voltage PI controller. The comparison of i1 and
iref gives the ierror which has been amplified by another PI controller, and compared with the sawtooth wave, and provides the PWM drive signal for the switch S. The PI controllers consist of a proportional gain that produces an output proportional to the input error and an integration to make the steady state error zero.
Figure 5 shows outline diagram of Average current mode control using PI controller.
Figure-5: Average current mode control using PI controller.
V. SIMULATION AND RESULTS
This paper involves simulation of basic power electronic circuits and the analysis of the current and voltage waveforms. It starts with simple circuits with a gradual increase in complexity by inclusion of new components and their subsequent effect on the current and voltage waveforms. We focus on the objective of improving the input current waveform i.e. making it sinusoidal by tuning the circuits. All the simulation work is done in MATLAB Simulink. a) Simulation and results for Conventional Converter
Figure 6: Conventional Rectifier
Figure 6 shows that this circuit consists of two group of diodes: Top group with diodes 1 and 3,
Bottom group with diodes 2 and 4. It is easy to see the operation of each group of diodes with Ls=0. The current Id flows continuously through one diode of the top group and one diode in the bottom group.
The circuit is simulated using Simulink and input waveforms are plotted in graph as shown in figure 7 and output waveforms are plotted in graph as shown in the figure 8.
Figure 7: Input voltage and current Waveforms
The input current waveform consists of Total Harmonic Distortion.
Figure 8: Output voltage (97V) without APFC
Figure-9: Power factor without APFC
It is clear from Figure 9 that the Power Factor is 0.795 which is very low and it needs to be improved by using proceeding method.
b) Simulation and Results for Rectifier circuit with APFC Boost converter
Boost converter is a DC-DC Converter which provides output voltage is greater than input voltage. Here, the inductor responds to changes in current by inducing its own voltage to counter the change in current, and this voltage adds to the source voltage while the switch is open. If a diode and capacitor combination is placed in parallel to the switch, the peak voltage can be stored on the capacitor, and the capacitor can be used as a DC source with an output voltage greater than the DC voltage driving the circuit.
Figure 10 shows the simulation of boost converter.
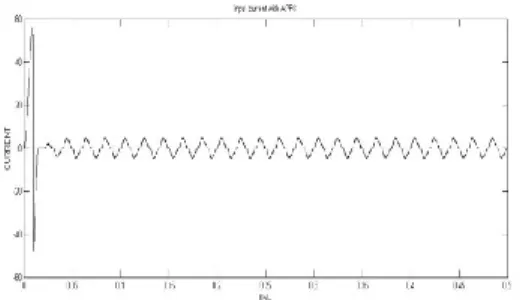
Figure 10: Simulation of Boost Converter Current mode control as usually implemented in switching power supplies actually senses and controls peak inductor current. This gives rise to many serious problems, including poor noise immunity, a need for slope compensation, and peak-to-average current errors which the inherently low current loop gain cannot correct. Average current mode control eliminates these problems and may be used effectively to control currents other than inductor current, allowing a much broader range of topological application. The circuit is simulated using Simulink and input waveforms are plotted in graph as shown in the figure 11 and output waveforms are plotted in graph as shown in the figure 12.
Figure 11: Input current waveform with Boost Converter.
Figure 12: Output voltage (197V) With Boost Converter
The figure 13 shows that the Power Factor is 0.975 which is improved from Conventional model.
Figure 13: Power factor with Boost converter VI. CONCLUSION
The Power Factor Correction with different converters are Simulated with MATLAB Simulink. In this paper conventional converter and Boost converter using Current Mode Control are discussed. It is noticed that the Power Factor is better for Boost converter Circuit. Also THD is minimised to an extent. This can be improved further using Dual Boost Converter with PI as well as FUZZY controllers.
REFERENCES
[1] Mohammad H Rashid, power electronics Handbook (Academic press, 2001).
[2] Wa Ma, Mingyu Wang, Shuxi Liu, Shan Li, and Peng Yu,
Stabilizing the Average-Current-Mode-Controlled Boost PFC Converter via Washout-Filter-Aided Method IEEE
Transactions on Circuits and Systems-II, Express Briefs,
vol. 58, no. 9, September 2011.
[3] Wang Zhaoan, Yang Jun, Liu Jinjun, Wang Yue, harmonics suppression and reactivepower compensation
(the second edition) [M]. China machine Press (CMP), 2009.
[4] Chen zhe, Boost APFC device design[J], Electrical technology, 1:pp 45-50, 2010.Jovanovic, M.M., Jang, Y., State-of-the-art, single-phase, active power factor-correction techniques for high-power applications - an overview, Industrial Electronics ,IEEE Transactions on Volume: 52, pp:701-708, 2005.
VRKBAN RAJU PINNAMARAJU was
born on April 29, 1987. He received the B.Tech., degree in Electrical and Electronics Engineering, from JNT University-Hyderabad, Telangana, India in 2008. He is currently pursuing Master of Engineering (M.E) degree with Specialization Power Systems and Automation in the Department of Electrical Engineering, AU College of Engineering, Andhra University, Andhra Pradesh, India.
I.SUDHAKAR BABU was born on August
05, 1985. He received the B.Tech., degree in Electrical and Electronics Engineering, from JNT University-Hyderabad, Telangana, India in 2008. He received M.Tech., degree from JNTU Kakinada. He is currently pursuing Ph.d degree in the Department of Electrical Engineering, AU College of Engineering, Andhra University, Andhra Pradesh, India.
Prof. Dr. G.V. Siva Krishna Rao was born
on June 15, 1970. He received the B.E., and M.Tech, degrees all in Electrical engineering, from Sri Venkateswara University Tirupathi, Andhra Pradesh and Ph.D degree from Andhra University Andhra Pradesh, India. Since 1994 he has been with the Department of Electrical Engineering, Andhra University, where he is currently a Professor. His research interests have been in Power Systems and Automation, Control Systems, EHVAC, and High Voltage Engineering and their industrial applications.