A Study on the application of Data Mining Methods in the analysis of
Transcripts
Luis Raunheitte*, Rubens de Camargo*, TAkato Kurihara*, Alan Heitokotter*, Juvenal J. Duarte* *School of Computer and Informatics (FCI) – Universidade Presibiteriana Mackenzie – São Paulo – SP -
Brasil
Abstract. Schools always had an essential role in the formation of students‟ intellect; however, the constant incorporation of knowledge to improve techniques and technologies used in the production of goods and services has caused a major demand for highly qualified professionals and, in order to meet that need, the teaching process must understand and adapt to the profile of the students. The transcript is the most used document to measure the performance of a student. Its digital storage combined with data mining methodologies can contribute not only to the analysis of performances, but also to the identification of significant information about student's profiles and deficiencies in the structure of a course. This study shows an example of the application of data mining techniques in transcripts, based on the real Computer Sciences course of Universidade Presbiteriana Mackenzie, and the use of the open source tool WEKA.
Introduction
One of the major challenges encountered by schools in several countries, mainly within the academic sphere, is to handle the difficulties of students during the learning process, which in many cases might result in the lack of motivation and even university drop-out. In this sense, better understanding the students and their characteristics is crucial for the application of pedagogical techniques with a specific focus, aiming at reaching optimum productivity during the learning process.
Since that up to recent times the storage of transcripts used to be made on paper and their analysis had to be manually processed, a deeper evaluation on these documents would be rejected and deemed unfeasible. However, the implementation of computer processing technology in several branches has been contributing to the increasing usage of digital data storage in view of the savings on material resources and space, as well as the ease of handling allowed by this format, which also foments environmental sustainability.
Data mining offers a method to benefit from the computer processing efficiency in the analysis of data with a view to search for tacit information [6]. Through data mining, it is possible to avoid massive data exploitation and to use the knowledge acquired by the interpretation of ascertained patterns.
The transcript represents a source of information that allows depicting not only the individual performance characteristics of students, but also their profiles, in addition to providing several details about the course at issue. Among the several potentials of data mining, it is possible to recognize distinct groups of students, distinguishing their difficulties and virtues; to evaluate academic disciplines that concentrate a greater need for efforts aiming at interlinking them; and to set forth right at the beginning the academic disciplines in which each student, in average, will face greatest challenges, as well as to establish secondary areas in the course through which the student will have more chances of achieving a successful career.
This article provides a practical example of the application of two data mining techniques in the analysis of transcripts: cluster analysis and classification. For that, there were used an open source tool named WEKA and a sample of actual data regarding the Computer Sciences course of Universidade Presbiteriana Mackenzie.
Knowledge Discovery In Database (KDD)
In the 80‟s, managers of major organizations started to be concerned about the volume of stored data and its uselessness for their purposes [1]. In tandem, as the market became increasingly dynamic and competitive, companies had to quickly make strategic decisions, even though this could imply potential risks [2]. Given this scenario, studies on data exploitation became more intense and, in 1989, the term Knowledge Discovery in Databases (KDD) was created by [4] with reference to the entire process of extraction of useful information from large data volumes [4]. Ever since, the entire KDD process arouses the interest of people both within the academic and the corporate spheres.
As opposed to data mining itself, KDD is a complex methodology with focus on the production of consistent and construable knowledge, comprising issues such as storage and access, development of efficient algorithms, visualization and interpretation of results and the way the user is able to interact with them [4].
The definition of KDD as a process composed of sequential steps is quite renowned and, in its essence, it comes down to the preparation of data, and mining and interpretation of the results.
The preparation is an elemental step for the success of a KDD project, insomuch that 80% of the efforts for understanding the data are focused on its cleansing and preparation [7]. There are three subjects that provide grounds for the importance of data preparation:
Real world data are impure like noise and manifested as errors which, when provided as an input to a mining algorithm, tend to spend the results acquired from reality, hiding relevant patterns or even compromising the credibility of ascertained patterns.
High performance mining applications require quality data.
Quality data produce quality patterns.
It is crucial for the representation of the results acquired in the search for patterns to be simple and construable. [8] base this need on the fact humans have the ability to analyze large amounts of information when such information is presented in a visually organized manner. Among the distinct data analysis methods, the majority derives from the statistics, and the graphic analysis is more specifically related to the branch of Exploratory Data Analysis (EDA), whose focus is precisely on visualization. Data mining is the step where artificial intelligence concepts are employed to provide resources for understanding the information being handled.
Data Mining
Data mining represents the most important step of the process of Knowledge Discovery in Database (KDD), as in this step the patterns are effectively exploited and analyzed. Once the data have been organized and their quality assured, mining is applicable with a view to extract their relevant patterns.
Under a simplified perspective, the goals of data mining might be resumed as prediction or description. When the purpose is prediction, the database is analyzed so that unknown values can be found or future ones predicted based on previously existing data. The most common examples of predictive methods are Classification, Regression and Analysis
of Time Series, which operate through supervised learning techniques. As to description, the goal is to find construable patterns that describe the input data, based on classic methods such as Cluster Analysis, Discovery of Association Rules and Sequential Pattern Analysis, which use non-supervised learning techniques [4], [3].
Classification, as the name suggests, consists basically of mapping a log back to existing predefined categories. A powerful but simple classification technique consists of building decision trees, which is accomplished through a series of questions carefully developed and focused on the training set [8]. When certain classes cannot be previously identified in a clear fashion, clusters provide a good alternative by identifying items that will naturally group together [6]. The analysis of clusters aims at analyzing a set of logs and dividing it so that the values of the elements within one group are more similar inwardly than as compared to other groups [9]. Clusters oftentimes indicate tacit data patterns.The WEKA (Waikato Environment for Knowledge Analysis) is a widespread open source tool that consists in the creation of a compilation with machine learning and data pre-processing algorithms, comprising interfaces for the operation of input data, statistical validation of learning schemes and visualization tools.
The WEKA environment gathers the most important data mining methods: Regression, Classification, Cluster Analysis, Association Rules and Attribute Selection.
Preparation Of The Data Used
The data used in this research were acquired through the General Office of Universidade Presbiteriana Mackenzie, São Paulo campus (where information secrecy has been ensured due to the fact that a numeric indication is used for each student without any reference to the records used for the control of their academic life). The pieces of information correspond to a sample of the historic records of grades and absences of Computer Science students, from the Computer Systems and Data Processing Faculty, in the period between the first semester of 1999 and the second semester of 2010.
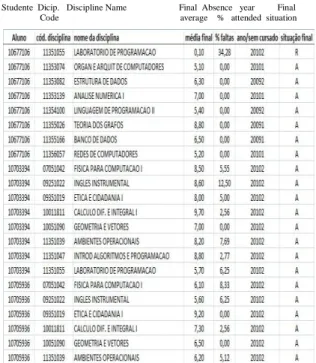
The records were found in an Excel spreadsheet, in the xlsx format, comprising the fields Student, Discipline Code, Name of the Academic discipline, Final Average, Absences, Year/Semester and Final Situation, as shown by Figure 1. The attributes Academic discipline Code and Name of the Academic discipline represent the discipline to which the grades are related, and Year/Semester is the attribute that indicates the period in which the student attended the classes. The final averages, absences and final situation are the target information and the patterns are analyzed according to these measures.
In addition to the spreadsheet, it was possible to acquire the description of the curricula on the page of the university and a definition of the theme areas of the academic disciplines from the course coordination. The description of the 1999 curriculum acquired from the website of the university is the most complete one, comprising code, name, stage and the total, theory and laboratory credit hours for each of the academic disciplines in the curriculum. For the 2004 curriculum, the same information is available, except for the code of the academic disciplines, which could be acquired through the Informative Academic Terminal (known as TIA). For the 2009 curriculum, the codes of the academic disciplines are also not present; however it shows all other attributes and the indication of the new academic disciplines regarding the previous curriculum. The most relevant data are the code of the academic discipline and the stage, through which it is possible to associate a discipline to a curriculum and the level that this discipline is taught; this information is not available in the original data. Studente Dicip. Discipline Name Final Absence year Final Code average % attended situation
FIGURE 1 Part of the data is provided in its original format
The document regarding the theme areas of the academic disciplines is based on the 2009 curriculum, but since its academic disciplines differ just little as compared to the previous one, it is possible to generalize it. The Academic disciplines are arranged in Programming, Humanistic and Complementary courses, Mathematics, Computer Models and Systems, Technology, Software Engineering and Graphics Processing. It is important to remark that an academic discipline might be part of more than one theme line, such as the Graph Theory. This content also exposes
some information relevant for the interpretation of results and not for the mining algorithm.
Before the tests, the data went through a cleansing and transformation process in which the duplicate lines were removed and the uncommon values treated, as the case of averages 22.22 and 99.99 attributed to certain records. Furthermore, the data had their format changed to a new structure as shown in Figure 2.
FIGURE 2. Part of the data is provided in its original format
In this new structure, the absences and final situation were removed and the averages started to be arranged in columns, sorted by academic discipline. This data aggregation was loaded on a Sun MySQL database to be more efficiently exploited.
When attempting to run cluster analysis experiments with these data, by using WEKA‟s K-Means algorithm, it was noted that the field Year/Semester rendered the results unsatisfactory. The data were then clustered by the field „Student‟ so that each student started to have only one data line and the grade of each academic discipline started to be the average of the acquired grades, where the historic representation of the data ceased to exist. For example, the student mentioned previously in the green rectangle of Figure 2, who has attended the course Differential and Integral Calculation IV twice, and had averages 1.5 and 5.5 respectively, starts to have a single record comprising the average 3 for this academic discipline. This aggregation bears the exploitation of patterns that reflect the profile of the students, because each student is represented by a single line, which, on the other hand, is considered an aspect to be analyzed by the K-Means algorithm.
Tests
As soon as the data were loaded on WEKA it was possible to observe certain statistical measures related to the data in the new aggregation. The set comprises 184 students, but the grades are mostly focused on the academic disciplines taught in the beginning of the course.
On WEKA‟s Cluster tab, the Simple K-Means algorithm has been selected, which offers the classic implementation of the K-Means technique, with the parameters preserved in their default value.
One of the parameters of the algorithm is the number of clusters in which the data must be segmented. This parameter, normally referenced as K, has been altered between the values 2 and 10 with a view to find out the number of clusters that best suits the data after the analysis of the results acquired for each of the K values.
When running the algorithm with the K value set to 2, an enhanced performance of one of the groups could be observed, which is shown as blue dots in Figure 3.
FIGURE 3. Part of the data is provided in its original format
Note that cluster 0 integrates most of the dots to the right of the horizontal axis of Figure 3, where the academic disciplines related to the end of the course are located. It can also be observed that, as semesters move forward, the students of both clusters show a tendency to standardize their performances, which is evidenced by the mixture of different colors at the end of the horizontal axis.
When the K value is gradually increased, these patterns are preserved and, beginning with K equals 5, the groups start to present extra peculiarities.
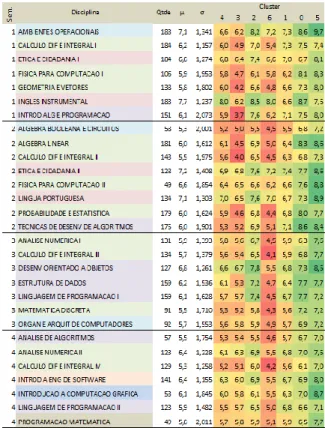
During the analysis in search of 7 clusters, two interesting points stood out, one regards the difficulties, and the other, the aptitudes. The students with difficulties, arranged in clusters 3 and 6, have demonstrated it especially in Mathematics and Programming, as shown in Figure 4.
FIGURE 4. Results acquired with the analysis of seven clusters.
As to aptitude, it is possible to note, for instance, that among groups 4, 2 and 1, interpreted as average performance, the best performance in instrumental English was acquired by clusters 4 and 2.
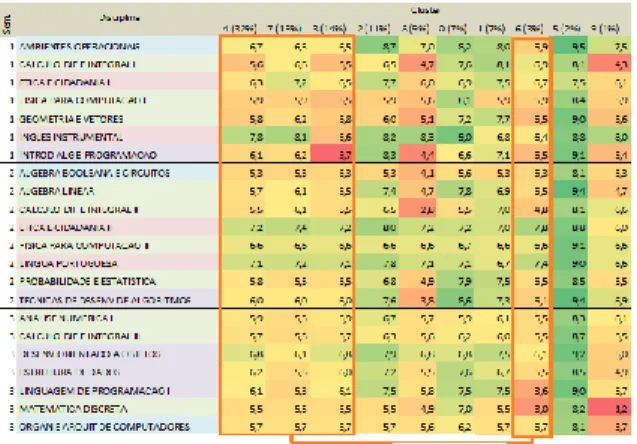
By replacing the distance function of the K-means algorithm from Euclidian to Manhattan, using the value 10 as parameter K, the results indicated differences that were less uniform and whose characteristics were more distinct among the clusters (Figure 5). In the average group, cluster 3 shows an outstanding difficulty in the academic discipline Algorithms and Programming Basics, while the logs of cluster 8, interpreted as having difficulties, show its aptitude in dealing with the English language.
FIGURE 5. Results for the Manhattan distance from the analysis of ten clusters.
The instances exported by the analysis of clusters with Manhattan distance were used for classification, and gained an extra attribute in which the cluster associated to the instance is defined.
The instances that belong to clusters 4 and 7 were grouped under the label Average1, and cluster 3 was renamed to Average2. Clusters 0, 1 and 2 became WithAptitude1, WithAptitude2 and WithAptitude3. Lastly, cluster 8 was once again labeled WithDifficulty.
When running WEKA‟s J48 algorithm, which is an implementation of technique C4.5, the tree, which is textually shown below, was built: This tree presents a classification accuracy of 60%, however most of its inaccuracy is found under the labels WithAptitude.
Although its performance was not quite satisfactory for instances of the WithAptitude class, with 83%
accuracy this tree has defined that Average2 is under the academic discipline “Instrumental English <= 6.8” and “Ethics and Citizenship I <= 8.1”. Moreover, the instances of the class WithDifficulty have been placed in the academic discipline “Instrumental English > 6.8” and “Differential and Integral Calculation I <= 6.1”.
Conclusion
This article highlights some data mining processes, from data procurement to the use of WECA, and the interpretation of patterns acquired through the use of algorithms.The test allowed the observation of stages such as the preparation of stored data and the application of the classification technique. These stages might be useful as a foundation for new tests and improvements, allowing its application in other courses and schools. The acquired results indicate the feasibility of data mining in transcripts, stressing that several patterns appear quantitatively during the day-by-day of courses, allowing the application of algorithms and the identification of trends, not always so evident, regarding the characteristics of the students and the courses. The method presented here might function as a base to the strategic development of new courses, if used as a tool to aid the learning process.
REFERENCES
1. Amo, S. D. (2004) “Técnicas de Mineração de Dados”, In: Jornada de Atualização em Informática, Salvador: Sociedade Brasileira de Computação.
2. Bispo, C. A. F. (1998) “Uma Análise da Nova Geração de Sistemas de Apoio à Decisão”, 174 f. Dissertação (Mestrado em Engenharia de Produção) – Escola de Engenharia da USP São Carlos.
3. Cherkassky, V. and Mulier, F. M. (2007) “Learning from Data: Concepts, Theory, and Methods”, Hoboken, NJ, USA: Wiley, 2th edition.
4. Fayyad, U. M. and Piatetsky-Shapiro, G. and Smyth, P. and Uthurusamy, R. (1996) “Advances in Knowledge Discovery and Data Mining”, The MIT Press.
5. Pang-Ning, T. and Steinbach , M. and Kumar, V. (2005) “Classification: Basic Concepts, Decision Trees and Model Evaluation”, In:______. Introduction to Data Mining, cap. 4, p. 106-152, Addison Wesley, 1th edition.
6. Witten, I. H. and Frank, E. (2005) “Data Mining: Practical Machine Learning Tools and Techniques”, San Francisco, CA, USA: Elsevier, 2th edition.
7. Zhang, S. and Zhang, C. and Yang, Q. (2003) “Data Preparation for Data Mining”, Applied Artificial Intelligence, v. 17, p. 375-381.
8. Tan, P.-N.; Steinbach, M.; Kumar, V. Exploring data. In: . Introduction to Data Mining. 1. ed.
[S.l.]: Addison Wesley, 2005. cap. 3, p. 97_144. ISBN 0321321367.
9. Wu, X.; Kumar, V. The Top Ten Algorithms in Data Mining. 1st. ed. [S.l.]: Chapman &
Hall/CRC, 2009. ISBN 1420089641,