A New Detection Method for Distributed
Denial-of-Service Attack Traffic based on Statistical Test
Chin-Ling Chen
(Department of Information Management National Pingtung Institute of Commerce
Pingtung, Taiwan 900 [email protected])
Abstract: This study has proposed a new detection method for DDoS attack traffic
based on two-sample t-test. We first investigate the statistics of normal SYN arrival rate (SAR) and confirm it follows normal distribution. The proposed method identifies the attack by testing 1) the difference between incoming SAR and normal SAR, and 2) the difference between the number of SYN and ACK packets. The experiment results show that the possibilities of both false positives and false negatives are very low. The proposed mechanism is also demonstrated to have the capability of detecting DDoS attack quickly.
Key Words: Security and protection, Network monitoring, Statistical computing
Category: C.2.0, C.2.3, G.3
1
Introduction
Denial of service (DoS) attack deluges the processing queue or link capacity of victim host with counterfeit packets. Distributed denial of service (DDoS) attack is a worse variant that an intruder may command the compromised computers to attack the same victim host at the same time. The difficult part of defending DDoS is that the flooding packets from numerous attackers are launched by an unknown intruder. TCP is the most important traffic in the Internet and 90 % of DDoS attack traffic uses TCP [Moore et al. 2006].
Many methods to defense servers from SYN flooding attacks have been pro-posed. We may categorize them into three main approaches: packet marking, proactive and reactive. Packet marking approach marks the suspicious packets with some bits at distributed routers, and then filters them in case of violating rule or exceeding threshold. Some IP Traceback schemes [Xiang and Zhou 2005, Muthuprasanna and Manimaran 2005] employ packet marking to trace attacks that use source address spoofing. Proactive approach usually 1) modifies the existing protocol to prevent DDoS attack from happening [Duwairi and Mani-maran 2006], or 2) differentiates malicious traffic from normal one with the use of PacketScore [Ayres 2006] or test probability [Gao and Ansari 2006] or with the deployment of intelligent framework [Tupakula et al. 2004, Kong et al. 2003, Keromytis 2004]. On the other hand, reactive approach takes some response after
the malicious traffic is detected. Much effort has been concentrated on reactive approach. Particular emphasis is on the designing of threshold algorithm and how they are affected by the parameters of the algorithm [Wang et al. 2002, Siris and Papagalou 2004, Siaterlis and Maglaris 2005, Zou et al 2006, You et al. 2007]. The combination of a coordinated detection and response framework is a more advanced way to mitigate the damage caused by DDoS [Haggerty et al. 2004, Lam et al. 2006]. The proposed framework composes of some heterogeneous defense systems which cooperate with each other to protect from attacks. There is growing interest in the use of statistical-based methods to defend against and mitigate the effect of DDoS attacks [Ohsita et al. 2004, Li et al. 2005, Jin and Yeung 2004, Chuah et al. 2004]. Packet statistics from on-line history data are monitored to classify normal and attack traffic.
Most researches in DDoS focus on designing of an effective countermeasure to detect flooding attack. However, low-rate attack may happen on condition that the rate difference between attackers and normal users is insignificant, thus making backlog queue full. The proposal [Jing et al. 2006] encounters SYN low-rate attack by providing IP traceback-based low-rate limit algorithm to identify and isolate the malicious traffic.
Unlike most of the previous DDoS defense schemes that only deal with either flooding or meek attack, the proposal uses two statistical tests to identify the malicious traffic. We first compare the differences between the overall means of incoming traffic arrival rate and normal traffic arrival rate by two-sample t-test. If the difference is significant, we may conclude that the traffic may include flooding attack packets. However, the low-rate attack traffic may pass the arrival rate test and makes the backlog queue full. We then compare two groups that contain different number of SYN and ACK packets by two-sample t-test. If there is significant difference, we may recognize that the attack traffic is mixed into the current traffic. It happens that normal traffic is mistaken for attack traffic (False Positives, FP) as well as attack traffic is mistaken for normal traffic (False Negatives, FN). We evaluate both FP and FN of the proposed scheme by conducting some experiments. We also compare the time to detect attack traffic between the proposed scheme and the other methods.
The rest of the paper is organized as follows. Section 2 presents Statistical analysis and detection scheme. We have performance evaluation in section 3. Finally, section 4 concludes this paper.
2
Statistical analysis and detection scheme
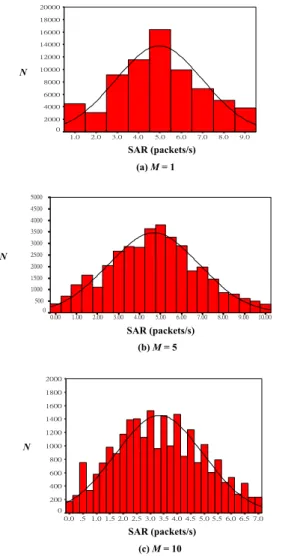
In this section, we first confirm the SYN arrival rates (SAR) sampling distribu-tion of normal traffic is fitted to a normal distribudistribu-tion. The traffic from internet to campus network was monitored. We periodically measured SAR and
calcu-489
lated the sample means( ¯X) and sample standard deviations ( ˆS) of the SAR. Let X1, X2, ...,XN be a sample ofN measurements. We have
¯ X= N i=1 Xi N (1)
The sample variance( ˆS2) for a sample of N measurements is equal to the sum of the squared distances from the mean divided by (N−1). Therefore,
ˆ S2= N i=1 (Xi−X¯)2 N−1 (2)
The reason we use the divisor (N−1) instead ofN is that usingN tends to produce an underestimate of the population variance. So we use (N−1) in the denominator to provide the appropriate correction for this tendency. We may rewrite equation (2) as ˆ S2= N i=1 X2 i − ( N i=1 Xi)2 N N−1 (3)
The sample standard deviation, ˆS, is defined as the positive square root of the sample variance, ˆS2. Thus, ˆS= Sˆ2. We use one-sample Kolmogorov-Smirnov (K-S) test to decide if the samples come from a population with a normal distribution. We have the following hypothesis test.
H0: The data of normal SAR follow a normal distribution H1: The data of normal SAR do not follow a normal distribution
We set the sampling Period (M) to be 1, 5 and 10 seconds and colleted SYN packets form 9:00 on October 22, 2007 to 17:00 November 9, 2007. SPSS plots the collected data based on three sampling periods (M=1, 5 and 10) to generate three histograms (Fig.1(a)-(c)) and Table 1. The P-values for three sampling periods are .438, .571 and .762, individually. The P-value of t or F test statistic is the probability, assuming that H0 is true, of obtaining a value at least as extreme as the given point. Let the level of significant (α) be .05. We can see that all P-values are greater than α= .05, and thus accept theH0 hypothesis. The data of normal SAR follow a normal distribution.
Now we know the sample mean ¯X is normally distributed with unknown mean μ. In the real world, finding the standard deviation of an entire popula-tion is unrealistic. We may estimate populapopula-tion standard deviapopula-tion from sample
M=1(packets/s) ˌˁ˃ ˋˁ˃ ˊˁ˃ ˉˁ˃ ˈˁ˃ ˇˁ˃ ˆˁ˃ ˅ˁ˃ ˄ˁ˃ ঁ ኧ ˅˃˃˃˃ ˄ˋ˃˃˃ ˄ˉ˃˃˃ ˄ˇ˃˃˃ ˄˅˃˃˃ ˄˃˃˃˃ ˋ˃˃˃ ˉ˃˃˃ ˇ˃˃˃ ˅˃˃˃ ˃ ᑑᄷʳːʳ˅ˁ˃ˇʳʳ ؓ݁ᑇʳːʳˈˁ˃ ˡʳːʳˊ˃ˇ˄˃ˁ˃˃ N SAR (packets/s) ˠːˈʻ̃˴˶˾˸̇˂̆ʼ ˄˃ˁ˃˃ ˌˁ˃˃ ˋˁ˃˃ ˊˁ˃˃ ˉˁ˃˃ ˈˁ˃˃ ˇˁ˃˃ ˆˁ˃˃ ˅ˁ˃˃ ˄ˁ˃˃ ˃ˁ˃˃ ଡᑇ ˈ˃˃˃ ˇˈ˃˃ ˇ˃˃˃ ˆˈ˃˃ ˆ˃˃˃ ˅ˈ˃˃ ˅˃˃˃ ˄ˈ˃˃ ˄˃˃˃ ˈ˃˃ ˃ N SAR (packets/s) M=10(packets/s) ˊˁ˃ ˉˁˈ ˉˁ˃ ˈˁˈ ˈˁ˃ ˇˁˈ ˇˁ˃ ˆˁˈ ˆˁ˃ ˅ˁˈ ˅ˁ˃ ˄ˁˈ ˄ˁ˃ ˁˈ ˃ˁ˃ ঁ ኧ ˅˃˃˃ ˄ˋ˃˃ ˄ˉ˃˃ ˄ˇ˃˃ ˄˅˃˃ ˄˃˃˃ ˋ˃˃ ˉ˃˃ ˇ˃˃ ˅˃˃ ˃ ᑑᄷʳːʳ˄ˁˉ˅ʳʳ ؓ݁ᑇʳːʳˆˁˆ ˡʳːʳ˅ˆˉˇˉˁ˃˃ N SAR (packets/s) (b)M= 5 (c)M= 10 (a)M= 1
Figure 1:Sampling distribution
Table 1:One-sample K-S test for SAR M=1 M=5 M=10
sample size (N) 70,408 37,533 23,646
sample mean ( ¯X) 4.96 4.68 3.33
sample standard deviation ( ˆS) 2.03 2.16 1.62
P-value .438 .571 .762
standard deviation. The standard error is √Sˆ
N. We standardize ¯Xby subtracting the mean and dividing by standard error as follows.
Z= X¯ −ˆ μ S
√
N
(4) NowZ has a standard normal distribution. We define confidence interval for μ in the form l ≤μ≤u, where the end-points l anduare computed from the sample data. We know that different samples produce different values of l and u. The lower bound and upper bound end-points are values of random variables L andU, respectively. We have
P{L≤μ≤U}= 1−α (5)
where 0 ≤α ≤1. There is a probability of 1−αof selecting a sample for which the confidence interval will contain the true value of μ.The end-points of l and uare called the lower and upper-confidence limits, individually. From equation (4), we know thatZ has a standard normal distribution. We have
P{−Zα/2≤ ¯ X−μ ˆ S √ N ≤Zα/2}= 1−α (6)
where Zα/2 is the upper 100α/2 percentage point of the standard normal distribution. We may rewrite equation (6) as
P{X¯ −Zα/2√Sˆ N ≤μ≤X¯+Zα/2 ˆ S √ N}= 1−α (7) Therefore, a 100(1−α)% confidence interval onμis given by
¯ X−Zα/2 ˆ S √ N ≤μ≤X¯+Zα/2 ˆ S √ N (8)
The confidence interval in equation (8) gives both a lower and upper con-fidence bound for μ. In this work, we introduce a threshold, Maximum SYN packet Arrival Rates (MSAR), as the boundary between normal SAR and high-rate attack. In order to find out the threshold (Dx) of MSAR, we only obtain upper confidence bounds for μby setting l = -∞and replacingZα/2 byZα. A 100 (1−α)% upper confidence bound forμis, therefore,
μ≤Dx= ¯X+Zα ˆ S √ N (9) whereαis set to 0.025
In the following, we use t-test to verify 1) the difference between normal SAR and attack SAR, and 2) the difference between the number of SYN and
ACK packets. The characteristics of t-test are that it is robust and powerful. The robustness means that its assumptions may be violated to some extent, yet the correct statistical decision will still be made. The power of a statistical test refers to its ability to detect a real difference between two groups’ means. ISR is defined to be the ratio of the number of incomplete packets (the difference between the number of SYN and ACK packets) to the number of normal SYN packets. We have
ISR= I
T (10)
whereIis the difference between the number of SYN and ACK packets, and T is the number of SYN packets. We set up the second threshold (Dy) to detect the possibility of low-rate attack traffic
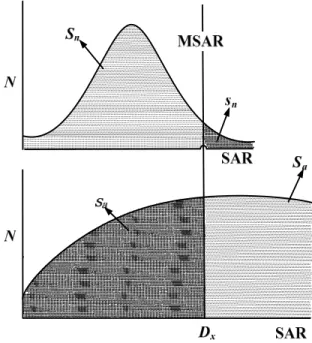
A false positive (FP) occurs when the detection method mistakenly flags a normal traffic as being attacked. On the other hand, a false negative (FN) occurs when the attack traffic is classified as normal traffic. Assume sn is the number of normal SYN packets whose SAR exceeding Dx, Sn is the number of normal SYN packets, sa is the number of attack SYN packets whose SAR belowDx, and Sa is the total number of attack SYN packets. Both FP rate (P1) and FN (P2) rate are described as follows.
P1=Ssn
n (11)
P2= Ssa
a (12)
The relation between FP rate (P1) of FN (P2) rate of MSAR is shown at Fig.2. Let In be the number of normal SYN packets whose ISR exceedingDy, and Ia be the number of attack SYN packets whose ISR below Dy. Both FP rate (P3) and FN (P4) rate of ISR are given as follows.
P3= In
Sn (13)
P4= SIa
a (14)
Fig. 3 depicts the flowchart of traffic identification. Upon receiving the incom-ing packets, the host calculates SAR based on the samplincom-ing period (M), where M= 1, 5 and 10. We compare incoming SAR and normal SAR with two-sample t-test. If there is significant difference between two groups, we may conclude that there is high-rate attack. Otherwise, we further identify the behavior of a flow by testing the significance of a difference between the number of SYN and ACK packets. If so, we may conclude that the flow has the possibility to attack.
Figure 2:Relation between FP rate (P1) and FN rate (P2)
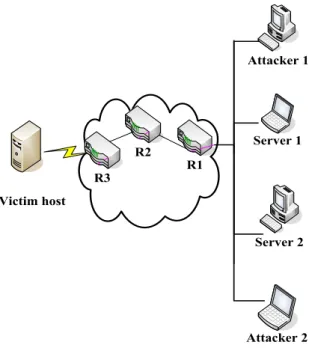
Figure 4:Experimental topology
3
Performance evaluation
Fig. 4 has shown the experimental topology. Suppose Group 1 is a collection of noraml SAR data from 9:00 to 17:00 on October 22, 2007 and Group 2 consists of the attack SAR data generated by attack software tool−Hoepelnuke v0.0.2. Since we do not have any assumptions about attack SAR population distribu-tion, Group 1 and Group 2 are considered as two independent samples. SPSS plots the collected data to generate group statistics (Table 2 and Table 3) and independent sample test (Fig. 5). We use t-test to acertain the significanance of a difference between two population means (μ1−μ2). Assume the difference between two sample means is ( ¯X1 −X¯2), and the standard deviation of the sampling distribution of differences is
(S21 N1 + S2 2 N2). Therefore, t=X¯1−X¯2 (S21 N1 + S2 2 N2) (15)
Obviously, both groups contain different sample size (N1=N2). We use the pooled variance estimate t-test which considers the difference in sample size by weighting the variance of each sample. The pooled variance estimate is
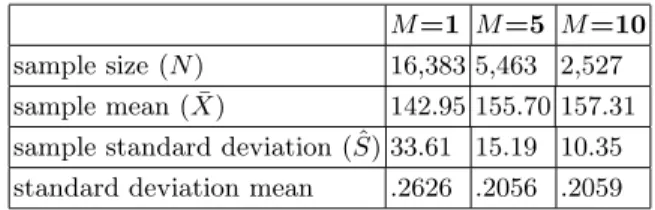
Table 2:Group 1 statistics
M=1 M=5 M=10
sample size (N) 16,383 5,463 2,527
sample mean ( ¯X) 142.95 155.70 157.31
sample standard deviation ( ˆS) 33.61 15.19 10.35
standard deviation mean .2626 .2056 .2059
Table 3:Group 2 statistics
M=1 M=5 M=10
sample size (N) 13,774 5,572 2,799
sample mean ( ¯X) 2.52 1.81 1.75
sample standard deviation ( ˆS) 5.58 3.05 2.43
standard deviation mean 4.758E-02 4.085E-02 4.592E-02
ˆ
S2=(N1−1)S12+ (N2−1)S22
N1+N2−2 (16)
Therefore, equation (15) can be replaced by t=X¯1−X¯2 (Sˆ21 N1 + ˆ S2 2 N2) (17) We have the following hyposthesis test.
H2:μ1=μ2 H3:μ1=μ2
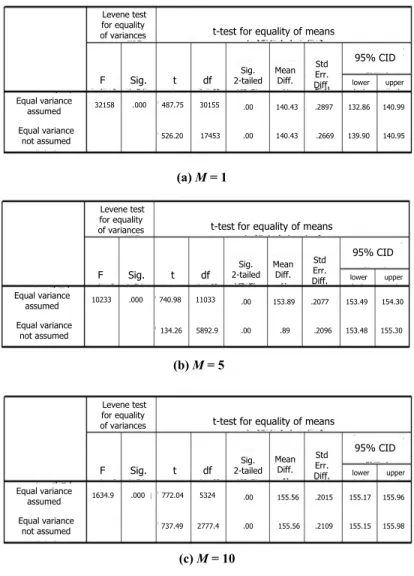
¿From both Table 2 and Table 3, we find that the means ( ¯X)of the two examples are clearly different ((142.95, 2.52), (155.70, 1.81) and (157.31, 1.75)) with theM-value of 1, 5 and 10, individually. Next we need to test the difference is significant or not. Levene’s test is used to assess the null hypothesis that the population variances are equal. If the resulting P-value of Levene’s test is less than some critical value (0.05, in this study), the null hypothesis of equal variances is rejected. We may conclude that there is a difference between the variances in the population. Fig. 5(a)-(c) tabulate the value of t and its P-value (2-tailed) together with the 95% Confidence Interval of the Difference (CID) for both Equal variance assumed and Equal variance not assumed situations. We use Levene’s test for Equality of Variances to assess the equality of variance assumption of a valid t-test. From Fig. 5, we find that the resulting P-value of Levene’s test is 0 (<0.05) in spite of the value ofM. The equality of variance
(c)M= 10 Equal variance
assumed
t-test for equality of means
F Sig. t Equal variance not assumed df Sig. 2-tailed Mean Diff. Std Err. Diff. Levene test for equality of variances 95% CID lower upper 1634.9 .000 772.04 737.49 2777.4 .00 .00 155.56 155.56 .2015 .2109 155.17 155.15 155.96 155.98 5324 (b)M= 5 Equal variance assumed
t-test for equality of means
F Sig. t Equal variance not assumed df Sig. 2-tailed Mean Diff. Std Err. Diff. Levene test for equality of variances 95% CID lower upper 10233 .000 740.98 134.26 5892.9 .00 .00 153.89 .89 .2077 .2096 153.49 153.48 154.30 155.30 11033 Equal variance assumed
t-test for equality of means
F Sig. t Equal variance not assumed df Sig. 2-tailed Mean Diff. Std Err. Diff. Levene test for equality of variances 95% CID lower upper 32158 .000 487.75 526.20 17453 .00 .00 140.43 140.43 .2897 .2669 132.86 139.90 140.99 140.95 30155 (a)M= 1
Figure 5:Normal and attack SAR independent samples test
assumption has been violated and the normal t-test based on separate variance estimates is used (Equal variance not assumed). The obtained differences in sample variances are likely to have occurred. With a P-value of 0 the difference between means is significant. This is also confirmed by the 95% CID for the difference between means ((142.95, 2.52), (155.70, 1.81) and (157.31, 1.75)) in Table 2 and Table 3. We therefore rejects the H2 mean difference of 0 between normal SAR and attack SAR. Since the P-value (0) is less than 0.05, the result
497
Table 4:Group 3 statistics
M=1 M=5 M=10
sample size (N) 225,280 78,523 38,966
sample mean ( ¯X) .33 .34 .36
sample standard deviation ( ˆS) .37 .29 .27
standard deviation mean 7.80E-04 1.03E-03 1.34E-03
Table 5:Group 4 statistics
M=1 M=5 M=10
sample size (N) 225,280 78,521 38,966
sample mean ( ¯X) .70 .66 .64
sample standard deviation ( ˆS) .37 .29 .27
standard deviation mean 7.80E-04 1.03E-03 1.34E-03
is significant beyond the 5-per cent level.
Assume Group 3 and Group 4 collect SYN and ACK packets from 9:00 to 17:00 on October 22-31, 2007, individually. Both groups have the same sample size. We use t-test equation (17) to test the significance of a difference between two population means (μ3 −μ4). Assume the difference between two sample means is ( ¯X3−X¯4). We have the following hypothesis test.
H4:μ3=μ4 H5:μ3=μ4
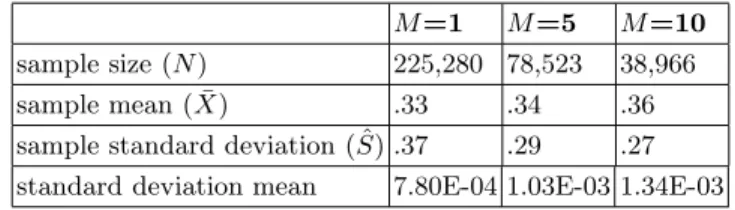
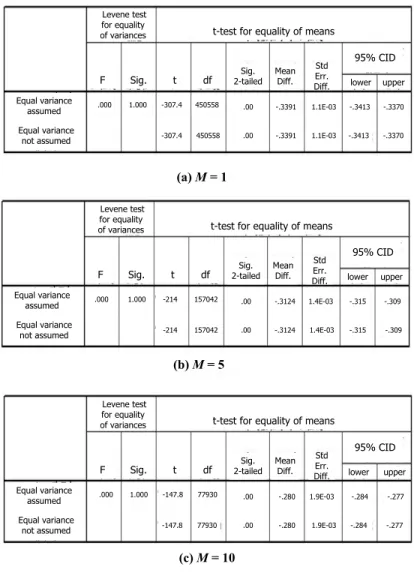
From both Table 4 and Table 5, we can find that the means ( ¯X) of the two examples are slightly different ((.33, .70), (.34, .66), (.36, .64)) with theM-value of 1, 5 and 10, individually. We also use Levene’s test to test the hypothesis that the variances in the two groups are equal. Fig. 6 has shown that Levene’s test is not-significant (P-value = 1.0>0.05) regardless of M-value. We must accept the null hypothesis that the difference between the variance is 0. That is, the variance is roughly equal and the assumption is tenable. We should read the row labeledEqual variance assumed. In the case ofM = 1, 5, 10, the two-tailed P-value are all 0 (<0.05). We may conclude that there is significant difference between the number of SYN and ACK packets.
To illustrate the effects of an attack on the proposed method, we collect the SYN and ACK packets from 9:00 to 17:00, 11/26-27, with a simulated attack source. We set the sampling period (M) to be 1, 5 and 10 seconds individually and use the collected samples to obtain the thresholdDx andDy (Table 6). We may identify high-rate attack by observing the traffic flow with SAR exceeding
(c)M= 10 Equal variance
assumed
t-test for equality of means
F Sig. t Equal variance not assumed df 2-tailedSig. Mean Diff. Std Err. Diff. Levene test for equality of variances 95% CID lower upper .000 1.000 -147.8 -147.8 77930 .00 .00 -.280 -.280 1.9E-03 1.9E-03 -.284 -.284 -.277 -.277 77930 (b)M= 5 Equal variance assumed
t-test for equality of means
F Sig. t Equal variance not assumed df 2-tailedSig. Mean Diff. Std Err. Diff. Levene test for equality of variances 95% CID lower upper .000 1.000 -214 -214 157042 .00 .00 -.3124 -.3124 1.4E-03 1.4E-03 -.315 -.315 -.309 -.309 157042 Equal variance assumed
t-test for equality of means
F Sig. t Equal variance not assumed df Sig. 2-tailed Mean Diff. Std Err. Diff. Levene test for equality of variances 95% CID lower upper .000 1.000 -307.4 -307.4 450558 .00 .00 -.3391 -.3391 1.1E-03 1.1E-03 -.3413 -.3413 -.3370 -.3370 450558 (a)M= 1
Figure 6:SYN and ACK independent samples test
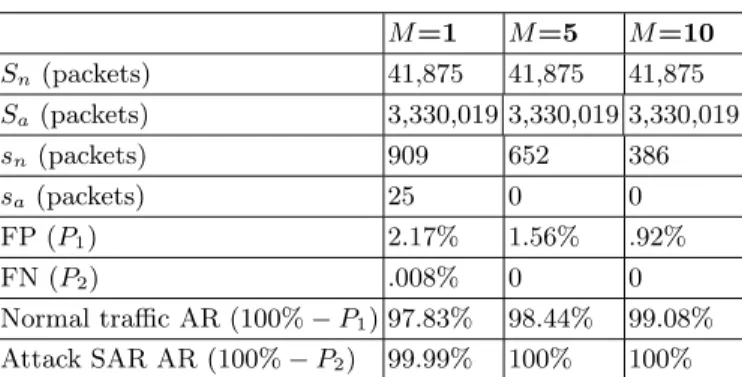
Dx. We define accuracy rate (AR) to be the possibility of not being erroneous identification. Table 7 and Table 8 list normal and attack SAR AR on 11/26 and 11/27, respectively. We find that the AR rate of normal traffic SAR is greater than 96% despite the value ofM. Furthermore, the AR of attack traffic SAR is nearly 99.99%. Both FP rate and FN rate of normal traffic and attack traffic with their corresponding AR are shown in Table 9 and Table 10. We found that normal traffic with M=1 generates FP rate roughly between 5% and 7%. However, the
499
Table 6:The threshold value of Dxand Dy M=1M=5M=10 Dx4.707 3.787 3.716 Dy.6695 .6541 .6390 Table 7: SAR AR (11/26) M=1 M=5 M=10 Sn(packets) 41,875 41,875 41,875 Sa(packets) 3,330,019 3,330,019 3,330,019 sn(packets) 909 652 386 sa(packets) 25 0 0 FP (P1) 2.17% 1.56% .92% FN (P2) .008% 0 0 Normal traffic AR (100%−P1) 97.83% 98.44% 99.08% Attack SAR AR (100%−P2) 99.99% 100% 100% Table 8: SAR AR (11/27) M=1 M=5 M=10 Sn(packets) 38,116 38,116 38,116 Sa(packets) 5,601,231 5,601,231 5,601,231 sn(packets) 1,326 529 161 sa(packets) 99 0 0 FP (P1) 3.47% 1.38% .42% FN (P2) .0018% 0 0 Normal traffic AR (100%−P1) 96.53% 98.62% 99.58% Attack traffic AR (100%−P2) 99.99% 100% 100%
FN rate of SAR is greater than 96% with the value of M=5, 10. The AR of attack traffic is also close to 99.99%. The proposed method is demonstrated to effectively catch attack traffic without generating false positives. Fig. 7 and Fig. 8 illustrate SAR AR and ISR AR, individuallly.
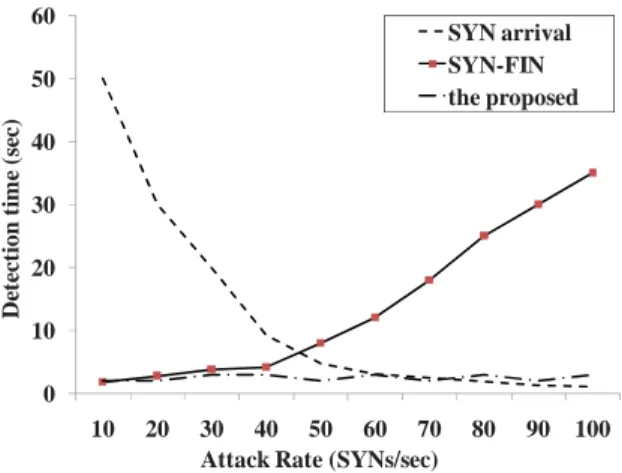
In Fig. 9, we compare the time needed to detect high-rate and low-rate attacks on the proposed scheme with the time on SYN-FIN method [Siris and Papagalou 2004] and SYN arrival method [Ohsita et al. 2004]. We vary the SYN rate of attack traffic and set SYN rate to be 20 as the boundary between high-rate and
Table 9:ISR AR (11/26) M=1 M=5 M=10 Tn(packets) 41,875 41,875 41,875 Ta(packets) 3,330,019 3,330,019 3,330,019 In(packets) 2,377 1,326 201 Ia(packets) 43 0 0 FP (P3) 5.68% 3.17% .48% FN (P4) .0013% 0 0 Normal traffic AR (100%−P3) 94.32% 96.83% 99.52% Attack traffic AR (100%−P4) 99.99% 100% 100% Table 10:ISR AR (11/27) M=1 M=5 M=10 Tn(packets) 38,116 38,116 38,116 Ta(packets) 5,601,231 5,601,231 5,601,231 In(packets) 2,569 644 278 Ia(packets) 537 0 0 FP (P3) 6.74% 1.69% .73% FN (P4) .0096% 0 0 Normal traffic AR (100%−P3) 93.26% 98.31% 99.27% Attack traffic AR (100%−P4) 99.99% 100% 100%
low-rate attack. Both of the proposed scheme and SYN arrival method adopt parametric approach to identify high-rate attack, while SYN-FIN method uses a non-parametric approach. The parametric approach is capable of detecting high-rate attack faster and much more accuhigh-rately than the non-parametric one since the data is fitted into the model. Moreover, the performance of the proposed scheme is better than that of SYN arrival method. SYN arrival method setup the threshold to detect all attacks. However, the computation of threshold value is very complicated. For each measurement of SYN arrival rate, the collected data needs to be sorted and labeled, and then the average of square differences from normal distribution is calculated. The proposed scheme uses the t-test to determine whether there is a significant difference between normal SAR and attack SAR. An attractive characteristic of t-test is responsiveness, which means that t-test works well regardless of the sample size. During the period of low-rate attack, the proposed scheme still outperforms the other two methods. SYN arrival method cannot detect low-rate attack efficiently since the low rate attack
501
94% 95% 96% 97% 98% 99% 100% Normal traffic (11/26) Attack traffic (11/26) Normal traffic (11/27) Attack traffic (11/27) m=1 m=5 m=10 Figure 7:SAR AR 88% 90% 92% 94% 96% 98% 100% Normal traffic (11/26) Attack traffic (11/26) Normal traffic (11/27) Attack traffic (11/27) m=1 m=5 m=10 Figure 8:ISR AR
follows the normal distribution. SYN-FIN method calculates the traffic value by normalizing the difference between the number of SYN and FIN packets, thus leading more computation. The proposed scheme has the advantage of detecting low-rate attack by simply testing the difference between the number of SYN and ACK packets. The proposed scheme has the lowest detection time. The reason is the responsive characteristic of t-test, which is mentioned above. We also find that the time to detect high-rate attack is much faster than low-rate attack on our method. For high-rate attack detection only one SYN packet is needed to identified and processed. On the other hand, low-rate attack detection requires identification of both SYN and ACK packets, resulting in more computation
0 10 20 30 40 50 60 10 20 30 40 50 60 70 80 90 100 SYN arrival SYN-FIN the proposed
Attack Rate (SYNs/sec)
D ete ct io n ti me (s ec )
Figure 9:Detection time
time. This also explains why we deploy high-rate attack detection before low-rate attack detection at traffic identification flowchart (Fig. 3).
4
Conclusions
In this study, we have proposed a simple, robust and efficient DDoS detection mechanism. Two statistical t-tests are applied to detect the possible DDoS at-tack. This proposed method can effectively differentiate between normal and flooding traffic. Indeed, this method can detect even very subtle attacks only slightly different from normal behaviors. The proposed scheme does not hold the three-way handshaking states but only count the SYN and ACK packets, thus making low computation overhead. The efficacy of this detection mecha-nism is validated by experimental simulations. The evaluation results show that the detection mechanism has low false positive and false negative rate, and short detection time.
References
[Ayres 2006] Ayres, P. E., Sun, H., Chao, H. Jonathan, Lau, W. C.: ”ALPi: A DDoS defense system for high-speed networks”; IEEE Journal on Selected Areas in Com-munications, 24, 10 (October 2006), 1864-1876.
[Chuah et al. 2004] Chuah, M. C., Lau, W. C., Kim, Y., Chao, H. Jonathan: ”Tran-sient performance of packetScore for blocking DDoS attacks”; ICC 2004-IEEE International Conference on Communications, 1 (June 2004), 1892-1896.
[Duwairi and Manimaran 2006] Duwairi, B. A., Manimaran, G.: ”Intentional drop-ping: A novel scheme for SYN flooding mitigation”; IEEE INFOCOM 2006-IEEE International Conference on Computer Communications, 1 (April 2006), 3030-3034.
[Gao and Ansari 2006] Gao, Z., Ansari, N.: ”Differentiating malicious DDoS attack traffic from normal TCP flows by proactive tests”; IEEE Communications Letters, 10, 11 (November 2006), 793-795.
[Haggerty et al. 2004] Haggerty, J., Berry, T., Shi, Q., Merabti, M.: ”DiDDeM: A sys-tem for early detection of TCP SYN flood attacks”; GLOBECOM 2004-IEEE Global Telecommunications Conference, 1 (Dec 2004), 5011-5011.
[Jin and Yeung 2004] Jin. S., Yeung, D. S.: ”A covariance analysis model for DDoS attack detection”; ICC 2004-IEEE International Conference on Communications, 1 (June 2004), 1882-1886.
[Jing et al. 2006] Jing, Y., Wang, X., Xiao, X., Zhang, G.: ”Defending against meek DDoS attacks by IP traceback-based rate limiting”; GLOBECOM 2006-IEEE Global Telecommunications Conference, 1 (November 2006), 1475-1479.
[Keromytis 2004] Keromytis, D.: ”Vishal Misra and Dan Rubenstein SOS: An archi-tecture for mitigating DDoS attacks”; IEEE Journal on Selected Areas in Com-munications, 22, 1 (Jan 2004), 176-188.
[Kong et al. 2003] Kong, J., Mirza, M., Shu, J., Yoedhana, C., Gerla, M., Lu, S.: ”Ran-dom flow network modeling and simulations for DDoS attack mitigation”; ICC 2003-IEEE International Conference on Communications, 1 (May 2003), 487-491. [Lam et al. 2006] Lam, H. Y., Li, C. P., Chanson, S. T., Yeung, D. Y.: ”A coordinated detection and response scheme for distributed denial-of-service attacks”; ICC 2006-IEEE International Conference on Communications, 1 (June 2006), 2150-2155. [Li et al. 2005] Li, Q., Chang, E. C., Chan, M. C.: ”On the effectiveness of DDoS
attacks on statistical filtering”; IEEE INFOCOM 2005-IEEE International Con-ference on Computer Communications, 1 (March 2005), 1373-1383.
[Moore et al. 2006] Moore, D., Shannon, C., Brown, D. J., Voelker, G. M., Savage, S.: ”Inferring Internet Denial-of-Service activity”; ACM Transactions on Computer Systems, 24, 2 (May 2006), 115-139.
[Muthuprasanna and Manimaran 2005] Muthuprasanna, M., Manimaran, G.: ”Space-time encoding scheme for DDoS attack traceback”; GLOBECOM 2005-IEEE Global Telecommunications Conference, 1 (November 2005), 457-461.
[Ohsita et al. 2004] Ohsita, Y., Ata, S., Murata, M.: ”Detecting distributed denial-of-service attacks by analyzing TCP SYN packets statistically”; GLOBECOM 2004-IEEE Global Telecommunications Conference, 1 (Dec 2004), 5012-5012.
[Siaterlis and Maglaris 2005] Siaterlis, C., Maglaris, B.: ”Detecting DDoS attacks us-ing a multilayer perception classifier”; IM 2005-IFIP/IEEE International Sympo-sium on Integrated Network Management, 1 (May 2005), 1133-1136.
[Siris and Papagalou 2004] Siris, V. A., Papagalou, F.: ”Application of anomaly de-tection algorithms for detecting SYN flooding attacks”; GLOBECOM 2004-IEEE Global Telecommunications Conference, 1 (Dec 2004), 5013-5013.
[Tupakula et al. 2004] Tupakula, U. K., Varadharajan, V., Gajam, A. K.: ”Counter-acting TCP SYN DDoS attacks using automated model”; GLOBECOM 2004-IEEE Global Telecommunications Conference, 1 (Dec 2004), 5071-5071.
[Wang et al. 2002] Wang, H., Zhang, D., Shin, K. G.: ”Detecting SYN Flooding at-tacks”; IEEE INFOCOM 2002-The Conference on Computer Communications, 1 (June 2002), 1530-1539.
[Xiang and Zhou 2005] Xiang, Y., Zhou, W.: ”Mark-aided distributed filtering by us-ing neural network for DDoS defense”; GLOBECOM 2005-IEEE Global Telecom-munications Conference, 1 (November 2005), 316-320.
[You et al. 2007] You, Y., Zulkernine, M., Haque, A.: ”Detecting flooding-based DDoS attacks”; ICC 2007-IEEE International Conference on Communications, 1 (June 2007), 1229-1234.
[Zou et al 2006] Zou, C. C., Duffield, N., Towsley, D., Gong, W.: ”Adaptive defense against various network attacks”; IEEE Journal on Selected Areas in Communica-tions, 24, 10 (October 2006), 1877-1888.