THE EFFECT OF CUMULATIVE TRAINING LOAD ON PRE-DISPOSING FACTORS OF INJURY IN WOMEN’S SOCCER PLAYERS
Elena Marie D’Argenio
A thesis proposal submitted to the faculty of the University of North Carolina at Chapel Hill in partial fulfillment of the requirements for the degree of Master of Arts in the Department of
Exercise and Sport Science (Athletic Training) in the College of Arts & Sciences.
Chapel Hill 2019
© 2019
ABSTRACT
Elena Marie D’Argenio; The Effect of Cumulative Training Load on Predisposing Factors of Injury in Women’s Soccer Players
(Under the direction of Darin Padua)
High training loads are associated with increased injury risk; however, the associated mechanism has not been established. The objective of this study was to determine if
TABLE OF CONTENTS
LIST OF FIGURES ... vii
LIST OF TABLES ... viii
CHAPTER I: INTRODUCTION ... 1
Statement of Purpose ... 5
CHAPTER II: REVIEW OF THE LITERATURE ... 8
Injury ... 8
Training Load ... 9
Internal Training Load and sRPE ... 10
Absolute and Relative Workload ... 11
Training Load and Injury ... 12
Neuromuscular Predictors of Injury ... 13
Movement Quality ... 13
Landing Error Scoring System (LESS) ... 14
Single Leg Squat (SLS) ... 14
Double Leg Squat ... 15
Range of Motion ... 16
Future Research ... 18
Limitations ... 18
Future Research Needs ... 19
Research Question ... 19
Importance of Research ... 20
CHAPTER III: MATERIALS AND METHODS ... 21
Experimental Design ... 21
Participants ... 22
Instrumentation ... 22
Testing Procedures ... 24
Pre-season ... 24
Jump Landing as Scored by the LESS ... 24
Double Leg Squat ... 26
Single Leg Squat ... 28
Countermovement Jump (CMJ) ... 29
Range of Motion (ROM) ... 29
Session Ratings of Perceived Exertion ... 31
Mid-season ... 32
Statistical Analysis ... 32
REFERENCES……….34
Introduction ... 42
Methods ... 44
Experimental Design ... 44
Participants ... 45
Instrumentation ... 46
Testing Procedures ... 47
Pre-season ... 47
sRPE ... 51
Mid-season... 52
Statistical Analysis ... 52
Results ... 52
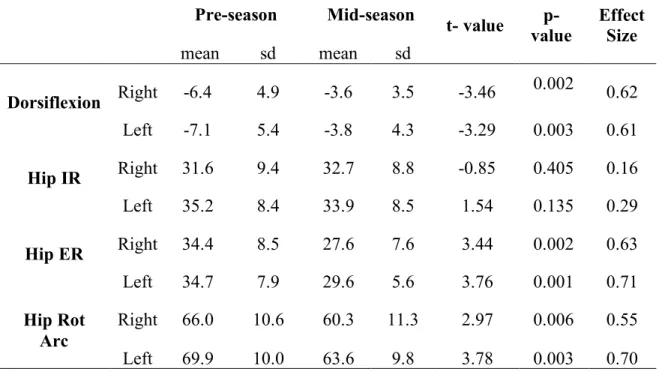
Range of Motion ... 53
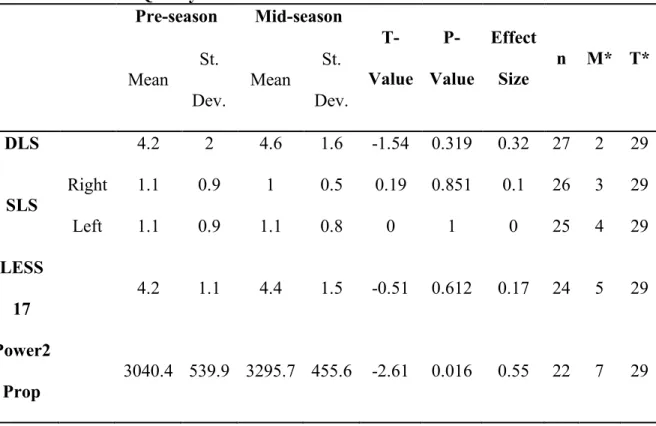
Lower Extremity Movement Quality and Power ... 53
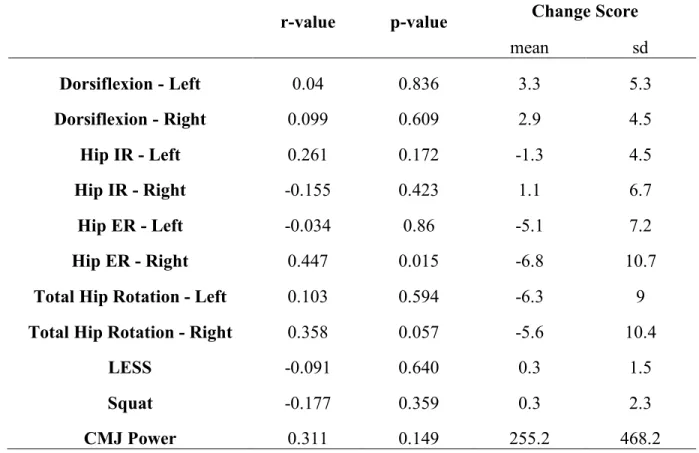
Association Between Training Load and Neuromuscular Changes ... 53
Discussion ... 54
Limitations and Future Research... 59
Conclusion and Clinical Relevance ... 60
LIST OF FIGURES
Figure 1 – Outline of Testing……… 22
Figure 2 – LESS Scoring Outlines ………... 25
Figure 3 – Double Leg Squat Scoring ……….. 27
Figure 4 – Single Leg Squat Scoring ………... 28
Figure 5 – sRPE Chart ………. 31
LIST OF TABLES
Table 1 – Participant Population ………..……..…….. 61 Table 2 – Range of Motion Measures ……….. 62 Table 3 – Movement Quality and Power ………...……….. 63 Table 4 - Correlations Between Cumulative Training Load and NM Factors
CHAPTER I: INTRODUCTION
Throughout all competition levels in athletics, injuries have consistently presented as a problem during both training and competition. Dependent upon the severity, injuries can cause a significant amount of time loss leading to decreased player ability (Carling et al. 2015). On average, in a study on professional male soccer athletes in which a season lasted 300 days, each player missed 37 days, 12% of the season due to injury (Ekstrand, Hägglund, and Waldén 2011). Certain injuries will be more prevalent than others dependent upon the sport. For female soccer players, anterior cruciate ligament (ACL) sprains are common along with hamstring and groin strains (Ekstrand, Hägglund, and Waldén 2011; Roos et al. 2009). Injuries such as these can require an athlete to miss or be limited in practice, games or, a whole season (Roos et al. 2009). Successful teams have lower injury rates and better player availability than unsuccessful teams in professional football (Eirale et al. 2013; Hägglund et al. 2013). For these reasons, researchers and clinicians have a heightened interest in monitoring training load and its effect on injury risk.
training load is measured through heart rate, blood lactate concentration or ratings of perceived exertion (RPE). External training load is measured by variables such as an athlete’s speed, acceleration or the overall duration of a session (Bourdon et al. 2017; Drew and Finch 2016; Drew, Cook, and Finch 2016). For this study, session ratings of perceived exertion (sRPE) multiplied with session duration will be utilized as the training load metric.
The acute (prior 1-week) to chronic (prior 4-weeks combined) workload ratio (ACWR) is commonly used to monitor an athlete’s training load in sport (Hulin et al. 2016; Blanch and Gabbett 2016). The ACWR considers an athlete’s long-term chronic load of 4 weeks and compares it to their acute load of about 1 week. This ratio allows researchers, sports medicine staff and coaches to evaluate if the athletes are increasing their load too much or too fast. Large increases in one’s acute training load relative to their chronic training load, has been linked to heightened risk of injury in multiple sports (Jones, Griffiths, and Mellalieu 2017; Bourdon et al. 2017; Hulin et al. 2016; T. J. Gabbett 2016). This is commonly referred to as a “spike” in the athlete’s acute training load. The association between injury risk and training load applies not only to when there is a spike in one’s acute load, but also to when one’s acute load is drastically below their chronic load (Hulin et al. 2016). Research has been able to show that a ratio of above 1.5 and below a 0.5 puts an athlete at risk for injury (Hulin et al. 2016; T. J. Gabbett 2016). In addition, it is important to note that chronic and cumulative training load have also shown to be correlated with injury in most sports (Colby et al. 2014; Brink et al. 2010). While there is strong evidence to support the association between training load and injury risk, the underlying
Training load may influence injury risk by modifying key neuromuscular characteristics associated with an individual’s biomechanical profile. For example, lower extremity range of motion may be negatively affected by alterations in an athlete’s training load. Adequate amounts of knee flexion, hip flexion and ankle dorsiflexion (DF) are required for proper landing
biomechanics in order to decrease the risk of ACL tears (Fong et al. 2011; Whittaker et al. 2017; Dai et al. 2012). Training load may play a role in an athlete’s range of motion throughout the season therefore increasing their risk for ACL tears. For example, restricted hip range of motion has been shown to have an association with non-contact ACL injuries (VandenBerg et al. 2017; Donohue et al. 2015; Mills et al. 2015). Decreased motion at the hips has been thought to result in more stress and strain on the knees (VandenBerg et al. 2017).
Movement quality may also be negatively impacted by altered training loads. Movement quality assessments are designed to identify body asymmetries, assess mobility and stability within the kinetic chain of whole-body movements and detect poor-quality movement patterns (Dorrel et al. 2018). These movements include hip flexion, knee flexion and ankle DF
(Whittaker et al. 2017; Mills et al. 2015). Common movement screens for the lower extremity that have shown to be reliable in predicting injury are squat tests (double and single leg) (Deforest, Cantrell, and Schilling 2014; Donohue et al. 2015; Barker-Davies et al. 2018) and jump-landing tests, such as the Landing Error Scoring System (LESS) (Padua et al. 2009). Given the association between movement quality and injury risk, if training load induced alterations alter one’s movement quality then this may impact their risk of injury.
One test that the helps identify acute fatigue and lower extremity power is the
Campo-Vecino 2014a). This test assesses an athlete’s ability to produce a high amount of peak torque when pushing off the ground and jumping into the air while also measuring jump height
(Balsalobre-Fernández, Tejero-González, and del Campo-Vecino 2014a; Balsalobre-Ferná ndez, Tejero-Gonzá lez, and del Campo-Vecino 2014). This test has also been shown to have a
connection to training load in a study done on cross country runners (Balsalobre-Ferná ndez, Tejero-Gonzá lez, and del Campo-Vecino 2014). With limited research in the relationship between training load and countermovement jump, more research needs to be done to determine the strength of the relationship between these two variables. Potentially, as a predictor of fatigue the measurement of CMJ may help identify athletes at risk for injury through this facet.
Previous research has demonstrated injury to be associated with one’s training load and neuromuscular (range of motion, movement quality) profiles. However, research has not examined how one’s training load and neuromuscular profiles may be related. Understanding this relationship may elucidate possible mechanisms underlying the association between training load and injury risk. Therefore, the purpose of this study is to identify whether there is an
clinicians can potentially use this information to address deficits in that specific predisposing factor in the athletes when there is a higher training load noted in an athlete to help mitigate the risk of injury.
Statement of Purpose
The purpose of this study was to investigate how an athlete responds to load from pre-season to mid-pre-season when most injuries were observed. Another aspect and purpose of this study was to use sRPE measures to monitor cumulative training load of the soccer players over time and to determine if there is a correlation between the athletes’ movement quality, ROM and lower extremity power.
Dependent Variables 1.) Movement Quality
a. Landing Error Scoring System b. Squat Scores
2.) Range of Motion
a. Ankle Dorsiflexion b. Hip Internal Rotation (IR) c. Hip External Rotation (ER) d. Hip Rotational Arc
3.) Lower Extremity Power
a. Countermovement Jump using Force Plate Independent Variables
a. sRPE measures multiplied by session duration Research Question 1
1a. How does training and competition affect a Division 1 Women’s soccer player’s DF, hip IR, hip ER and hip rotational arc from pre-season to mid-season?
1b.How does training and competition affect a Division 1 Women’s soccer player’s LESS scores from pre-season to mid-season?
1c. How does training and competition affect a Division 1 Women’s soccer player’s squat scores from pre-season to mid-season?
1d.How does training and competition affect a Division 1 Women’s soccer player’s lower extremity power from pre-season to mid-season?
Hypothesis: There will be a statistically significant difference between each variable from pre-season to mid-pre-season in which the biggest difference being in squat form, lower extremity power and jump landing LESS scores.
Research Question 2
2a. Is there a correlation between cumulative training load and changes in dorsiflexion, hip IR, hip ER and hip rotational arc measures from pre-season to mid-season in a Division 1 Women’ soccer player?
2b.Is there a correlation between cumulative training load and changes in LESS scores from pre-season to mid-season in a Division 1 Women’ soccer player?
2d.Is there a correlation between cumulative training load and changes in lower extremity power measures from pre-season to mid-season in a Division 1 Women’ soccer player? Hypothesis: There will be a strong positive correlation between training load and lower
CHAPTER II: REVIEW OF THE LITERATURE
Injury
Injury can cause a substantial amount of time loss in competition for an athlete from any sport. Whenever necessary, the proper steps should be taken to reduce the risk of injury. An injury can be defined by clinical examination, athlete self-report and sport performance (Drew and Finch 2016). The demands placed upon an athlete during training or competition can lead to abnormal stress loads on the joint resulting in injury (Shojaedin et al. 2014). One study showed that on average, in a professional men’s soccer team, each player gets injured twice during a season (Ekstrand, Hägglund, and Waldén 2011). This same study showed that 12% of the injuries were re-injuries that required a significantly longer absence from play to heal (Ekstrand, Hägglund, and Waldén 2011). Prevention of injury has become a key component of sports medicine. There have been many steps taken to identify athletes that are more at risk for injury. These methods include measuring and analyzing training load data, completing pre-season screenings for ROM, movement efficiency and fatigue and lower body power (Shojaedin et al. 2014; Whittaker et al. 2017; Balsalobre-Ferná ndez, Tejero-Gonzá lez, and del Campo-Vecino 2014).
leading to an injury rate of 3.05 per 10,000 athlete exposures in the NCAA (Dalton, Kerr, and Dompier 2009). For females, the three most common sites for injury is the thigh and knee and ankle (Roos et al. 2009). The most common types of injury are ligamentous sprains and strains, more specifically hamstring, groin strains and ACL tears (Hägglund et al. 2013). ACL tears in soccer have an injury incidence of 14.6% (Hägglund et al. 2013).
Training Load
As the popularity of prevention in athletics has grown over the years, so has the interest in training load and its effect on injury risk. Through research, there is substantial evidence that an increase in training load places an athlete at a higher risk for injury (Jones, Griffiths, and Mellalieu 2017; Bourdon et al. 2017; Drew and Finch 2016). By measuring training load, one can monitor the changes in an athlete’s performance and how it might affect their injury risk (Halson 2014). As training load increases, so does the stress and strain on an athlete’s body and if they are not properly conditioned to deal with a certain level of training, the likelihood of injuries is substantially higher (Drew and Finch 2016). Training load can then be used to make decisions for future practices and individual playing time for players to mitigate the risk of injury (Halson 2014; Drew, Cook, and Finch 2016). There are two main forms of training load: internal and external (Bourdon et al. 2017; Drew and Finch 2016).
External training load is the measure of the work the athlete completes during a session (Bourdon et al. 2017; Drew, Cook, and Finch 2016; Halson 2014; Soligard et al. 2016). This type of load solely looks at the actual work put out through variables such as power output, speed and acceleration (Bourdon et al. 2017; Halson 2014; Williams et al. 2017). More recently GPS systems have been used to help measure and monitor an athlete’s external output (Halson 2014; Johnston et al. 2014). Both are useful and important in monitoring training load because while external load exemplifies the actual work completed and the ability of the athlete to complete this work, internal load shows just how difficult it was for that particular athlete to complete the task (Soligard et al. 2016). Internal and external training load are often used together, but
separate analyzation can be useful especially when a researcher is looking for something specific in training load. For this research, internal training load through sRPE measures have been chosen because we want to capture overall accumulative work put out by the athlete. sRPE will then be multiplied by the duration of session which will in turn add an external load measure encompassing both internal and external load into one measure.
Internal Training Load and sRPE
load is for internal training load assessed using sRPE (Foster et al. 2001). Foster et al found that RPE measures are better than objective measures when measuring workload over a longer period of time (Foster et al. 2001). Foster et al took sRPE one step further by then multiplying the number athletes gave for the whole session by the session duration (Foster et al. 2001). When comparing this method with the objective HR measure, it was found that sRPE may be more useful over a wide variety of exercise sessions. sRPE is a great device to measure training load, because it is easy to use, cost effective and consistent with objective physiological markers of training load (T. G. Eckard et al. 2018; Saw, Main, and Gastin 2016; Foster et al. 2001). For these reasons, we have chosen to use sRPE multiplied by session duration to measure training load in this study.
Absolute and Relative Workload
the course of two competitive seasons discovered that high cumulative training loads were a risk factor for injury in elite soccer players (Brink et al. 2010). This is one of the very few studies that looked at cumulative training load in relation to injury in soccer. For our study, we want to further investigate the effect of built up load over time on injury without using any type of rate. Training Load and Injury
The majority of the evidence suggests the presence of a relationship between training load and injury (Drew and Finch 2016). Through the existing research on training load, we know that during periods of intensified activity, there is an increased likelihood for injury. (Jones, 2016; Windt, 2016). Athletes can be more prone to injury up to 1 month after the spike in their activity (Drew, Finch, & Cook, 2016). Other research has reported that either an extreme increase or decrease of training load compared to the normal has been related to a higher risk of injury (Windt, 2016).
Neuromuscular Predictors of Injury
There are multiple methods used in the research to identify athletes that are more at risk for musculoskeletal injuries. Clinicians have used these predictors to mitigate the amount of injuries that occur in a season (Padua et al. 2009; Graci and Salsich 2015; Barker-Davies et al. 2018; Human Kinetics (Organization) 2006). Some of these methods include single leg and double leg squat tests, assessments of jump landing movement quality, countermovement jump performance, and range of motion measures. These factors are usually something that can be measured in a pre-participation screening in order to determine what athletes might be at risk for injury before full participation in activity (Drew and Finch 2016; Whittaker et al. 2017).
Movement Quality
are also tests that can be easily replicated and are already used by this team so the players and clinical staff are familiar with what is required for each one.
Landing Error Scoring System (LESS)
Lower extremity movement quality is pivotal in helping an athlete avoid injury and play to the best of their ability (Whittaker et al. 2017). In competition, the most common site severe injury is the knee resulting in about 33.3% of injuries. The LESS has been proven to be a good predictor of ACL injuries(Padua et al. 2009, 2011). The LESS test is an excellent tool to help assess movement quality by looking at the way the athlete lands when jumping off of a box onto a force plate and then jumps again (Padua et al. 2009). This test not only analyzes how the athlete is landing but the force plate also allows the clinician to analyze the amount of force the athlete is landing with (Padua et al. 2009). This clues clinicians into identifying how well the athlete can absorb the force of a landing with their body. Better absorption of the body in landing requires dorsiflexion and deep knee flexion (Padua et al. 2009, 2011; Fong et al. 2011). Greater passive ankle DF has been shown to help deepen knee flexion and prevent a greater valgus force that could potentially result in ACL tears (Fong et al. 2011). Knee flexion combined with hip flexion and ankle DF decreases the ground reaction forces when landing. This
reinforces the importance of flexibility and range of motion to prevent injury. Single Leg Squat (SLS)
Poulsen and James 2011). The SL squat is favored because of its similarities to functional activities such as running and jumping (Barker-Davies et al. 2018). "The similarities between a landing and a squat, which both involve descending and ascending phases, may be the rationale why squats have been commonly used (when doing lower extremity movement screenings)", Donahue et al states (Donohue et al. 2015). In the SLS assessment, the rater assesses the athlete from an anterior view looking at the athlete’s hip, ankle, knee and trunk motion looking for abnormal movements that would pre-dispose an athlete to injury risk. Past research has shown this assessment’s effectiveness on evaluating an athlete’s risk of injury due to their ability to control their knees and hips, in order to prevent knee valgus (Donohue et al. 2015; Ageberg et al. 2010; Poulsen and James 2011; Barker-Davies et al. 2018).
Double Leg Squat
Range of Motion
Further research that reinforces the importance of ROM in preventing injury is a study done by Mills et al on hip flexor tightness in female soccer players. They found that with
increased hip flexor tightness, the hamstrings had to contract more eccentrically putting more of a stress on the hamstrings and increasing the risk of hamstring strains in athletes with
significantly tighter hip flexors (Mills et al. 2015). The hip flexion range of motion was
measured by looking at hip extension range of motion with the participant lying supine with hips at the end of the table the opposite leg pulled to their chest and the leg of the side being measured is extended out and completely relaxed. The inclinometer was then used to measure hip
extension in that position. Along with hip flexor tightness, there is increased interest in connection between restricted hip internal and external rotation and ACL tears in which they discovered that restricted hip range of motion increased an athlete’s risk of ACL injury (VandenBerg et al. 2017; Tainaka et al. 2014; Gomes, de Castro, and Becker 2008). Limited ankle DF range of motion has also been shown to increase risk of ACL tears (Wahlstedt and Rasmussen-Barr 2014; Fong et al. 2011). The two ranges of motion we will be analyzing in this study will be hip rotational arc and ankle DF. Hip rotational arc is the full rotational motion of the hip including both internal and external rotation. Hip rotational arc is the sum of hip internal rotation and external rotation. These two measures were chosen because they are the most commonly researched variables when looking at injury risk and have established validity using intra-class correlation coefficient (Roach et al. 2013).
Fatigue and Lower Extremity Power
been used interchangeably, when these two terms are in fact two separate entities (Jones, Griffiths, and Mellalieu 2017). Fatigue can be defined as an inability to maintain the required expected force, such as not being able to complete tasks that were once achievable within the same time frame (Halson 2014; Jones, Griffiths, and Mellalieu 2017). Research has shown that training status of athletes and environmental conditions can influence fatigue (Halson 2014). In the literature there is not a substantial amount of evidence that fatigue causes injury. Most of the information from fatigue leading to injury is expert opinion (McCall et al. 2015). Jones et al describes fatigue as a factor that can accumulate over time, and with this accumulation comes an increased risk of injury (Jones, Griffiths, and Mellalieu 2017).
As before mentioned, fatigue is a measure of a person’s inability to maintain a required expected force (Halson 2014; Jones, Griffiths, and Mellalieu 2017). A tool that has been used in the research and clinically to measure this power and force, or lack thereof, is the
Countermovement Jump (CMJ). A study done by Balsobre-Fernandez was able to directly connect CMJ with fatigue as well as lower body power (Balsalobre-Fernández, Tejero-González, and del Campo-Vecino 2014a). They analyzed CMJ and salivary cortisol levels every morning and after a race and found a significant positive correlation between the decrease in CMJ measures and the post-competition increase in salivary free cortisol levels
compared to their CMJ peak torque the week before their worst race (Balsalobre-Fernández, Tejero-González, and del Campo-Vecino 2014b). This study was able to show a relationship between athletic performance and CMJ that hasn’t been presented before. A meta-analysis done by Claudino et al confirmed the CMJ test’s ability to measure fatigue, especially when taking the average jump height from the CMJ (Claudino et al. 2017). Using repeated measures helps
increase sensitivity of the test (Claudino et al. 2017). CMJ test can be used to identify fatigue and decreases in lower body power that may indicate athletes that are at higher risk of injury.
Future Research
Limitations
There is still so much we do not know about training load and its specific effects on injury. We understand that training load has an effect and is a good preventative measure against injuries, but we still do not know what training load affects specifically and how strong that influence is. Jones et al states a need for further exploration of the relationships between training load and fatigue variables and injury/illness while also using a wider range of measures for fatigue, injury and load (Jones, Griffiths, and Mellalieu 2017).
Future Research Needs
Whittaker et al called for future research to find the most relevant movement quality outcomes for predicting injury risk. This should be followed by developing better
pre-participation screening exams and LE prevention programs that can help mitigate the risks of injury due to higher training load (Whittaker et al., 2016). Future investigations are needed to examine strategies to mitigate injury risk during the preseason period so that player availability is maximized during this period (Windt et al. 2017). Further research is needed to identify exactly how training load affects injury so that we as clinicians can not only predict injury, but also help prevent it.
Research Question
What is the association between external training load sRPE measures and range of motion, jump landing movement quality, SL and DLS movement quality along with lower extremity power in injury in a women’s soccer team? To help answer the limitations in past research and fulfill the needs of future research, this research study will be focusing on assessing range of motion, LESS testing, movement efficiency and fatigue and its association with
cumulative training load throughout a women’s soccer season. Cumulative training load
measures will be taken throughout the season and the neuromuscular factors will be tested before pre-season and at mid-season to identify changes and compare with cumulative training load.
(mid-season). The peak of the season has been established by the game schedule and where most time loss injuries occurred during the past few seasons. This peak season occurs between 8-9 weeks after the beginning of the season. If one factor is noticeably altered due to training load, this is an area that clinicians can look at addressing in pre-season screenings and LE prevention programs. This research will attempt to answer the following questions:
1) Is there an association between predisposing factors of injury (ROM, jump landing movement quality, Squat MQ and CMJ) and cumulative training load in D1 Women’s soccer athletes?
2) How does training and competition affect a Division I Women’s Soccer Player’s movement quality such as Squat MQ, jump landing and CMJ jump and range of motion (Hip IR/ER, ankle DF), from pre-season to mid-season?
Importance of Research
CHAPTER III: MATERIALS AND METHODS
Experimental Design
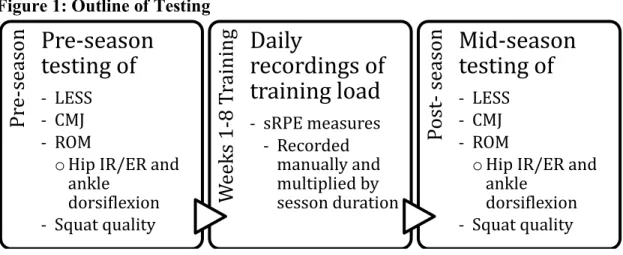
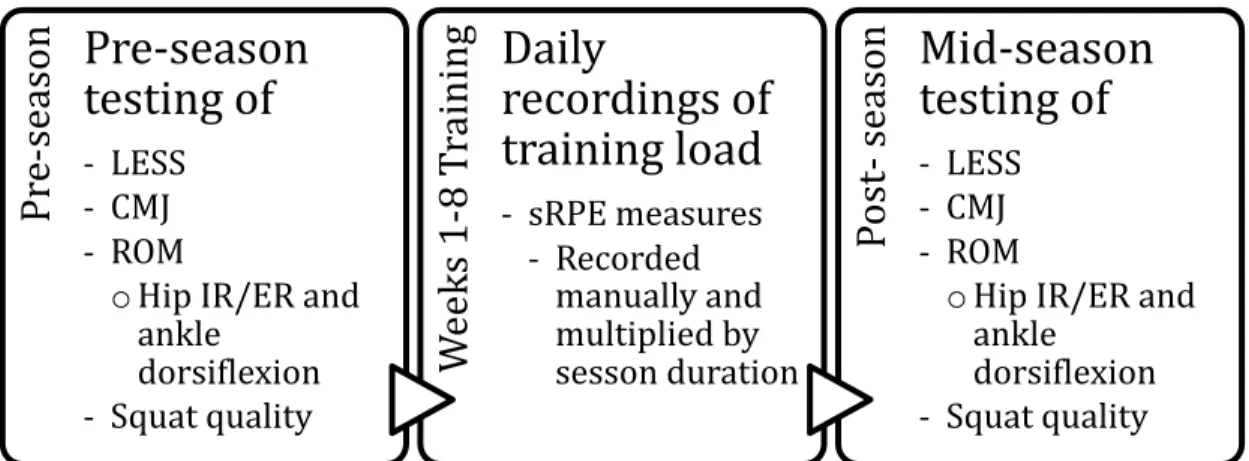
This study is a prospective cohort study designed to examine whether range of motion (ROM) (ankle DF, hip rotational arc), movement quality (jump landing, double leg squat, single leg squat) and lower extremity power (countermovement jump) measures are altered between pre-season and mid-season in female Division-1 soccer athletes. In addition, the association between changes in ROM, movement quality, and lower extremity power with training load measures will be examined (Figure 1).
In this study, the participants completed testing of all the above neuromuscular variables in pre-season before any training and then after 9 weeks into the season. We selected the 9 week time point based on the past 5 years of medical reports for this team. Specifically we were looking for a timepoint where there was a spike in the occurrence of injuries over the years. When looking at these past injury records from the past 5 years, we found that a large amount of injuries were accrued after week 9. We hypothesized that these injuries might be due to an increase in training load that accumulated over pre-season and having multiple games within a week.
there was no team practice, the players received a zero. The following diagram (Figure 1) provides a visual of when each variable is recorded.
Figure 1: Outline of Testing
Participants
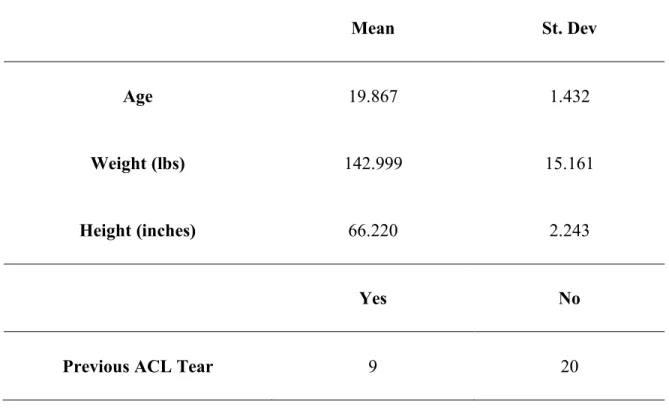
Participants for this study were women’s soccer players. They were all college aged females that were all a part of National Collegiate Athletic Association (NCAA) Division I Women’s soccer team. All participants provided written informed consent in accordance with The University of North Carolina at Chapel Institutional review board policies and procedures. Athletes were included if they were on the varsity team and were cleared for full participation before preseason began. Athletes were excluded if they were not medically cleared to complete screening process during pre-season.
Instrumentation
Session ratings of perceived exertion (sRPE) were recorded manually 15-30 minutes after every training and competition session. The participants self-reported how hard practice or competition was on a scale from 1-10 (Foster et al. 2001). A score of 0 is given on a day of rest. The scores were recorded manually daily, and then transferred onto an excel sheet.
Pr
e-se
aso
n
Pre-season
testing of
- LESS - CMJ - ROMoHip IR/ER and ankle
dorsiflexion
- Squat quality
We
ek
s
1-8
Tr
ai
ni
ng
Daily
recordings of
training load
- sRPE measures- Recorded manually and multiplied by sesson duration
Po
st
-se
aso
n
Mid-season
testing of
- LESS - CMJ - ROMoHip IR/ER and ankle
dorsiflexion
Jump landing movement quality was measured by the Physimax and assessed using the LESS. For the Physimax, materials needed are a Microsoft Kinect depth camera (frontal-plane view only; Kinect sensor, version 1; Microsoft Corp, Redmond, WA) that is connected to a computer running Physimax motion analysis software (Physimax, Tel Aviv, Israel). This method also requires a 30cm box for the participants to jump from (Padua et al. 2009). The jump landing was filtered at 30 Hz. This technology is a valid and reliable tool used often in research to
analyze an athlete’s landing patterns to identify poor movement patterns such as dynamic knee valgus that predispose athletes to injury (Mauntel et al. 2017).
The force plate was used to measure lower extremity power output during a
countermovement jump. The force plate was specifically utilized to measure the power output of the participants as they take off for a max vertical jump to test lower extremity power. This is a valid method for analyzing a patient’s lower extremity power (Cormack et al. 2008) (Bertec Corportation, Columbus, Ohio).
A universal goniometer was used to measure range of motion for ankle DF while the measurement of hip rotational arc will be measured using an inclinometer. A 6-inch goniometer with 1° increments was used to measure ankle DF. A universal goniometer was used to measure ankle DF range of motion because it is the most common tool used by clinicians to measure range of motion in dorsiflexion of the ankle. In a study done by Konor et al, the researcher discovered that when measuring ankle DF, using a universal goniometer was just as reliable as using an inclinometer (Konor et al. 2012). The use of the inclinometer at the hip was used to match the method most commonly used by clinicians due to the ease of use. Previous research on hip rotation and its relationship to injury have used both the inclinometer and universal
in the research to be better than the other. A study done by Roach et al, investigated the
concurrent validity of the inclinometer versus the goniometer in hip range of motion. This study indicated that both were valid, but should not be used interchangeably (Roach et al. 2013). Testing Procedures
Pre-season
A day prior to the beginning of pre-season training, all participants had pre-season measures taken. This included recording height and weight, a general health survey and then pre-season measures of jump landing, double and single leg squat, CMJ and range of motion.
Jump Landing as Scored by the LESS
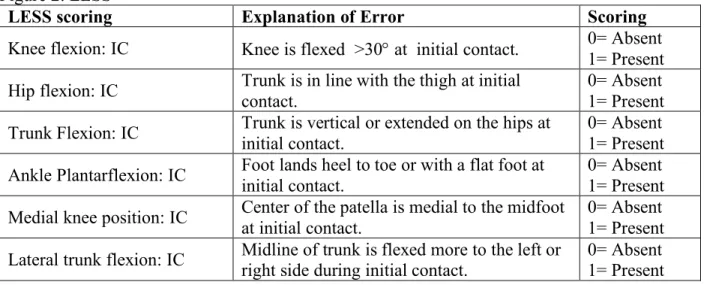
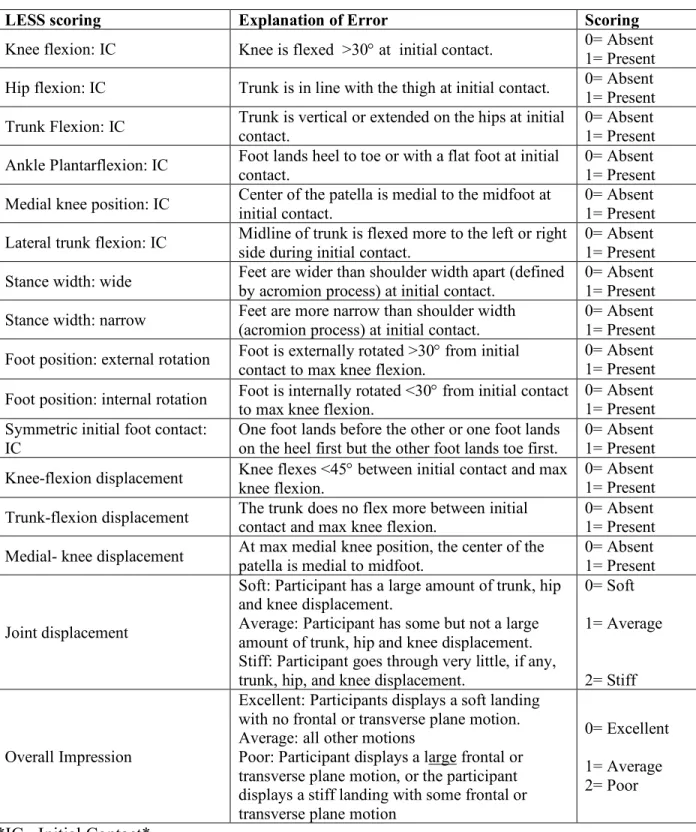
marked spot on the ground; and (4) “completing the task in a fluid motion” (Padua et al. 2009). “This movement was captured by a single camera that had a depth frontal view only. (Kinect sensor, version 1; Microsoft Corp, Redmond, WA). This camera was controlled by a standard laptop computer. Athletic Movement Assessment software (PhysiMax Technologies Ltd, Tel Aviv, Israel) was used to evaluate the depth-camera data and score the LESS” (Mauntel et al. 2017). Participants completed three successful trials of the jump landing tasks. These jumps were processed and then scored according to the LESS test. At the end of every trial, the rater judged the overall jump stating whether they thought it was excellent, average or poor. The Physimax rated each participant on the 16 items shown in Figure 2. Along with the overall impression scoring from the rater, there was a total of 17 items that are scored on the LESS. A higher score on the LESS indicates a higher risk movement pattern (Mauntel et al. 2017; Padua et al. 2009). The items that were scored as ‘present’ on 2 or more of the trials were scored as ‘present’ overall and those items that were scored as present on 0 or 1 trail were scored as ‘absent’ overall. These overall scores were then added together for the final score. The intraclass correlation coefficient (ICC[2,1]) was 0.91 with a standard error of measure (SEM) of 0.42 (Mauntel et al. 2017). Figure 2: LESS
LESS scoring Explanation of Error Scoring
Knee flexion: IC Knee is flexed >30° at initial contact. 0= Absent 1= Present Hip flexion: IC Trunk is in line with the thigh at initial contact. 0= Absent 1= Present Trunk Flexion: IC Trunk is vertical or extended on the hips at initial contact. 0= Absent 1= Present Ankle Plantarflexion: IC Foot lands heel to toe or with a flat foot at
initial contact.
0= Absent 1= Present Medial knee position: IC Center of the patella is medial to the midfoot
at initial contact.
0= Absent 1= Present Lateral trunk flexion: IC Midline of trunk is flexed more to the left or
right side during initial contact.
Stance width: wide
Feet are wider than shoulder width apart (defined by acromion process) at initial contact.
0= Absent 1= Present Stance width: narrow Feet are more narrow than shoulder width (acromion process) at initial contact. 0= Absent 1= Present Foot position: external
rotation Foot is externally rotated >30contact to max knee flexion. ° from initial
0= Absent 1= Present Foot position: internal
rotation Foot is internally rotated <30contact to max knee flexion. ° from initial
0= Absent 1= Present Symmetric initial foot
contact: IC
One foot lands before the other or one foot lands on the heel first but the other foot lands toe first.
0= Absent 1= Present Knee-flexion displacement Knee flexes <45° between initial contact and
max knee flexion.
0= Absent 1= Present Trunk-flexion displacement The trunk does no flex more between initial contact and max knee flexion. 0= Absent 1= Present Medial- knee displacement At max medial knee position, the center of the patella is medial to midfoot. 0= Absent 1= Present
Joint displacement
Soft: Participant has a large amount of trunk, hip and knee displacement.
Average: Participant has some but not a large amount of trunk, hip and knee displacement. Stiff: Participant goes through very little, if any, trunk, hip, and knee displacement.
0= Soft 1= Average
2= Stiff
Overall Impression
Excellent: Participants displays a soft landing with no frontal or transverse plane motion. Average: all other motions
Poor: Participant displays a large frontal or transverse plane motion, or the participant displays a stiff landing with some frontal or transverse plane motion
0= Excellent 1= Average 2= Poor *IC: initial contact
Double Leg Squat
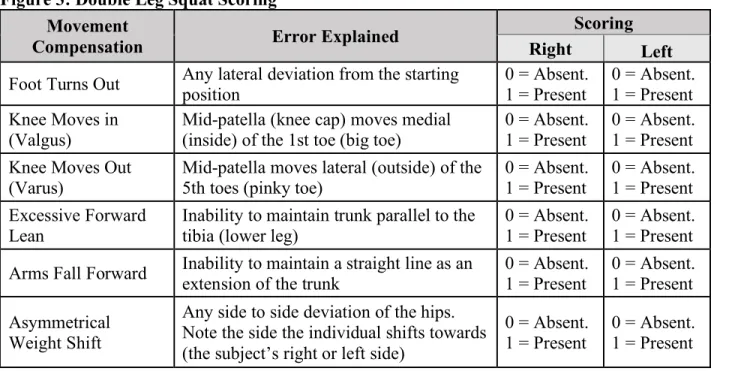
For squat movement quality of a DLS, the raters assessed the participant from a frontal view and a sagittal view that is recorded by the Physimax software. The participant had their shoes off, they were asked to their have arms overhead in line with the rest of their body. They were instructed to have their feet facing forward and shoulder width apart and head facing
go deeper in the following repetitions if possible. The participant completed 3 repetitions. The Microsoft X-Box Kinect camera captured these squats from a frontal view and they were saved on the Physimax software to be accessed and scored at later time. The rater used the Physimax software to score the athlete’s squats. The rater scored the athlete on movements such as knees valgus or excessive forward lean. The intra-rater ICC (2,1) scores for DLS have been recorded as
0.52 and the SEM has been recorded as 2.6 (T. Eckard et al. 2018). The movement impairment had to be present in 2 of 3 of the repetitions for it to be counted. If impairment was present, the participant received a one in that category. If it is not present, they received a 0. The higher the score the athlete received, the worse the quality of the squat was (Figure 3)(Eckard et al. 2018).
Figure 3: Double Leg Squat Scoring Movement
Compensation Error Explained
Scoring
Right Left
Foot Turns Out Any lateral deviation from the starting position 0 = Absent. 1 = Present 0 = Absent. 1 = Present Knee Moves in
(Valgus) Mid-patella (knee cap) moves medial (inside) of the 1st toe (big toe) 0 = Absent. 1 = Present 0 = Absent. 1 = Present Knee Moves Out
(Varus) Mid-patella moves lateral (outside) of the 5th toes (pinky toe) 0 = Absent. 1 = Present 0 = Absent. 1 = Present Excessive Forward
Lean Inability to maintain trunk parallel to the tibia (lower leg) 0 = Absent. 1 = Present 0 = Absent. 1 = Present Arms Fall Forward Inability to maintain a straight line as an extension of the trunk 0 = Absent. 1 = Present 0 = Absent. 1 = Present Asymmetrical
Weight Shift
Any side to side deviation of the hips. Note the side the individual shifts towards (the subject’s right or left side)
0 = Absent.
1 = Present 0 = Absent. 1 = Present
The rater had 87% reliability on double leg squat scoring before they began scoring the athlete’s squat scores.
Single Leg Squat
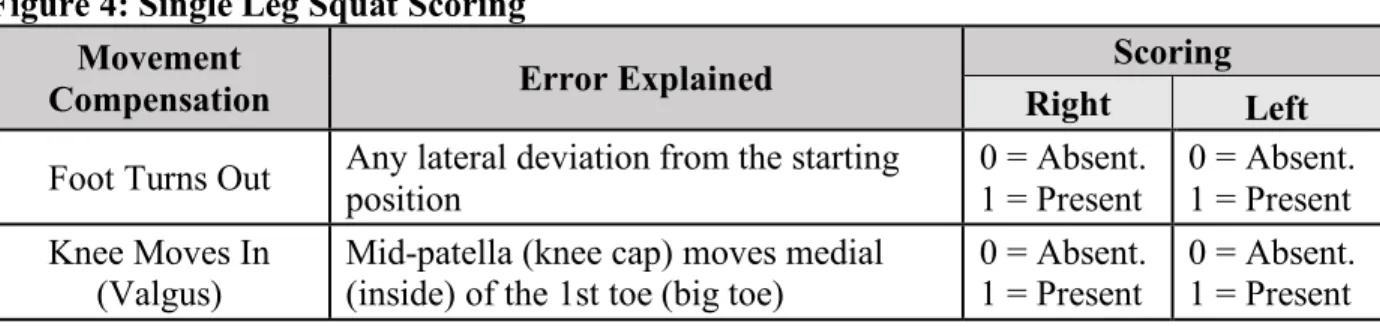
For the SLS, participants were required to complete the test on each leg. They stood on one leg, hands on their hips and eyes facing straight ahead with the non-support leg bent to 90 degrees and the hip bent to 45 degrees. The athlete was instructed to squat as deep as they possibly can comfortably and then return to the original starting position before starting the next repetition. They were allowed a practice set if they chose. No other instructions were provided to the participants other than what constituted a successful repetition. Athletes performed 1 set of 3 consecutive repetitions. This was recorded on an Microsoft camera, storing it on the Physimax software and scored at a later time where the researcher could use this footage to analyze squat movement with both an anterior and sagittal view. Movement quality was visually assessed by a single rater who recorded movement impairments on a data collection sheet. Impairments observed on in 2 of 3 repetitions from any view in which they could be seen were considered present and scored as a 1, with all others scored as 0. The SLS was assessed from anterior and lateral views. The intra-rater ICC (2,1) scores for SLS have been recorded as 0.655 and the SEM
has been recorded as 1.56 (T. Eckard et al. 2018). The SLS score ranges from 0 to 9 for each LE. Right and left scores were summed together to calculate a total SLS score for each participant. These scores were added with the DLS score for a total squat movement quality score (Figure 4). Figure 4: Single Leg Squat Scoring
Movement
Compensation Error Explained
Scoring
Right Left
Foot Turns Out Any lateral deviation from the starting position 0 = Absent. 1 = Present 0 = Absent. 1 = Present Knee Moves In
Knee Moves Out (Varus)
Mid-patella (knee cap) moves medial (inside) of the 1st toe (big toe)
0 = Absent. 1 = Present
0 = Absent. 1 = Present Hip Shift
The hip on one side in notably higher or lower than the other side, due to glute me weakness.
0 = Absent. 1 = Present
0 = Absent. 1 = Present Uncontrolled
Trunk/Loss of Balance
Inability to maintain torso parallel to tibia and/or any change from
starting/neutral position (rotation or side bending)
0 = Absent. 1 = Present
0 = Absent. 1 = Present
Before scoring the official squat scores, the rater completed intra-rater reliability testing in which they scored 3 trials of 12 athletes’ squat performance at three different time points separated by 2 weeks to look at their reliability. The last two time points were compared and reliability tested using percent agreement. The rater had 95% or higher intra-rater percent agreement reliability on single leg squat scoring before they began scoring the athlete’s squat scores.
Countermovement Jump (CMJ)
For the CMJ, the participants were tested using a force plate. The athlete were instructed to jump as high as they can. They had to be stationary, no running start was allowed. (Owen et al. 2014; Moir 2008; McMahon et al. 2018). They were allowed as many as 3 practice trials for the participant to feel comfortable with the equipment and the task. The participant completed the task correctly 3 times and the results were averaged for their total power number. The jumps on the force plate were recorded using the Vicon software and the data was then transferred into excel files to be analyzed. The CMJ ICC has been recorded as 0.98 and the SEM has been recorded as 134.68 W (Jiménez-Reyes et al. 2017).
Range of Motion (ROM)
twice and the scores were averaged together on each side for the final measure of range of motion.
When measuring ankle DF, the participant was lying in prone with a foam roller placed underneath their tibia to prop their feet up. The rater utilized the six- inch goniometer. They placed the axis on the base of the 5th metatarsal. The stationary was placed along the shaft of the
fibula and the movement arm was parallel to the fifth metatarsal. The rater passively dorsiflexed the participant all the way to end range in which the rater adjusted the movement arm to line up with the 5th metatarsal (Fong et al. 2011; Mauntel et al. 2013). This measure was repeated two
times on each side and the average of these measures were recorded for each participant. The intra-rater ICC 1,3 has been recorded in Mauntel et al as 0.821 and the SEM was 2.5 degrees
(Mauntel et al. 2013).
For hip IR/ER arc, an inclinometer was used. For the measurement of hip IR, participant was positioned prone on the table while the leg being measured was bent to 90 degrees and passively internally rotated the athlete, by moving the shank of the leg outward. The inclinometer was placed on the midline of the shaft of the tibia (Mauntel et al. 2013). For external rotation, the participant was still prone, and the shaft of the leg was passively moved inward towards the midline. The inclinometer was placed on the midline of the medial shaft of the tibia (Mauntel et al. 2013). Measurements were repeated two times for each leg and then the average was taken. The intra-rater ICC 1,3 has been recorded in Mauntel et al as 0.894 for hip external rotation
average number was recorded. To attain total hip arc range of motion for each side, the participant’s internal and external range of motion were added together for total arc. Session Ratings of Perceived Exertion
The participant’s sRPE measures was recorded within 15- 30 minutes of the end of each training session or competition. The participants reported to the athletic trainer rating how hard practice was on a scale from 1-10 with one being very light and 10 being extremely severe. The participants were provided with a visual to help them rate the difficulty of practice (Figure 5) This number was then multiplied by the length of practice (in minutes) to include an external training load aspect. If it was a rest day or the participant did not participate any part of practice that day, this was recorded with a 0. If the athlete participated in any part of practice or
completed conditioning or technical work on the side, their sRPE and duration of training was still recorded. The numbers were taken by the rater, so they could clarify with the participants on how they were feeling that day. This also prevented participants from being able to see the numbers of their teammates to prevent bias.
Mid-season
All measures in pre-season were re-tested in the same exact way over a 3-day period. These scores were recorded. The testing took place over the course of one day and occurred the weekend following a total of 9 weeks after the initial tests.
Statistical Analysis
REFERENCES
Ageberg, Eva, Kim L Bennell, Michael A Hunt, Milena Simic, Ewa M Roos, and Mark W Creaby. 2010. “Validity and Inter-Rater Reliability of Medio-Lateral Knee Motion
Observed during a Single-Limb Mini Squat.” BMC Musculoskeletal Disorders 11 (8): 265. https://doi.org/10.1186/1471-2474-11-265.
Alentorn-Geli, Eduard, Gregory D. Myer, Holly J. Silvers, Gonzalo Samitier, Daniel Romero, Cristina Lázaro-Haro, and Ramón Cugat. 2009. “Prevention of Non-Contact Anterior Cruciate Ligament Injuries in Soccer Players. Part 1: Mechanisms of Injury and Underlying Risk Factors.” Knee Surgery, Sports Traumatology, Arthroscopy : Official Journal of the ESSKA 17 (7): 705–29. https://doi.org/10.1007/s00167-009-0813-1.
Balsalobre-Ferná ndez, Carlos, Carlos M Tejero-Gonzá lez, and Juan del Campo-Vecino. 2014. “Relationships between Training Load, Salivary Cortisol Responses and Performance during Season Training in Middle and Long Distance Runners.”
https://doi.org/10.1371/journal.pone.0106066.
Balsalobre-Fernández, Carlos, Carlos M Tejero-González, and Juan del Campo-Vecino. 2014a. “Hormonal and Neuromuscular Responses to High-Level Middle- and Long-Distance Competition.” International Journal of Sports Physiology and Performance 9 (5): 839–44. https://doi.org/10.1123/ijspp.2013-0539.
Balsalobre-Fernández, Carlos, Carlos Ma Tejero-González, and Juan del Campo-Vecino. 2014b. “Relationships between Training Load, Salivary Cortisol Responses and Performance during Season Training in Middle and Long Distance Runners.” PloS One 9 (8): e106066. https://doi.org/10.1371/journal.pone.0106066.
Barker-Davies, Robert M., Andrew Roberts, Alexander N. Bennett, Daniel T.P. Fong, Patrick Wheeler, and Mark P. Lewis. 2018. “Single Leg Squat Ratings by Clinicians Are Reliable and Predict Excessive Hip Internal Rotation Moment.” Gait & Posture 61 (March): 453–58. https://doi.org/10.1016/J.GAITPOST.2018.02.016.
Baumbach, Sebastian F, Mareen Braunstein, Flora Seeliger, Lars Borgmann, Wolfgang Böcker, and Hans Polzer. 2016. “Ankle Dorsiflexion: What Is Normal? Development of a Decision Pathway for Diagnosing Impaired Ankle Dorsiflexion and M. Gastrocnemius Tightness.” Archives of Orthopaedic and Trauma Surgery 136 (9): 1203–11.
https://doi.org/10.1007/s00402-016-2513-x.
Blanch, Peter, and Tim J Gabbett. 2016. “Has the Athlete Trained Enough to Return to Play Safely? The Acute:Chronic Workload Ratio Permits Clinicians to Quantify a Player’s Risk of Subsequent Injury HAS THE ATHLETE TRAINED ENOUGH? A MISSING PART IN THE RETURN TO PLAY DECISION Current State of Pl.” Br J Sports Med 50: 471–75. https://doi.org/10.1136/bjsports-2015-095445.
C. Varley, Tim J. Gabbett, et al. 2017. “Monitoring Athlete Training Loads: Consensus Statement.” International Journal of Sports Physiology and Performance 12 (Suppl 2): S2-161-S2-170. https://doi.org/10.1123/IJSPP.2017-0208.
Brink, Michel S., Chris Visscher, Suzanne Arends, Johannes Zwerver, Wendy J. Post, and Koen Apm Lemmink. 2010. “Monitoring Stress and Recovery: New Insights for the Prevention of Injuries and Illnesses in Elite Youth Soccer Players.” British Journal of Sports Medicine 44 (11): 809–15. https://doi.org/10.1136/bjsm.2009.069476.
Campos-Vazquez, Miguel Angel, Alberto Mendez-Villanueva, Jose Antonio Gonzalez-Jurado, Juan Antonio León-Prados, Alfredo Santalla, and Luis Suarez-Arrones. 2015.
“Relationships between Rating-of-Perceived-Exertion- and Heart-Rate-Derived Internal Training Load in Professional Soccer Players: A Comparison of on-Field Integrated Training Sessions.” International Journal of Sports Physiology and Performance 10 (5): 587–92. https://doi.org/10.1123/ijspp.2014-0294.
Carling, Christopher, Franck Le Gall, Alan McCall, Mathieu Nédélec, and Gregory Dupont. 2015. “Squad Management, Injury and Match Performance in a Professional Soccer Team over a Championship-Winning Season.” European Journal of Sport Science 15 (7): 573–82. https://doi.org/10.1080/17461391.2014.955885.
Claudino, João Gustavo, John Cronin, Bruno Mezêncio, Daniel Travis Mcmaster, Michael Mcguigan, Valmor Tricoli, Alberto Carlos Amadio, and Julio Cerca Serrão. 2017. “The Countermovement Jump to Monitor Neuromuscular Status: A Meta-Analysis.” Journal of Science and Medicine in Sport 20: 397–402. https://doi.org/10.1016/j.jsams.2016.08.011.
Colby, Marcus J., Brian Dawson, Jarryd Heasman, Brent Rogalski, and Tim J. Gabbett. 2014. “Accelerometer and GPS-Derived Running Loads and Injury Risk in Elite Australian Footballers.” Journal of Strength and Conditioning Research 28 (8): 2244–52. https://doi.org/10.1519/JSC.0000000000000362.
Cormack, Stuart J, Robert U Newton, Michael R McGuigan, and Tim L A Doyle. 2008.
“Reliability of Measures Obtained during Single and Repeated Countermovement Jumps.” International Journal of Sports Physiology and Performance 3 (2): 131–44.
http://vb3lk7eb4t.search.serialssolutions.com/?sid=Entrez:PubMed&id=pmid:19208922. Dai, Boyi, Daniel Herman, Hui Liu, William E Garrett, and Bing Yu. 2012. “Prevention of ACL
Injury, Part I: Injury Characteristics, Risk Factors, and Loading Mechanism.” Research in Sports Medicine 20: 180–97. https://doi.org/10.1080/15438627.2012.680990.
Dalton, Sara L, Zachary Y Kerr, and Thomas P Dompier. 2009. “Epidemiology of Hamstring Strains in 25 NCAA Sports in Academic Years.”
https://doi.org/10.1177/0363546515599631.
https://www.ncbi.nlm.nih.gov/pmc/articles/PMC4831851/pdf/ijes_07_04_302.pdf.
Donohue, Michael R, Samantha M Ellis, Erika M Heinbaugh, Mitchell L Stephenson, Qin Zhu, and Boyi Dai. 2015. “Differences and Correlations in Knee and Hip Mechanics during Single-Leg Landing, Single-Leg Squat, Double-Leg Landing, and Double-Leg Squat Tasks.” Research in Sports Medicine (Print) 23 (4): 394–411.
https://doi.org/10.1080/15438627.2015.1076413.
Dorrel, Bryan, Terry Long, Scott Shaffer, and Gregory D Myer. 2018. “The Functional Movement Screen as a Predictor of Injury in National Collegiate Athletic Association Division II Athletes.” Journal of Athletic Training 53 (1): 0–0.
https://doi.org/10.4085/1062-6050-528-15.
Drew, Michael K, Jill Cook, and Caroline F Finch. 2016. “Sports-Related Workload and Injury Risk: Simply Knowing the Risks Will Not Prevent Injuries: Narrative Review.” British Journal of Sports Medicine 50 (21): 1306–8. https://doi.org/10.1136/bjsports-2015-095871.
Drew, Michael K, and Caroline F Finch. 2016. “The Relationship Between Training Load and Injury, Illness and Soreness: A Systematic and Literature Review.” Sports Medicine (Auckland, N.Z.) 46 (6): 861–83. https://doi.org/10.1007/s40279-015-0459-8.
Eckard, Timothy G., Darin A. Padua, Darren W. Hearn, Brett S. Pexa, and Barnett S. Frank. 2018. “The Relationship Between Training Load and Injury in Athletes: A Systematic Review.” Sports Medicine (Auckland, N.Z.) 48 (8): 1929–61.
https://doi.org/10.1007/s40279-018-0951-z.
Eckard, Timothy, Darin Padua, Timothy Mauntel, Barnett Frank, Laura Pietrosimone, Rebecca Begalle, Shiho Goto, Michael Clark, and Kristen Kucera. 2018. “Association between Double-Leg Squat and Single-Leg Squat Performance and Injury Incidence among Incoming NCAA Division I Athletes: A Prospective Cohort Study.” Physical Therapy in Sport 34 (November): 192–200. https://doi.org/10.1016/j.ptsp.2018.10.009.
Eirale, Cristiano, J L Tol, Abdulaziz Farooq, Faten Smiley, and Hakim Chalabi. 2013. “Low Injury Rate Strongly Correlates with Team Success in Qatari Professional Football.” Br J Sports Med 47: 807–8. https://doi.org/10.1136/bjsports-2012-091040.
Ekstrand, J., M Hägglund, and M Waldén. 2011. “Injury Incidence and Injury Patterns in
Professional Football: The UEFA Injury Study.” British Journal of Sports Medicine 45 (7): 553–58. https://doi.org/10.1136/bjsm.2009.060582.
Fong, Chun-Man, J. Troy Blackburn, Marc F. Norcross, Melanie McGrath, and Darin A. Padua. 2011. “Ankle-Dorsiflexion Range of Motion and Landing Biomechanics.” Journal of Athletic Training 46 (1): 5–10. https://doi.org/10.4085/1062-6050-46.1.5.
Conditioning Research 15 (1): 109–15. https://ovidsp-tx-ovid-com.libproxy.lib.unc.edu/sp-3.31.1b/ovidweb.cgi?WebLinkFrameset=1&S=EBOEFPGNCMDDLHHFNCEKODFBNL PMAA00&returnUrl=ovidweb.cgi%3FMain%2BSearch%2BPage%3D1%26S%3DEBOEF PGNCMDDLHHFNCEKODFBNLPMAA00&directlink=https%3A%2F%2Fovidsp.tx.ovid .com.
Gabbett, Tim. 2017. “Infographic: The Training–Injury Prevention Paradox: Should Athletes Be Training Smarter and Harder?” British Journal of Sports Medicine.
https://doi.org/10.1136/bjsports-2016-097249.
Gabbett, Tim J. 2016. “The Training—Injury Prevention Paradox: Should Athletes Be Training Smarter and Harder?” Br J Sports Med 50: 273–80. https://doi.org/10.1136/bjsports-2015-095788.
Gomes, João L Ellera, Jaqueline Vieira de Castro, and Ricardo Becker. 2008. “Decreased Hip Range of Motion and Noncontact Injuries of the Anterior Cruciate Ligament.”
Arthroscopy : The Journal of Arthroscopic & Related Surgery : Official Publication of the Arthroscopy Association of North America and the International Arthroscopy Association 24 (9): 1034–37. https://doi.org/10.1016/j.arthro.2008.05.012.
Gomes, João L Ellera, Jaqueline Vieira De Castro, and Ricardo Becker. 2008. “Decreased Hip Range of Motion and Noncontact Injuries of the Anterior Cruciate Ligament.” Arthroscopy: The Journal of Arthroscopic and Related Surgery 24 (9): 1034–37.
https://doi.org/10.1016/j.arthro.2008.05.012.
Graci, Valentina, and Gretchen B Salsich. 2015. “Trunk and Lower Extremity Segment Kinematics and Their Relationship to Pain Following Movement Instruction during a Single-Leg Squat in Females with Dynamic Knee Valgus and Patellofemoral Pain HHS Public Access.” J Sci Med Sport 18 (3): 343–47.
https://doi.org/10.1016/j.jsams.2014.04.011.
Hägglund, Martin, Markus Waldén, Henrik Magnusson, Karolina Kristenson, Håkan Bengtsson, and Jan Ekstrand. 2013. “Injuries Affect Team Performance Negatively in Professional Football: An 11-Year Follow-up of the UEFA Champions League Injury Study.” British Journal of Sports Medicine 47 (12): 738–42. https://doi.org/10.1136/bjsports-2013-092215.
Halson, Shona L. 2014. “Monitoring Training Load to Understand Fatigue in Athletes.” Sports Medicine (Auckland, N.Z.) 44 Suppl 2 (396): S139-47. https://doi.org/10.1007/s40279-014-0253-z.
Hulin, Billy T, Tim J Gabbett, Daniel W Lawson, Peter Caputi, and John A Sampson. 2016. “The Acute:Chronic Workload Ratio Predicts Injury: High Chronic Workload May
Decrease Injury Risk in Elite Rugby League Players.” British Journal of Sports Medicine 50 (4): 231–36. https://doi.org/10.1136/bjsports-2015-094817.
Repeated Countermovement Jumps. Human Kinetics.
http://vb3lk7eb4t.search.serialssolutions.com.libproxy.lib.unc.edu/?sid=Entrez:PubMed&id =pmid:19208922.
Jiménez-Reyes, Pedro, Pierre Samozino, Fernando Pareja-Blanco, Filipe Conceição, Víctor Cuadrado-Peñafiel, Juan José González-Badillo, and Jean-Benoît Morin. 2017. “Validity of a Simple Method for Measuring Force-Velocity-Power Profile in Countermovement Jump.” International Journal of Sports Physiology and Performance 12 (1): 36–43.
https://doi.org/10.1123/IJSPP.2015-0484.
Johnston, Richard J., Mark L. Watsford, Stephen J. Kelly, Matthew J. Pine, and Robert W. Spurrs. 2014. “Validity and Interunit Reliability of 10 Hz and 15 Hz GPS Units for Assessing Athlete Movement Demands.” Journal of Strength and Conditioning Research 28 (6): 1649–55. https://doi.org/10.1519/JSC.0000000000000323.
Jones, Christopher M, Peter C Griffiths, and Stephen D Mellalieu. 2017. “Training Load and Fatigue Marker Associations with Injury and Illness: A Systematic Review of Longitudinal Studies.” Sports Medicine (Auckland, N.Z.) 47 (5): 943–74. https://doi.org/10.1007/s40279-016-0619-5.
Konor, Megan M, Sam Morton, Joan M Eckerson, and Terry L Grindstaff. 2012. “Reliability of Three Measures of Ankle Dorsiflexion Range of Motion.” International Journal of Sports Physical Therapy 7 (3): 279–87.
https://www.ncbi.nlm.nih.gov/pmc/articles/PMC3362988/pdf/ijspt-07-279.pdf. Malone, Shane, Adam Owen, Matt Newton, Bruno Mendes, Kieran D. Collins, and Tim J.
Gabbett. 2017a. “The Acute:Chonic Workload Ratio in Relation to Injury Risk in Professional Soccer.” Journal of Science and Medicine in Sport 20 (6): 561–65. https://doi.org/10.1016/j.jsams.2016.10.014.
Malone, Shane, Adam Owen, Matt Newton, Bruno Mendes, Kieran D Collins, and Tim J Gabbett. 2017b. “The Acute:Chonic Workload Ratio in Relation to Injury Risk in Professional Soccer.” Journal of Science and Medicine in Sport 20: 561–65. https://doi.org/10.1016/j.jsams.2016.10.014.
Mauntel, Timothy C., Rebecca L. Begalle, Tyler R. Cram, Barnett S. Frank, Christopher J. Hirth, Troy Blackburn, and Darin A. Padua. 2013. “The Effects of Lower Extremity Muscle Activation and Passive Range of Motion on Single Leg Squat Performance.” Journal of Strength and Conditioning Research 27 (7): 1813–23.
https://doi.org/10.1519/JSC.0b013e318276b886.
Mauntel, Timothy C., Darin A. Padua, Laura E. Stanley, Barnett S. Frank, Lindsay J. DiStefano, Karen Y. Peck, Kenneth L. Cameron, and Stephen W. Marshall. 2017. “Automated
McCall, Alan, Chris Carling, Michael Davison, Mathieu Nedelec, Franck Le Gall, Serge
Berthoin, Gregory Dupont, and Artois and. 2015. “Injury Risk Factors, Screening Tests and Preventative Strategies: A Systematic Review of the Evidence That Underpins the
Perceptions and Practices of 44 Football (Soccer) Teams from Various Premier Leagues.” Br J Sports Med 49: 583–89. https://doi.org/10.1136/bjsports-2014-094104.
McMahon, John J., Paul A. Jones, Timothy J. Suchomel, Jason Lake, and Paul Comfort. 2018. “Influence of the Reactive Strength Index Modified on Force- and Power-Time Curves.” International Journal of Sports Physiology and Performance 13 (2): 220–27.
https://doi.org/10.1123/ijspp.2017-0056.
Mills, Matthew, Barnett Frank, Shiho Goto, Troy Blackburn, Samantha Cates, Michael Clark, Alain Aguilar, Nicole Fava, and Darin Padua. 2015. “EFFECT OF RESTRICTED HIP FLEXOR MUSCLE LENGTH ON HIP EXTENSOR MUSCLE ACTIVITY AND LOWER EXTREMITY BIOMECHANICS IN COLLEGE-AGED FEMALE SOCCER PLAYERS.” International Journal of Sports Physical Therapy 10 (7): 946–54.
http://www.ncbi.nlm.nih.gov/pubmed/26673683.
Moir, Gavin L. 2008. “Three Different Methods of Calculating Vertical Jump Height from Force Platform Data in Men and Women.” Measurement in Physical Education and Exercise Science 12 (4): 207–18. https://doi.org/10.1080/10913670802349766.
Owen, Nick J., James Watkins, Liam P. Kilduff, Huw R. Bevan, and Mark A. Bennett. 2014. “Development of a Criterion Method to Determine Peak Mechanical Power Output in a Countermovement Jump.” Journal of Strength and Conditioning Research 28 (6): 1552–58. https://doi.org/10.1519/JSC.0000000000000311.
Padua, Darin A, Michelle C Boling, Lindsay J Distefano, James A Onate, Anthony I Beutler, and Stephen W Marshall. 2011. “Reliability of the Landing Error Scoring System-Real Time, a Clinical Assessment Tool of Jump-Landing Biomechanics.” Journal of Sport Rehabilitation 20: 145–56.
http://content.ebscohost.com/ContentServer.asp?T=P&P=AN&K=59990649&S=R&D=s3h &EbscoContent=dGJyMMvl7ESeqK44zOX0OLCmr0%2Bep7JSrqq4SLaWxWXS&Conte ntCustomer=dGJyMPGrtkqxpq5IuePfgeyx44Dt6fIA.
Padua, Darin A, Stephen W Marshall, Michelle C Boling, Charles A Thigpen, William E Garrett, and Anthony I Beutler. 2009. “The Landing Error Scoring System (LESS) Is a Valid and Reliable Clinical Assessment Tool of Jump-Landing Biomechanics.” The American Journal of Sports Medicine 37 (10): 1996–2002. https://doi.org/10.1177/0363546509343200.
Poulsen, Daniel R., and C. Roger James. 2011. “Concurrent Validity and Reliability of Clinical Evaluation of the Single Leg Squat.” Physiotherapy Theory and Practice 27 (8): 586–94. https://doi.org/10.3109/09593985.2011.552539.
https://www.jospt.org/doi/pdf/10.2519/jospt.2003.33.11.639?code=jospt-site.
Roach, Sean, Jun G San Juan, David N Suprak, and Marc Lyda. 2013. “Concurrent Validity of Digital Inclinometer and Universal Goniometer in Assessing Passive Hip Mobility in Healthy Subjects.” International Journal of Sports Physical Therapy 8 (5): 680–88. https://doi.org/10.1111/j.1525-1497.2005.0124.x.
Roos, Karen G, Erin B Wasserman, Sara L Dalton, Aaron Gray, Aristarque Djoko, Thomas P Dompier, and Zachary Y Kerr. 2009. “Epidemiology of 3825 Injuries Sustained in Six Seasons of National Collegiate Athletic Association Men ’ s and Women ’ s Soccer (2009/2010 – 2014/2015).” https://doi.org/10.1136/bjsports-2015-095718.
Saw, Anna E, Luana C Main, and Paul B Gastin. 2016. “Monitoring the Athlete Training Response: Subjective Self-Reported Measures Trump Commonly Used Objective Measures: A Systematic Review.” British Journal of Sports Medicine 50 (5): 281–91. https://doi.org/10.1136/bjsports-2015-094758.
Shojaedin, Seyyed Sadredin, Amir Letafatkar, Malihe Hadadnezhad, and Mohamad Reza Dehkhoda. 2014. “Relationship between Functional Movement Screening Score and
History of Injury and Identifying the Predictive Value of the FMS for Injury.” International Journal of Injury Control and Safety Promotion 21 (4): 355–60.
https://doi.org/10.1080/17457300.2013.833942.
Soligard, Torbjørn, Martin Schwellnus, Juan-Manuel Alonso, Roald Bahr, Ben Clarsen, H Paul Dijkstra, Tim Gabbett, et al. 2016. “How Much Is Too Much? (Part 1) International Olympic Committee Consensus Statement on Load in Sport and Risk of Injury.” British Journal of Sports Medicine 50 (17): 1030–41. https://doi.org/10.1136/bjsports-2016-096581.
Soucie, J. M., C. Wang, A. Forsyth, S. Funk, M. Denny, K. E. Roach, and D. Boone. 2011. “Range of Motion Measurements: Reference Values and a Database for Comparison Studies.” Haemophilia 17 (3): 500–507. https://doi.org/10.1111/j.1365-2516.2010.02399.x. Tainaka, Koji, Tsuyoshi Takizawa, Hiroyuki Kobayashi, and Masakazu Umimura. 2014.
“Limited Hip Rotation and Non-Contact Anterior Cruciate Ligament Injury: A Case– Control Study.” The Knee 21: 86–90. https://doi.org/10.1016/j.knee.2013.07.006.
Ugalde, Viviane, Chuck Brockman, Zach Bailowitz, and Christine D Pollard. 2015. “Single Leg Squat Test and Its Relationship to Dynamic Knee Valgus and Injury Risk Screening.” PM & R : The Journal of Injury, Function, and Rehabilitation 7 (3): 229–35; quiz 235.
https://doi.org/10.1016/j.pmrj.2014.08.361.
VandenBerg, Curtis, Eileen A Crawford, Elizabeth Sibilsky Enselman, Christopher B Robbins, Edward M Wojtys, and Asheesh Bedi. 2017. “Restricted Hip Rotation Is Correlated With an Increased Risk for Anterior Cruciate Ligament Injury.” Arthroscopy : The Journal of
North America and the International Arthroscopy Association 33 (2): 317–25. https://doi.org/10.1016/j.arthro.2016.08.014.
Wahlstedt, Charlotta, and Eva Rasmussen-Barr. 2014. “Anterior Cruciate Ligament Injury and Ankle Dorsiflexion.” Knee Surgery, Sports Traumatology, Arthroscopy 23.
https://doi.org/10.1007/s00167-014-3123-1.
Whittaker, Jackie L, Nadine Booysen, Sarah de la Motte, Liz Dennett, Cara L Lewis, Dave Wilson, Carly McKay, et al. 2017. “Predicting Sport and Occupational Lower Extremity Injury Risk through Movement Quality Screening: A Systematic Review.” British Journal of Sports Medicine 51 (7): 580–85. https://doi.org/10.1136/bjsports-2016-096760.
Whittaker, Jackie L, Nadine Booysen, Sarah De La Motte, Liz Dennett, Cara L Lewis, Dave Wilson, Carly Mckay, Martin Warner, and Darin Padua. n.d. “Predicting Sport and Occupational Lower Extremity Injury Risk through Movement Quality Screening: A Systematic Review.” Accessed October 12, 2017. https://doi.org/10.1136/bjsports-2016-096760.
Williams, Sean, Grant Trewartha, Matthew J Cross, Simon P T Kemp, and Keith A Stokes. 2017. “Monitoring What Matters: A Systematic Process for Selecting Training-Load Measures.” International Journal of Sports Physiology and Performance 12: 2–101.
https://doi.org/10.1123/ijspp.2016-0337.
Windt, Johann, Tim J Gabbett, Daniel Ferris, and Karim M Khan. 2017. “Training Load--Injury Paradox: Is Greater Preseason Participation Associated with Lower in-Season Injury Risk in Elite Rugby League Players?” British Journal of Sports Medicine 51 (8): 645–50.
CHAPTER IV: MANUSCRIPT
Introduction
Soccer is one of the most commonly played sports in the world and with soccer, like any other sport, comes the risk of injury (Alentorn-Geli et al. 2009). Injuries are an unavoidable component that affects all sports at all levels causing time loss, pain, decreased player
availability and performance (Carling et al. 2015). For female soccer players, anterior cruciate ligament (ACL) sprains are common, along with hamstring and groin strains (Ekstrand,
Hägglund, and Waldén 2011; Roos et al. 2009). ACL tears are one of the more common injuries that cause the most time loss in women’s soccer (Alentorn-Geli et al. 2009). Research has shown that successful teams have lower injury rates and higher player availability than unsuccessful teams in professional football (Eirale et al. 2013; Hägglund et al. 2013). For these reasons, researchers and clinicians have a heightened interest in monitoring training load and its effect on injury risk.
Training load can be defined as stress placed on the body by a performed activity (Jones,
Griffiths, and Mellalieu 2017). An Athlete’s training load can be observed through their internal training load, external training load or both. Internal training load are factors such as heart rate or ratings of perceived exertion (RPE) and refer to how the athlete responds to training and the external load placed upon them. External training load is the work that athlete puts out to
are witnessed in acute (prior 1-week) to chronic (prior 4-weeks combined) workload research as it is the most commonly used to monitor an athlete’s training load in sport (Hulin et al. 2016; Blanch and Gabbett 2016). Large increases in one’s acute training load relative to their chronic training load, has been linked to heightened risk of injury in multiple sports (Jones, Griffiths, and Mellalieu 2017; Bourdon et al. 2017; Hulin et al. 2016; T. J. Gabbett 2016). In addition, it is important to note that chronic and cumulative training load have also shown to be correlated with injury in many sports (Colby et al. 2014; Brink et al. 2010). While there is strong evidence to support the association between training load and injury risk, the underlying mechanism between training load and injury has not been investigated in length.