ESTIMATING RELATIONSHIPS BETWEEN ARSENIC EXPOSURE THROUGH RICE CONSUMPTION AND DISEASE
Andrew Ethan Yosim
A thesis submitted to the faculty of the University of North Carolina at Chapel Hill in partial fulfillment of the requirements for the degree of Master of Science in the Department of Environmental Sciences and Engineering in the Gillings School of Global Public Health.
Chapel Hill 2015
Approved by: Rebecca C. Fry Louise M. Ball
ii © 2015
iii ABSTRACT
Andrew Ethan Yosim: Estimating Relationships Between Arsenic Exposure Through Rice Consumption and Disease
(Under the direction of Rebecca C. Fry)
iv
To my grandfather, whose love of science was contagious.
To my family, who have always supported and encouraged my pursuit of knowledge. To my fiancée, whose love allows me to “…wake at dawn with a winged heart and give thanks
for another day of loving…”
v
ACKNOWLEDGEMENTS
This work would not have been possible without the contribution of others. I want to thank Drs. Bailey and Barchowsky for their assistance throughout my initial research. In
addition, it is necessary that I acknowledge the mentorship shown by every single member of the lab- you were each my instructor, and as your student, I am deeply humbled. Finally, I want to thank Drs. Ball, Nylander-French, and Fry, whose encouragement, guidance, and
vi
TABLE OF CONTENTS
LIST OF TABLES……….………. viii
LIST OF FIGURES………....………... ix
LIST OF ABBREVIATIONS………...….………. x
CHAPTER 1: INTRODUCTION………...……….……... 1
CHAPTER 2: METHODS………...…... 8
Database generation………...………..……... 8
Determination of extrapolated upper As exposure models………...…….. 8
Estimation of cancer incidence and mortality………..………. 10
Estimation of urinary excretion of arsenic……….………... 11
Estimation of in utero exposure……….………... 11
Comparison to BEI, MRL, and RfD……….……….…... 12
CHAPTER 3: RESULTS……….. 13
As and metabolite levels in rice samples……….……. 13
As and metabolite levels in rice by country of origin………...………… 14
As and metabolite levels in rice species and products………..………….………... 15
Modeled daily As maximum allowable dose…………..……….. 16
Estimation of excess cancer incidence and mortality in relationship to rice consumption…………..………..………... 17
Estimation of in U-tAs and in utero exposure…………..……….... 20
vii
CHAPTER 4: DISCUSSION…………..………..………..…………. 22
CHAPTER 5: LIMITATIONS, FUTURE DIRECTIONS AND CONCLUSIONS……… 28
Further Studies…………..………..………..……… 28
Limitations…………..………..………..……….. 29
Conclusion…………..……….. 31
APPENDIX 1: TABLE 1…………..………..………..………... 32
APPENDIX 2: FIGURE 1…………..………..………..………. 33
APPENDIX 3: FIGURE 2…………..………..………..………. 34
APPENDIX 4: TABLE 2…………..………….………..………..……….. 35
viii
LIST OF TABLES
ix
LIST OF FIGURES
Figure 1 - Average levels of tAs, iAs, and DMA in different rice varieties…………..………... 16 Figure 2 - Age specific As exposure from a serving of rice or a rice snack
with average or high As content based on a daily threshold of 0.68µg As/kg…………... 17 Figure 3 - Lifetime risk of cancer for regulated drinking water contaminants
and consumption of rice……….…..………..………..……...… 19 Figure 4 - Estimated lifetime risk of dying from cancer associated with
drinking water by As content…………..………....……….…………... 20 Figure 5 - Age specific As exposure from a single serving of rice or a rice snack
x
LIST OF ABBREVIATIONS
ACGIH American Conference of Industrial Hygienists
As Arsenic
AS3MT Arsenic (+3 oxidation state) methyltransferase ATSDR Agency for Toxic Substances and Disease Registry IARC International Agency for Research on Cancer iAs Inorganic arsenic
BEI Biological exposure index
BW Body weight
CDC Centers for Disease Control and Prevention CSF Cancer slope factor
DMA DMA(III) + DMA(V) DMA(III) Dimethylarsinous acid DMA(V) Dimethylarsinic acid
EPA Environmental Protection Agency FDA Food and Drug Administration MCL Maximum contaminant level
MMA MMA(V)+MMA(III)
MMA(III) Monomethylarsonous acid MMA(V) Monomethylarsonic acid MOA Mode of action
MRL Minimal risk level
xi
NHANES National Health and Nutritional Examination Study ppb Parts per billion
RfD Reference dose
1
CHAPTER 1: INTRODUCTION
Research assessing the arsenic (As) content of foods consumed within the United States has increased markedly in the last several years (Cleland et al. 2009, Gilbert-Diamond et al. 2011a, Davis et al. 2012, Jackson et al. 2012). Recent articles in the popular media (Bloom 2014, Reports 2014) have raised concern over the potential presence of As, classified as a Group 1 carcinogen by the International Agency for Research on Cancer (IARC 2012), in commonly consumed food products. In order to reduce chronic exposure to the toxic metalloid, in 2001, the Environmental Protection Agency (EPA) set a maximum contaminant level (MCL) of 10 µg/L for the total As (tAs) content of publically supplied drinking water in the United States. However, while the As content of drinking water is currently regulated, the As levels in solid foods are currently unregulated.
2
iAs exposure are likely the result of the combined effects of mechanisms such as these, which may be interacting in one or more synergistic and/or causal relationships. The most prevalent route of As exposure worldwide is through the consumption of As-laden drinking water, although individuals may also be exposed to As through other sources including food, air, and soil (Meacher et al. 2002).
Adverse human health effects of long-term exposure to high levels of iAs in drinking water are well documented in areas such as Bangladesh and West Bengal, India (Chowdhury et al. 2000). Populations in areas such as these are routinely exposed to iAs in drinking water at levels much higher than national or World Health Organization (WHO) guidelines (WHO 2008). For example, iAs levels up to 2500 µg/L have been detected in the groundwater of Bangladesh, which exceed Bangladeshi national guidelines of 50 µg/L by 50-fold (Nordstrom 2002). Although levels of exposure to As in drinking water are generally not as high as those observed in Bangladesh, high level exposure is observed in the United States, as many private wells used for drinking water have iAs levels that exceed EPA limits (Sanders et al. 2012).
3
group from S-adenosyl methionine (SAM) to As substrates. In humans, the pentavalent species MMA(V) and DMA(V) are readily excreted through the urine or may be further metabolized to form the trivalent species (NRC 1999).
Arsenic metabolism was widely believed to act as a detoxifying process, such that each successive metabolite product would be less toxic than iAs. However, in the last fifteen years, evidence has emerged that the toxicity of some of the metabolites may be of increasing concern, as forms of the trivalent arsenicals DMA(III) and MMA (III) have been shown to be more cytotoxic in primary human hepatocyte, epidermal keratinocytes, bronchial epithelial, and UROtsa cells compared to iAs treatment (Styblo et al. 2000). In addition, while research into the health effects associated with As metabolites is sparse, DMA(V) and MMA(V) are classified as Group 2B carcinogens (IARC 2012), and recent work suggests that individuals with higher levels of MMA(III) or DMA(III) in exfoliated urothelial cells have increased risk for diabetes (Currier et al. 2014). Although the majority of the present work focuses on forms of As whose risk is well characterized such as tAs or iAs, levels of the metabolites DMA and MMA in rice products are presented and may significantly contribute to an individual’s later-life health outcomes.
4
Rice has been implicated as a major dietary source of As due to its uptake of As from contaminated soil, ground, and surface water (Meharg 2004, Norton et al. 2012). Unlike many other food staples that are grown under aerobic conditions, flooded rice paddy fields provide anaerobic conditions in which reduced forms of As may be incorporated into the growing rice (Xu et al. 2008, Su et al. 2010). Under these conditions silicon transporters readily transport iAs and organic metabolites, which act as silicic acid analogues (Ma et al. 2008, Li et al. 2009), while the phosphate analogues, arsenate and deprotonated DMA are transported via phosphate transporters (Meharg et al. 2012). The incorporated arsenicals predominantly accumulate in the hull of rice through a variety of mechanisms such as xylem transport, phloem transport, and sequestration of As-thiol complexes (Zhao et al. 2009, Tuli et al. 2010). The rate and extent to which arsenicals are incorporated into rice plants are influenced by both inter-species and inter-subspecies differences in As transport and binding (Abedin et al. 2002a, Abedin et al. 2002b, Williams et al. 2005, Liu et al. 2006, Ma et al. 2008), as well as concentrations of silicon, phosphate, heavy metals, and other minerals (Abedin et al. 2002b, Chen et al. 2005, Guo et al. 2007, Lihong et al. 2009, Zhang et al. 2011). While the mineral content of the soil and redox conditions of the rice paddy govern arsenical transport, rice predominately accumulates iAs based on its proclivity to bind iAs at higher rates than organic arsenicals (Abedin et al. 2002b) and the lack of affinity in binding to iron oxyhydroxides to form immobile forms (Meharg et al. 2012).
5
suggest reduction in planta via the actions of homologues of the protein ACR2 (OsACR2;1 and OsACR2;2) in both the roots and shoots of the plant (Duan et al. 2007). In addition, genome-wide analysis from two different rice varieties found up regulation of three genes annotated as methyltransferases in the roots of the plant (Norton et al. 2008). At present, additional studies are needed to further elucidate the locations of As methylation in rice.
While the average US citizen consumes approximately 12 kilograms of rice a year (Batres-Marquez et al. 2009, Rice 2009), certain sub-populations may be more vulnerable to iAs exposure; ethnicities who routinely consume large amounts of rice or individuals who consume rice as a dietary alternative. For example, many individuals on low gluten diets or those suffering from celiac disease routinely consume large quantities of rice or rice-based products (Munera-Picazo et al. 2014a, Munera-Picazo et al. 2014b). Rice with a high iAs content can act as an exposure vehicle, as iAs remains largely unmodified and bioavailable to absorption even after rice has been harvested and cooked (Laparra et al. 2005). Children and infants may be at particular risk for iAs exposure (Xu et al. 2008) as in comparison to adults, they often consume larger quantities of fruits and rice products proportional to their body weight (Yost et al. 2004). In addition, recent work has revealed that infants may be exposed to high levels of iAs through As-rich formulas and infant foods (Carbonell-Barrachina et al. 2012, Jackson et al. 2012).
6
Bailey et al. 2014, Rager et al. 2014). Importantly, alterations to the genome and epigenome during critical developmental periods have been proposed as a plausible link between environmental toxicant exposure and later-life health complications (Barouki et al. 2012).
In 2011, and again in 2013, the FDA released the results of testing performed on various rice-containing food products available for purchase within the United States. Currently, this is the largest dataset available on the speciated As content in food to date. In the present work, the results of these tests were analyzed for statistical trends and patterns. A total of 1,343 rice-based food samples were analyzed, including 487 samples of commercially available rice. All of the tested rice samples with quantifiable data exceed the EPA’s limit of 10 µg/L for As in drinking water, the only available standard against which to judge the samples.
later-7
8
CHAPTER 2: METHODS
Database generation
Concentrations of tAs, iAs, MMA [MMA(V)+(MMA(III)], and DMA [DMA(V)+(DMA(III)] in 1,343 rice and rice-products were obtained from the FDA website (FDA 2011). Of the 1,343 rice and rice-product records, 1,275 contained quantifiable data (94.9%). Of the 487 records that dealt with rice, one lacked a numerical value and was excluded from further analysis. Subcategories of rice for study were designated as “basmati rice”, “white, short grain rice”, “white, medium grain rice”, “white, long grain rice”, “brown rice”, “jasmine rice”, “parboiled rice”, and “instant rice” by the inclusion of the aforementioned words in their description. Categories for rice products were designated as “mixes and pudding”, “beverages”, “cereals”, “cookies”, “dietary supplements”, “grain-based bars”, “pasta”, and “snacks”, with subcategories of these products designated as “rice cakes”, “hot/ready to eat cereal”, and “infant and toddler cereal”.
Determination of extrapolated upper As exposure models
9
The first model was based on an extrapolated calculation of As exposure consistent with the EPA’s limit of As in drinking water The limit of 10 µg/L As was multiplied by an individual’s assumed water intake (2L) to determine an upper daily intake of As due to water consumption. This upper limit of 20 µg As was then extrapolated to all sources of As exposure based on the average daily proportion of As exposure associated with water consumption. Estimates suggest that water contributes 42.2% to 45.3% of exposure in men and women, respectively (Meacher et al. 2002). Using the more conservative figure of 42.2% for women, the total potential exposure to As consistent with the current water guidelines suggests that an individual’s upper threshold of tAs exposure is 47.39 µg/day. This value was divided by the body weight of an adult to determine the upper threshold of As per kg of body weight per day. Utilizing the EPA’s own weight assumptions of 70 kg for an adult male, an upper threshold of 0.68 µg As/kg per day was determined. This model assumes consistent proportions of exposure from water and food for different age groups, which is supported by previous findings that the contribution of tAs by food group does not change significantly after age six (Yost et al. 2004). Age-specific As thresholds were calculated by multiplying the lower derived threshold of 0.68µg As/kg/day by the average weight of both male and female children at each time point as determined by childhood anthropometric reference data collected from the National Health and Nutrition Examination Survey (NHANES) (CDC 2012).
10
daily thresholds of 50 and 70 µg As. The model did not consider any significant exposure from other sources or uncertainty factors, so such values were not included in the three analyses. These values were once again divided by the average weight of an individual (70kg) to produce thresholds of 0.71 and 1.00 µg As/kg bodyweight per day.
Estimation of cancer incidence and mortality
To determine whether levels of As found in rice may be associated with increased incidence of cancer, As levels associated with average daily rice consumption were multiplied by an incremental lifetime cancer risk derived from an EPA oral cancer slope value for As.
Equation 1. Incremental cancer risk (per μg/kg) = CSF (mg/kg-day) × 0.001 ÷ BW where: CSF = oral cancer slope factor; 16.9 and 25.7 for males and females, respectively
0.001 = conversion from milligrams to micrograms BW = body-weight standard of 70 kg utilized by the EPA
11
compared to lifetime cancer risks for various chemicals regulated in drinking water by the EPA (Appendix 4).
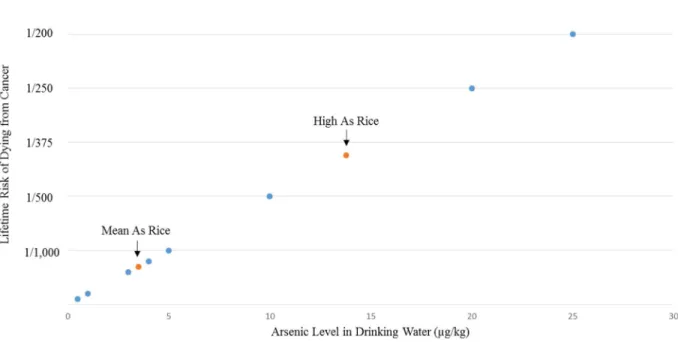
A secondary analysis was carried out to compare these estimated daily exposure values corresponding to mean and high tAs rice (7.0 and 27.6 µg As) to a National Academy of Science’s (NAS) estimation of the lifetime risk of dying from cancer due to contaminated drinking water (NRC 1999). The estimates from NAS utilized a linear dose-response with no biological threshold, so levels of As in drinking water were divided by two to account for the NAS’s underlying assumption of two liters of water consumed per day.
Estimation of urinary excretion of arsenic
Levels of total urinary arsenic (U-tAs), defined as the sum of the arsenicals As(III), MMA(III), MMA(V), DMA(III), and DMA(V), were estimated for an individual consuming a daily national average quantity of rice (7.0 and 27.6 µg As for mean- and high-As rice, respectively). Due to large inter-individual differences in As metabolism and excretion, several coefficient values were selected to estimate the conversion between As consumption and levels of U-tAs. Coefficient values of 0.4, 0.5, 1, 2, and 3 were selected based on reported and calculated coefficients in populations with low As exposure (Biggs et al. 1997, Kurttio et al. 1998, Meza et al. 2004) (Appendix Table S1).
Estimation of in utero exposure
12
simultaneous measurements of As in maternal urine and blood. In order to convert levels of U-tAs to corresponding estimates of maternal blood As levels, conversion factors of 0.03 and 0.09 were utilized based on calculated coefficients from moderately exposed populations (Concha et al. 1998, Hall et al. 2007). Because As readily crosses the placenta, levels of As in cord blood were assumed to be equal to levels in maternal blood based on strong supporting evidence (Concha et al. 1998, Hall et al. 2007, Rudge et al. 2009).
Comparison to Biological Exposure Index, Minimal Risk Level, and Chronic Oral Reference
Dose
E
stimated levels of U-tAs for rice with mean and high tAs content (7.0 and 27.6 µg As)were compared against the Biological Exposure Index (BEI) level of 35 µg As/L (iAs+MMA+DMA) in urine set by the American Conference of Industrial Hygienists (ACGIH). This value represents an upper level of exposure that is unlikely to be associated with non-cancer health effects among occupationally exposed individuals.
13
CHAPTER 3: RESULTS
As and metabolite levels in rice samples
14
Table 1. Arsenic levels in 487 rice samples. Non numerical values, as those below the limit of detection (3 µg/kg) as well as between the limit of detection and the limit of quantification (23 µg/kg) were excluded from the analysis. Data obtained from the FDA (FDA 2011).
tAsa (µg/kg) iAsb (µg/kg) DMAc (µg/kg) MMAd (µg/kg) iAs per Serving (45g)
Average 217 106 104 6 5
Min 47 20 10 3 1
Median 199 99 87 4 4
Max 854 249 687 25 11
SD 118 44 91 5 2
a tAs refers to total arsenic [iAs + DMA(III) + DMA(V) + MMA(III) + MMA(V)] b iAs refers to inorganic arsenic
c DMA refers to dimethylarsenic acid and dimethylarsinous acid
d MMA refers to monomethylarsonic acid and monomethylarsonous acid
As and metabolite levels in rice by country of origin
15
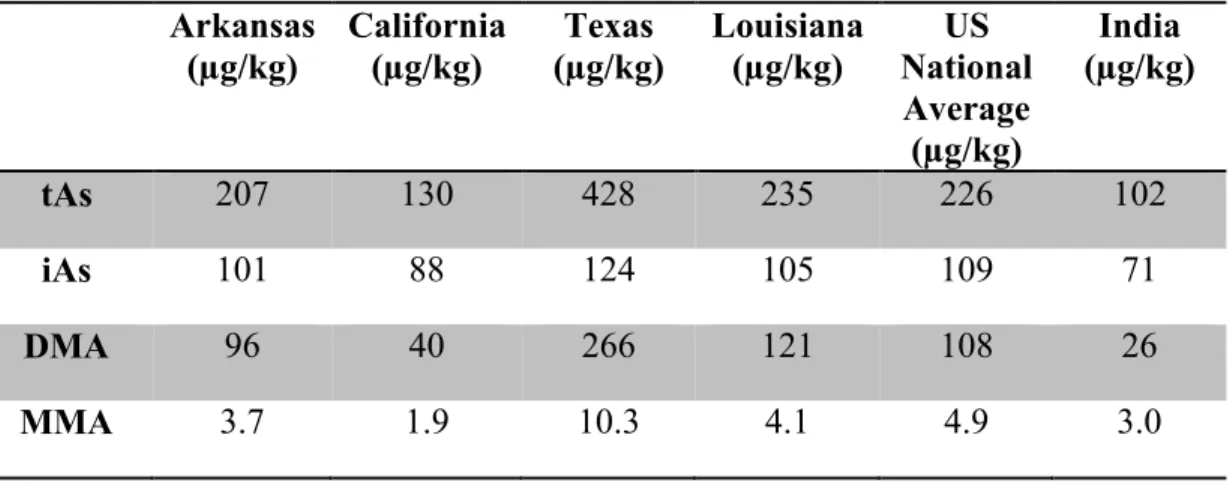
Table 2. Average tAs and arsenical levels by state or country of origin. Country or state of origin refers to information on the packaging label and may not accurately reflect where the rice was grown. Data obtained from the FDA (FDA 2011).
Arkansas (µg/kg) California (µg/kg) Texas (µg/kg) Louisiana (µg/kg) US National Average (µg/kg) India (µg/kg)
tAs 207 130 428 235 226 102
iAs 101 88 124 105 109 71
DMA 96 40 266 121 108 26
MMA 3.7 1.9 10.3 4.1 4.9 3.0
As and metabolite levels in rice species and products
16
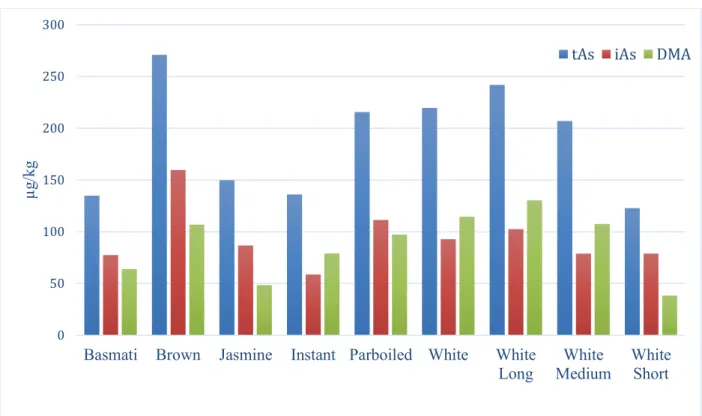
Figure 1. Mean levels of tAs, iAs, and DMA in different rice varieties. Data obtained from the FDA (FDA 2011) for basmati (N=51), brown (N=99), jasmine (N=13), instant (N=14), parboiled (N=34), white (N=251), white long (N=147), white medium (N=81), and white short (N=81).
Modeled daily As maximum allowable dose
Three models were constructed to estimate age-specific As daily thresholds. The first model extrapolated a daily threshold based on the EPA’s MCL for As in drinking water and the proportion of As exposure from drinking water. The second and third models were constructed based on food-associated As values selected by the EPA for sensitivity analysis. Safe consumption thresholds of 0.68, 0.71, and 1.0 µg As/kg/day were determined. Until age 16, female daily As thresholds differed from male thresholds by no more than 3%, so all subsequent analysis were performed using female daily As thresholds (Appendix Figure 2).
As expected, results between modeled thresholds of 0.68 and 0.71 µg As/kg/day were comparable, and a similar trend was noted for a threshold of 1.0 µg As/kg/day. Using the modeled
0 50 100 150 200 250 300
Basmati Brown Jasmine Instant Parboiled White White
Long White Medium White Short µ g /k g
17
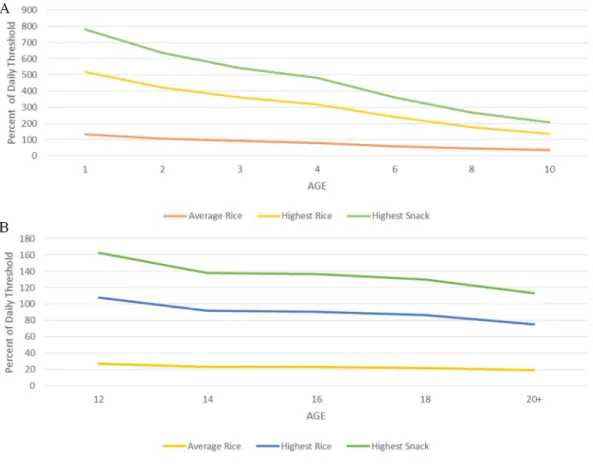
thresholds of 0.68 and 0.71 µg As/kg/day, consumption of a single serving of mean-tAs rice will contribute at least 50% to this modeled threshold for children under eight years of age (or under four years of age using a modeled threshold of 1.0 µg As/kg/day). Based on modeled thresholds of 0.68 and 0.71 µg As/kg/day, consumption of a single serving of rice with high tAs content (27.6 µg As) by children under 14 years old will likely exceed the modeled daily thresholds, and consumption of this rice will exceed 50% of the daily thresholds at any age (Figure 2).
Figure 2. Age-specific As exposure from a serving of rice or a rice product with the mean tAs content or high tAs content (27.6 µg As) for (A) ages 1-10 and (B) ages 12-20+. Percent of modeled daily As threshold based on a threshold of 0.68 µg As/kg/day.
Estimation of excess cancer incidence and mortality in relationship to rice consumption
An estimation of excess cancer incidence associated with lifetime rice consumption was achieved by multiplying an individual’s average daily rice consumption by levels of tAs found in
A
18
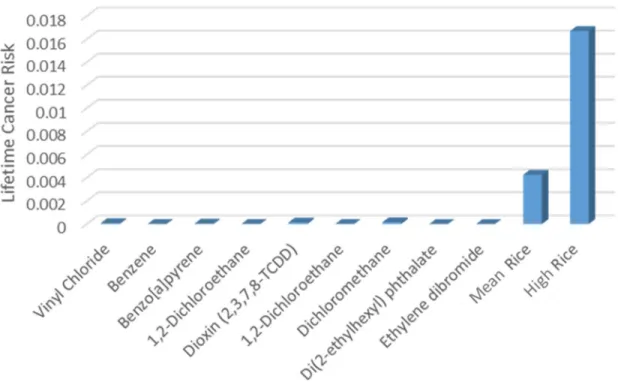
rice. Rice with mean tAs content (217 µg As/kg) vs. high tAs content (854 µg As/kg) yields a daily exposure of 7.0 vs. 27.6 µg As, respectively. These values were then multiplied by a unit risk value of 4.8× 10 for males and 7.3× 10 / μg/kg for females, an estimation of excess cancer incidence attributed to each µg/kg As in consumed drinking water (NRC 1999). As a result, it is estimated that individuals consuming an average quantity of mean-tAs rice (217 µg As/kg) over a lifetime will experience an excess cancer incidence of 1.7× 10 for males and 2.6× 10 for females, or 1.7 and 2.6 in 1,000 individuals, respectively. These numbers equate to a lifetime cancer risk associated with exposure to 3.5 µg As/L in water. For those individuals consuming an average quantity of rice with high-tAs (854 µg As/kg), an excess cancer incidence of 6.6× 10 for males and 1.0× 10 for females, or 6.6 and 10 in 1000 individuals, respectively. These
19
Figure 3. Lifetime risk of cancer for regulated drinking water contaminants and consumption of rice. For regulated chemicals, lifetime consumption of 2 L of water with levels of the contaminant equal to the EPA’s MCL was assumed.
20
Figure 4. Estimated lifetime risk of dying from cancer associated with a lifetime daily average consumption of rice with mean and high tAs content (7.0 and 27.6 µg As, respectively) plotted against estimated lifetime risk of dying from cancer associated with drinking water with variable As content. Estimations of lifetime risk of dying from cancer for different As water standards were obtained from the NAS (NRC 1999).
Estimation of in U-tAs and in utero exposure
Values for rice with mean and high tAs content (7.0 and 27.6 µg As, respectively), were multiplied by the conversion factors 0.4, 0.5, 1, 2, and 3, representing the conversion of oral As exposure into estimated levels of U-tAs. U-tAs values ranging from 2.8-21 µg/L were determined for rice samples with an As content of 7.0 µg As, and values between 11 and 82.8 µg/L were determined for rice samples with an As content of 27.6 µg As.
21
2007). The estimated range of maternal blood As levels associated with consumption of rice with mean tAs content ranged from 0.084-2.5 µg/L and the range associated with consumption of high-tAs rice was 0.25-7.5 µg As/L. Because As levels in maternal blood are linearly associated with levels in fetal cord blood (Concha et al. 1998, Rudge et al. 2009), cord blood levels of As were assumed to be consistent with the measured maternal blood levels.
Comparison to BEI, MRL, and RfD
The range of predicted U-tAs associated with a single serving of rice with mean and high- tAs content was 2.8-21 and 11-82.8 µg As/L, respectively. As a result, a urine sample taken after consumption of a single serving of rice with high-tAs content may surpass the BEI level of 35 µg/L when a coefficient greater than one is utilized. While such a conversion factor may not be applicable to the entire population, inter-individual differences in As metabolism suggest that in a segment of the population urine As level could exceed the BEI value following consumption of a single serving of high-tAs rice. In addition, it is likely that exposure to As from other sources including other foods, beverages, and water may increase the likelihood of exceeding the BEI value.
As expected, both the MRL and RfD values of 0.3 µg As/kg/day are lower than any of the
22
serving of rice with the mean tAs content will likely exceed the MRL and RfD while U-tAs levels of individuals at any age consuming a single serving of rice with high tAs content are likely to exceed the MRL and RfD level (Figure 5).
23
CHAPTER 4: DISCUSSION
Because iAs is an IARC Group 1 carcinogen and developmental toxicant, exposure to iAs from any source, including food, presents a serious health concern. Children are especially vulnerable to the health effects caused by exposure to iAs, as they consume more food proportional to their body weight than adults, are more sensitive to the adverse developmental effects of iAs (Davis et al. 2012), and can be at risk for long-term health effects (EPA 2013). While much research and legislation has gone into limiting As exposure from water, and now juices (FDA 2013), no such standardized action levels currently exist for solid foods. In the present work, speciated As testing performed by the FDA was analyzed to quantify levels of iAs and the metabolites DMA and MMA in rice and rice-products. The results were then compared against modeled age-specific daily thresholds to determine whether consumption of a single serving of rice or rice-based products could significantly contribute to an individual’s tAs exposure. In addition, the tAs content of the rice-based samples was analyzed to determine if exposure to such products during childhood could significantly contribute to As exposure at levels associated with the development of disease.
24
2012, Jackson et al. 2012). In addition, research has pointed to an increase in U-tAs among pregnant women consuming rice compared to pregnant women who did not report rice consumption (Gilbert-Diamond et al. 2011b). Based on the adverse health effects observed in infants before and after birth (Rahman et al. 2011, Kippler et al. 2012), levels of As in an infants or pregnant women’s diet may play a critical role in the future development of disease. This is particularly worrisome, as As readily crosses the placenta, and cord blood As levels closely mirror levels found in the mother’s whole blood (Concha et al. 1998, Rudge et al. 2009). While additional data would be needed to accurately estimate if the rice consumption of women differs from the general population during pregnancy, analysis of the As content of rice in the present work suggests that in utero exposure to As may be high, with estimated cord blood As levels of 0.084-2.5 µg/L and 0.25-7.5 µg/L associated with mean (7.0 µg As) and high tAs (27.6 µg As) consumption, respectively. However, additional studies are needed, as As in the blood is cleared quickly and, therefore, peripheral or cord blood As level may not be the best measure to estimate chronic in utero As exposure due to large fluctuations in measured As levels (Mann et al. 1996).
25
is particularly worrisome, because the brain and nervous system of children continue to develop and are, therefore, particularly vulnerable to the effects of toxicants (reviewed in (Vahter 2008, IARC 2012).
When the FDA records were analyzed with regard to country of origin, trends were apparent. Rice originating in the US had higher tAs and iAs content, a finding both consistent with previous geographic distribution studies (Zavala et al. 2008, Meharg et al. 2009), and at odds with other studies that have shown that rice grown in Asia has higher iAs levels than rice grown in the US (Williams et al. 2005, Meharg et al. 2008). In addition, the results from the present study suggest that in US-grown rice contains equal amounts of iAs and DMA, a finding at odds with published research that suggests that As in US-grown rice tends to be primarily DMA, with a smaller percentage of iAs (Zhao 2013). In addition to country-specific trends, rice originating in Texas had higher levels of iAs, MMA, and DMA than rice in California, Louisiana, or Arkansas. However, caution should be taken when trying to draw any inferences from these seemingly contradictory results, as the state of origin may not correspond to the state where the rice was actually grown, and may help to explain why the results from the current work are not always consistent with other published studies.
26
as polished white rice (Rahman et al. 2007). In addition, differences in arsenical concentrations may be due to inter-species and inter-genotype differences in which different rice varieties accumulate or metabolize As at different rates (Abedin et al. 2002a, Abedin et al. 2002b, Williams et al. 2005, Liu et al. 2006, Ma et al. 2008). In addition, the present of environmental factors such as concentrations of silicon or phosphate in the soil can affect the accumulation of arsenicals (Williams et al. 2005).
The three daily exposure thresholds calculated in the present work (0.68, 0.71, and 1.0 µg As/kg/day) were two to three times higher than the MRL and RfD value of 0.3 µg As/kg/day from the ATSDR and EPA. Although values utilized in the present work are based on extrapolations of the EPA’s As drinking water standard and assumed food-based As values, it must be noted that the current EPA limit for As in drinking water includes results from feasibility studies assessing the economic cost to community water suppliers of reducing the level below 10 µg/L (EPA 2000). As a result, comparing the levels of As found in rice to the current MCL may not truly reflect a benchmark of levels of “safe” As exposure, but rather, simply a comparison to the current legal standard.
27
(27.6 µg As), even rice with the mean tAs content (7.0 µg As) is predicted to be associated with cancer risks at levels much higher than any substances currently regulated by the EPA. In addition, these values are based on average national consumption of rice and do not accurately reflect the range of cancer risk for populations consuming larger quantities of rice. In addition to populations consuming larger quantities of rice for dietary reasons, such as individuals with celiac disease or individuals on a gluten-free diet, there is also a high variability in rice consumption between different ethnicities. For example, populations such as Asian Americans and American Indians reported consuming up to six times the national average (Batres-Marquez et al. 2009, Cleland et al. 2009).
28
CHAPTER 5: LIMITATIONS, FUTURE DIRECTIONS AND CONCLUSIONS
Further studies
Given the levels of As present in rice, which is available for purchase in the United States, and the later-life health effects associate with these levels, it is clear that further studies are warranted. First, additional studies are needed to accurately estimate both childhood and adult rice consumption from all sources, including rice-based products. While large national surveys such as NHANES routinely ask participants about their rice consumption, limited data exists concerning quantity, and the results do not accurately reflect consumption of rice-based products. In addition to the NHANES data, studies that routinely estimate childhood consumption of particular foods often neglect to ascertain rice consumption, and those that do are particularly scarce. Given the elevated levels of As present in rice-based products such as cereals, snacks, and energy bars, additional studies are needed to quantify the As exposure from these seldom-studied products in an individual’s diet. As an example of the need for further research, an often-cited study estimating childhood consumption-based As exposure utilizes a value of 3.2 µg iAs per day (Yost et al. 2004), although as the present study demonstrates, a single serving of rice or rice-based products such as cereal can, and often will, exceed this daily estimate.
29
100,000 was estimated due to United States apple juice consumption with As levels below 10 µg/L (FDA 2013a). Based on the data in the present work, the average iAs content of rice is twenty-four times higher than the average iAs content found in apple juice (FDA 2013a). Given this proportion, as well as the lifetime frequency and ubiquity of rice consumption, it stands to reason that either an action level for rice or dietary recommendations concerning the frequency of rice consumption are warranted.
Limitations
While the data presented suggest that As exposure via rice consumption is of concern, there are several critiques and limitations of the present work. First, the model that derived a daily threshold of 0.68 µg/kg assumes that the EPA guidelines regarding As were created to limit exposure to As in water proportional to all other sources of exposure. While the use of a historical proportional constant for As exposure associated with water may be incorrect in light of the current work, the value is very close to one of the daily thresholds (0.71 µg/kg) based on values agreed to by the EPA’s limit derived from their risk assessment. Within the United States, drinking water was considered one of the primary sources of exposure to As and, therefore, the regulation of As levels in drinking water was likely viewed as an effective means of regulating total As exposure (NRC 1999). However, if rice consumption is associated with higher As exposure than previously thought, it seems prudent that additional research is conducted to determine new values that are more protective for children and adults.
30
31 Conclusion
32
APPENDIX 1: TABLE 1
Appendix Table 1. Sources used to estimate coefficients factors in the conversion of As consumption to U-tAs. Because excretion of As in urine is dependent on inter-individual differences in As metabolism, five values were utilized for sensitivity analysis purposes.
Coefficient Source As dose (µg) U-tAs (µg/L) U-tAs/As
0.4 (Meza et al. 2004) 665 (405-1192) 240 (51-500) 0.36
(Kurttio et al. 1998) 1489.9 (16.2-4905.4) 582.4 (61.2-1892.6) 0.39
0.5 (Kurttio et al. 1998) 20 (13-27) 9 (3-34) 0.48
1 (Meza et al. 2004) 65.5 (18–108) 64.5 (46-90.6) 0.98
2 (Biggs et al. 1997) 29.8 (11.5-78.3) 58.8 (4.4-266.5) 1.97
33
APPENDIX 2: FIGURE 1
Appendix Figure 1. Average levels of tAs and iAs in various rice-based products. Data obtained from the FDA (FDA 2011) for rice cakes (N=59), snacks (N=190), mixes and pudding (N=36), beverages (N=222), ready to eat cereal (N=110), infant and toddler cereal (N=85), cereal (N=195), cookies (N=43), dietary supplements (N=12), grain based bars (N=115), and pasta (N=23).
0 50 100 150 200 250 300
µ
g
/
k
g
34
APPENDIX 3: FIGURE 2
35
APPENDIX 4: TABLE 2
Appendix Table 2. Derivation of the lifetime cancer risk associated with exposure to chemicals in drinking water at MCL levels. To compare against lifetime cancer risk associated with consumption of mean (7.0 µg As) and high tAs rice (27.6 µg As), MCLs were multiplied by drinking water unit risk to determine the associated lifetime cancer risk.
MCL (mg/L) MCL (µg/L)
Drinking Water Unit Risk (per µg/L)
Cancer Incidence
Vinyl Chloride 0.002 2 4.2E-05 8.4E-05
Benzene 0.005 5 1.6E-06 8.0E-06
Benzo[a]pyrene 2.0E-04 0.2 2.1E-04 4.2E-05
1,2-Dichloroethane 0.005 5 2.6E-06 1.3E-05
Dioxin
(2,3,7,8-TCDD) 3.0E-08 3.0E-05 4.5 1.4E-04
1,2-Dichloroethane 0.005 5 2.6E-06 1.3E-05
Dichloromethane 0.005 5 3.0E-05 1.5E-04
Di(2-ethylhexyl)
phthalate 0.006 6 4.0E-07 2.4E-06
Ethylene
36 REFERENCES
Abedin, M. J., M. S. Cresser, A. A. Meharg, J. Feldmann and J. Cotter-Howells (2002a).
"Arsenic accumulation and metabolism in rice (Oryza sativa L.)." Environmental Science & Technology 36(5): 962-968.
Abedin, M. J., J. Feldmann and A. A. Meharg (2002b). "Uptake kinetics of arsenic species in rice plants." Plant Physiol 128(3): 1120-1128.
Adair, B. M., S. B. Waters, V. Devesa, Z. Drobna, M. Styblo and D. J. Thomas (2005).
"Commonalities in metabolism of arsenicals." Environmental Chemistry 2(3): 161-166. Alarifi, S., D. Ali, S. Alkahtani, M. A. Siddiqui and B. A. Ali (2013). "Arsenic trioxide-mediated
oxidative stress and genotoxicity in human hepatocellular carcinoma cells." Onco Targets Ther 6: 75-84.
Bailey, K. A., J. Laine, J. E. Rager, E. Sebastian, A. Olshan, L. Smeester, Z. Drobná, M. Stýblo, M. Rubio-Andrade and G. García-Vargas (2014). "Prenatal Arsenic Exposure and Shifts in the Newborn Proteome: Inter-Individual Differences in Tumor Necrosis Factor (TNF)-Responsive Signaling." Toxicological Sciences: kfu053.
Bailey, K. A., M. C. Wu, W. O. Ward, L. Smeester, J. E. Rager, G. Garcia-Vargas, L. M. Del Razo, Z. Drobna, M. Styblo and R. C. Fry (2013). "Arsenic and the epigenome: interindividual differences in arsenic metabolism related to distinct patterns of DNA methylation." J Biochem Mol Toxicol 27(2): 106-115.
Barouki, R., P. D. Gluckman, P. Grandjean, M. Hanson and J. J. Heindel (2012).
"Developmental origins of non-communicable disease: implications for research and public health." Environ Health 11: 42.
Batres-Marquez, S. P., H. H. Jensen and J. Upton (2009). "Rice consumption in the United States: recent evidence from food consumption surveys." Journal of the American Dietetic Association 109(10): 1719-1727.
Biggs, M. L., D. A. Kalman, L. E. Moore, C. Hopenhayn-Rich, M. T. Smith and A. H. Smith (1997). "Relationship of urinary arsenic to intake estimates and a biomarker of effect, bladder cell micronuclei." Mutation Research/Reviews in Mutation Research 386(3): 185-195.
Bloom, D. (2014). The Trouble With Rice. New York Times.
Carbonell-Barrachina, Á. A., X. Wu, A. Ramírez-Gandolfo, G. J. Norton, F. Burló, C. Deacon and A. A. Meharg (2012). "Inorganic arsenic contents in rice-based infant foods from Spain, UK, China and USA." Environmental Pollution 163: 77-83.
37
Chen, Z., Y. G. Zhu, W. J. Liu and A. A. Meharg (2005). "Direct evidence showing the effect of root surface iron plaque on arsenite and arsenate uptake into rice (Oryza sativa) roots." New Phytologist 165(1): 91-97.
Chowdhury, U. K., B. K. Biswas, T. R. Chowdhury, G. Samanta, B. K. Mandal, G. C. Basu, C. R. Chanda, D. Lodh, K. C. Saha, S. K. Mukherjee, S. Roy, S. Kabir, Q. Quamruzzaman and D. Chakraborti (2000). "Groundwater arsenic contamination in Bangladesh and West Bengal, India." Environ Health Perspect 108(5): 393-397.
Cleland, B., A. Tsuchiya, D. A. Kalman, R. Dills, T. M. Burbacher, J. W. White, E. M. Faustman and K. Mariën (2009). "Arsenic exposure within the Korean community (United States) based on dietary behavior and arsenic levels in hair, urine, air, and water." Environmental health perspectives 117(4): 632.
Concha, G., G. Vogler, D. Lezcano, B. Nermell and M. Vahter (1998). "Exposure to inorganic arsenic metabolites during early human development." Toxicological sciences 44(2): 185-190.
Currier, J. M., M. C. Ishida, C. González-Horta, B. Sánchez-Ramírez, L. Ballinas-Casarrubias, D. S. Gutiérrez-Torres, R. H. Cerón, D. V. Morales, F. A. B. Terrazas and L. M. Del Razo (2014). "Associations between arsenic species in exfoliated urothelial cells and prevalence of diabetes among residents of Chihuahua, Mexico." Environmental health perspectives 122(10): 1088.
Davis, M. A., T. A. Mackenzie, K. L. Cottingham, D. Gilbert-Diamond, T. Punshon and M. R. Karagas (2012). "Rice consumption and urinary arsenic concentrations in U.S. children." Environ Health Perspect 120(10): 1418-1424.
Duan, G. L., Y. Zhou, Y. P. Tong, R. Mukhopadhyay, B. P. Rosen and Y. G. Zhu (2007). "A CDC25 homologue from rice functions as an arsenate reductase." New Phytologist 174(2): 311-321.
EPA (2000). Environmental Protection Agency. Arsenic in Drinking Water Rule Economic Analysis
EPA (2010). Environmental Protection Agency (EPA). Toxicological Review of Inorganic Arsenic.
EPA (2013). Enviornmental Protection Agency. America's Children and the Enviorment. r. Edition. Washington, DC.
Farzan, S. F., S. Korrick, Z. Li, R. Enelow, A. J. Gandolfi, J. Madan, K. Nadeau and M. R. Karagas (2013). "In utero arsenic exposure and infant infection in a United States cohort: A prospective study." Environmental research 126: 24-30.
38
http://www.fda.gov/Food/FoodSafety/FoodContaminantsAdulteration/Metals/ucm280202
.htm.
FDA (2013a). "Food and Drug Administration. A Quantitative Assessment of Inorganic Arsenic in Apple Juice." Draft Report.
FDA (2013b). "Food and Drug Administration. FDA proposes “action level” for arsenic in apple juice."
Gilbert-Diamond, D., K. L. Cottingham, J. F. Gruber, T. Punshon, V. Sayarath, A. J. Gandolfi, E. R. Baker, B. P. Jackson, C. L. Folt and M. R. Karagas (2011a). "Rice consumption
contributes to arsenic exposure in US women." Proc Natl Acad Sci U S A 108(51): 20656-20660.
Gilbert-Diamond, D., K. L. Cottingham, J. F. Gruber, T. Punshon, V. Sayarath, A. J. Gandolfi, E. R. Baker, B. P. Jackson, C. L. Folt and M. R. Karagas (2011b). "Rice consumption contributes to arsenic exposure in US women." Proceedings of the National Academy of Sciences.
Guo, W., Y.-G. Zhu, W.-J. Liu, Y.-C. Liang, C.-N. Geng and S.-G. Wang (2007). "Is the effect of silicon on rice uptake of arsenate (As V) related to internal silicon concentrations, iron plaque and phosphate nutrition?" Environmental Pollution 148(1): 251-257.
Hall, M., M. Gamble, V. Slavkovich, X. Liu, D. Levy, Z. Cheng, A. Van Geen, M. Yunus, M. Rahman and J. R. Pilsner (2007). "Determinants of arsenic metabolism: blood arsenic metabolites, plasma folate, cobalamin, and homocysteine concentrations in maternal-newborn pairs." Environmental health perspectives: 1503-1509.
Healy, S. M., R. A. Zakharyan and H. V. Aposhian (1997). "Enzymatic methylation of arsenic compounds: IV. In vitro and in vivo deficiency of the methylation of arsenite and monomethylarsonic acid in the guinea pig." Mutat Res 386(3): 229-239.
IARC (2012). International Agency for Research on Cancer. Monographs on the Evaluation of Carcinogenic Risk to Humans. A Review of Human Carcinogens: Arsenic, Metals Fibers and Dusts. 100C.
Jackson, B. P., V. F. Taylor, T. Punshon and K. L. Cottingham (2012). "Arsenic concentration and speciation in infant formulas and first foods." Pure and Applied Chemistry 84(2): 215-223.
Kippler, M., Y. Wagatsuma, A. Rahman, B. Nermell, L. A. Persson, R. Raqib and M. Vahter (2012). "Environmental exposure to arsenic and cadmium during pregnancy and fetal size: a longitudinal study in rural Bangladesh." Reprod Toxicol 34(4): 504-511.
Kurttio, P., H. Komulainen, E. Hakala, H. Kahelin and J. Pekkanen (1998). "Urinary excretion of arsenic species after exposure to arsenic present in drinking water." Archives of
39
Laparra, J. M., D. Velez, R. Barbera, R. Farre and R. Montoro (2005). "Bioavailability of inorganic arsenic in cooked rice: practical aspects for human health risk assessments." J Agric Food Chem 53(22): 8829-8833.
Li, R.-Y., Y. Ago, W.-J. Liu, N. Mitani, J. Feldmann, S. P. McGrath, J. F. Ma and F.-J. Zhao (2009). "The rice aquaporin Lsi1 mediates uptake of methylated arsenic species." Plant Physiology 150(4): 2071-2080.
Lihong, W. and D. Guilan (2009). "Effect of external and internal phosphate status on arsenic toxicity and accumulation in rice seedlings." Journal of Environmental Sciences 21(3): 346-351.
Liu, W., Y. Zhu, Y. Hu, P. Williams, A. Gault, A. Meharg, J. Charnock and F. Smith (2006). "Arsenic sequestration in iron plaque, its accumulation and speciation in mature rice plants (Oryza sativa L.)." Environmental science & technology 40(18): 5730-5736. Loffredo, C. A., H. V. Aposhian, M. E. Cebrian, H. Yamauchi and E. K. Silbergeld (2003).
"Variability in human metabolism of arsenic." Environmental research 92(2): 85-91. Ma, J. F., N. Yamaji, N. Mitani, X.-Y. Xu, Y.-H. Su, S. P. McGrath and F.-J. Zhao (2008).
"Transporters of arsenite in rice and their role in arsenic accumulation in rice grain." Proceedings of the National Academy of Sciences 105(29): 9931-9935.
Mann, S., P.-O. Droz and M. Vahter (1996). "A physiologically based pharmacokinetic model for arsenic exposure: II. Validation and application in humans." Toxicology and applied pharmacology 140(2): 471-486.
Meacher, D. M., D. B. Menzel, M. D. Dillencourt, L. F. Bic, R. A. Schoof, L. J. Yost, J. C. Eickhoff and C. H. Farr (2002). "Estimation of multimedia inorganic arsenic intake in the US population." Human and Ecological Risk Assessment 8(7): 1697-1721.
Meharg, A. A. (2004). "Arsenic in rice--understanding a new disaster for South-East Asia." Trends Plant Sci 9(9): 415-417.
Meharg, A. A., E. Lombi, P. N. Williams, K. G. Scheckel, J. Feldmann, A. Raab, Y. Zhu and R. Islam (2008). "Speciation and localization of arsenic in white and brown rice grains." Environmental Science & Technology 42(4): 1051-1057.
Meharg, A. A., P. N. Williams, E. Adomako, Y. Y. Lawgali, C. Deacon, A. Villada, R. C. J. Cambell, G. Sun, Y.-G. Zhu, J. Feldmann, A. Raab, F.-J. Zhao, R. Islam, S. Hossain and J. Yanai (2009). "Geographical Variation in Total and Inorganic Arsenic Content of Polished (White) Rice." Environmental Science & Technology 43(5): 1612-1617. Meharg, A. A. and F.-J. Zhao (2012). Arsenic & rice, Springer Science & Business Media. Meza, M. M., M. J. Kopplin, J. L. Burgess and A. J. Gandolfi (2004). "Arsenic drinking water
40
Munera-Picazo, S., F. Burló and Á. A. Carbonell-Barrachina (2014a). "Arsenic speciation in rice-based food for adults with celiac disease." Food Additives & Contaminants: Part A 31(8): 1358-1366.
Munera-Picazo, S., A. Ramírez‐Gandolfo, F. Burló and Á. A. Carbonell‐Barrachina (2014b).
"Inorganic and Total Arsenic Contents in Rice‐Based Foods for Children with Celiac
Disease." Journal of food science 79(1): T122-T128.
Nordstrom, D. K. (2002). "Public health. Worldwide occurrences of arsenic in ground water." Science 296(5576): 2143-2145.
Norton, G. J., D. E. Lou-Hing, A. A. Meharg and A. H. Price (2008). "Rice–arsenate interactions in hydroponics: whole genome transcriptional analysis." Journal of experimental botany 59(8): 2267-2276.
Norton, G. J., S. R. Pinson, J. Alexander, S. McKay, H. Hansen, G. L. Duan, M. Rafiqul Islam, S. Islam, J. L. Stroud, F. J. Zhao, S. P. McGrath, Y. G. Zhu, B. Lahner, E. Yakubova, M. L. Guerinot, L. Tarpley, G. C. Eizenga, D. E. Salt, A. A. Meharg and A. H. Price (2012). "Variation in grain arsenic assessed in a diverse panel of rice (Oryza sativa) grown in multiple sites." New Phytol 193(3): 650-664.
NRC (1999). National Research Council (US) Subcommittee on Arsenic in Drinking Water., National Academies Press (US).
Rager, J. E., K. A. Bailey, L. Smeester, S. K. Miller, J. S. Parker, J. E. Laine, Z. Drobná, J. Currier, C. Douillet and A. F. Olshan (2014). "Prenatal arsenic exposure and the
epigenome: Altered microRNAs associated with innate and adaptive immune signaling in newborn cord blood." Environmental and molecular mutagenesis 55(3): 196-208.
Rahman, A., M. Vahter, E. C. Ekstrom and L. A. Persson (2011). "Arsenic exposure in pregnancy increases the risk of lower respiratory tract infection and diarrhea during infancy in Bangladesh." Environ Health Perspect 119(5): 719-724.
Rahman, M. A., H. Hasegawa, M. M. Rahman, M. A. Rahman and M. Miah (2007).
"Accumulation of arsenic in tissues of rice plant (Oryza sativa L.) and its distribution in fractions of rice grain." Chemosphere 69(6): 942-948.
Ren, X., C. M. McHale, C. F. Skibola, A. H. Smith, M. T. Smith and L. Zhang (2010). "An emerging role for epigenetic dysregulation in arsenic toxicity and carcinogenesis." Environmental health perspectives 119(1): 11-19.
Reports, C. (2014). "How much arsenic is in your rice?", from
http://www.consumerreports.org/cro/magazine/2015/01/how-much-arsenic-is-in-your-rice/index.htm.
41
Rudge, C. V., H. B. Röllin, C. M. Nogueira, Y. Thomassen, M. C. Rudge and J. Ø. Odland (2009). "The placenta as a barrier for toxic and essential elements in paired maternal and cord blood samples of South African delivering women." Journal of Environmental Monitoring 11(7): 1322-1330.
Sanders, A. P., K. P. Messier, M. Shehee, K. Rudo, M. L. Serre and R. C. Fry (2012). "Arsenic in North Carolina: public health implications." Environ Int 38(1): 10-16.
Schoof, R. A., L. J. Yost, J. Eickhoff, E. A. Crecelius, D. W. Cragin, D. M. Meacher and D. B. Menzel (1999). "A market basket survey of inorganic arsenic in food." Food Chem Toxicol 37(8): 839-846.
Smeester, L., J. E. Rager, K. A. Bailey, X. Guan, N. Smith, G. Garcia-Vargas, L. M. Del Razo, Z. Drobna, H. Kelkar, M. Styblo and R. C. Fry (2011). "Epigenetic changes in
individuals with arsenicosis." Chem Res Toxicol 24(2): 165-167.
Smith, A. H., G. Marshall, J. Liaw, Y. Yuan, C. Ferreccio and C. Steinmaus (2012). "Mortality in young adults following in utero and childhood exposure to arsenic in drinking water." Environ Health Perspect 120(11): 1527-1531.
Sohel, N., L. A. Persson, M. Rahman, P. K. Streatfield, M. Yunus, E. C. Ekstrom and M. Vahter (2009). "Arsenic in drinking water and adult mortality: a population-based cohort study in rural Bangladesh." Epidemiology 20(6): 824-830.
States, J. C., S. Srivastava, Y. Chen and A. Barchowsky (2009). "Arsenic and cardiovascular disease." Toxicol Sci 107(2): 312-323.
Steinmaus, C. M., C. Ferreccio, J. Acevedo Romo, Y. Yuan, S. Cortes, G. Marshall, L. E.
Moore, J. R. Balmes, J. Liaw, T. Golden and A. H. Smith (2013). "Drinking water arsenic in northern Chile: high cancer risks 40 years after exposure cessation." Cancer Epidemiol Biomarkers Prev.
Styblo, M., L. M. Del Razo, L. Vega, D. R. Germolec, E. L. LeCluyse, G. A. Hamilton, W. Reed, C. Wang, W. R. Cullen and D. J. Thomas (2000). "Comparative toxicity of trivalent and pentavalent inorganic and methylated arsenicals in rat and human cells." Arch Toxicol 74(6): 289-299.
Su, Y.-H., S. P. McGrath and F.-J. Zhao (2010). "Rice is more efficient in arsenite uptake and translocation than wheat and barley." Plant and Soil 328(1-2): 27-34.
Tokar, E. J., W. Qu and M. P. Waalkes (2011). "Arsenic, stem cells, and the developmental basis of adult cancer." Toxicol Sci 120 Suppl 1: S192-203.
Tuli, R., D. Chakrabarty, P. K. Trivedi and R. D. Tripathi (2010). "Recent advances in arsenic accumulation and metabolism in rice." Molecular Breeding 26(2): 307-323.
42
Vahter, M. (2008). "Health effects of early life exposure to arsenic." Basic Clin Pharmacol Toxicol 102(2): 204-211.
WHO (2008). "Wold Health Organization. Guidelines for drinking water quality, First Addendum to 3rd edn." 1.
Williams, P., A. Price, A. Raab, S. Hossain, J. Feldmann and A. Meharg (2005). "Variation in arsenic speciation and concentration in paddy rice related to dietary exposure."
Environmental Science & Technology 39(15): 5531-5540.
Xu, X., S. McGrath, A. Meharg and F. Zhao (2008). "Growing rice aerobically markedly decreases arsenic accumulation." Environmental Science & Technology 42(15): 5574-5579.
Xu, X., S. McGrath and F. Zhao (2007). "Rapid reduction of arsenate in the medium mediated by plant roots." New Phytologist 176(3): 590-599.
Xue, J., V. Zartarian, S. W. Wang, S. V. Liu and P. Georgopoulos (2010). "Probabilistic Modeling of Dietary Arsenic Exposure and Dose and Evaluation with 2003-2004 NHANES Data." Environ Health Perspect 118(3): 345-350.
Yost, L., S.-H. Tao, S. Egan, L. Barraj, K. Smith, J. Tsuji, Y. Lowney, R. Schoof and N. Rachman (2004). "Estimation of dietary intake of inorganic arsenic in US children." Human and Ecological Risk Assessment 10(3): 473-483.
Zavala, Y. J. and J. M. Duxbury (2008). "Arsenic in rice: I. Estimating normal levels of total arsenic in rice grain." Environmental Science & Technology 42(10): 3856-3860. Zhang, J., Q.-Z. Zhao, G.-L. Duan and Y.-C. Huang (2011). "Influence of sulphur on arsenic
accumulation and metabolism in rice seedlings." Environmental and Experimental Botany 72(1): 34-40.