QUEUING SYSTEMS WITH STRATEGIC AND LEARNING CUSTOMERS
Yichen Tu
A dissertation submitted to the faculty of the University of North Carolina at Chapel Hill in
partial fulfillment of the requirements for the degree of Doctor of Philosophy in the Department
of Statistics and Operations Research.
Chapel Hill
2019
Approved by:
Nur Sunar
Serhan Ziya
Nilay Tanik Argon
Chuanshu Ji
c
2019
Yichen Tu
ABSTRACT
YICHEN TU: QUEUING DESIGN WHEN CUSTOMERS ARE STRATEGIC
(Under the direction of Nur Sunar and Serhan Ziya)
In many service systems customers are strategic and can make their own decisions. In particular,
customers can be delay-sensitive and they will leave the system if they think the waiting time is too
long. For the service provider, it is important to understand customers’ behaviors and choose the
appropriate system design. This dissertation consists of two research projects.
The first project studies the pooling decision when customers are strategic. It is generally
accepted that operating with a combined (i.e., pooled) queue rather than separate (i.e., dedicated)
queues is beneficial mainly because pooling queues reduces long-run average sojourn time. In fact,
this is a well-established result in the literature when jobs cannot make decisions and servers and
jobs are identical. An important corollary of this finding is that pooling queues improves social
welfare in the aforementioned setting. We consider an observable multi-server queueing system
which can be operated with either dedicated queues or a pooled one. Customers are delay-sensitive
and they decide to join or balk based on queue length information upon arrival. In this setting, we
prove that, contrary to the common understanding, pooling queues can considerably increase the
long-run average sojourn time so that the pooled system results in strictly smaller social welfare (and
strictly smaller consumer surplus) than the dedicated system under certain conditions. Specifically,
pooling queues leads to performance loss when the arrival-rate-to-service-rate ratio and the relative
benefit of service are both large. We also prove that performance loss due to pooling queues can be
significant. Our numerical studies demonstrate that pooling queues can decrease the social welfare
(and the consumer surplus) by more than 95%. The benefit of pooling is commonly believed to
increase with the system size. In contrast to this belief, our analysis shows that when delay-sensitive
customers make rational joining decisions, the magnitude of the performance loss due to pooling
can strictly increase with the system size.
The second project studies the learning behavior when customers don’t have full information
of the service speed. We consider a single-server queueing system where customers make
join-ing and abandonment decisions when the service rate is unknown. We study different ways in
which customers process service-related information, and how these impact the performance of a
service provider. Specifically, we analyze forward-looking, myopic and naive information
process-ing behaviors by customers. Forward-lookprocess-ing customers learn about the service rate in a Bayesian
framework by using their observations while waiting in the queue. Moreover, they make their
abandonment decisions considering both belief and potential future payoffs. On the other hand,
naive customers ignore the available information when they make their decisions. We prove that
regardless of the way in which the information is processed by customers, a customer’s optimal
joining and abandonment policy is of threshold-type. There is a rich literature that establishes that
forward-looking customers are detrimental to a firm in settings different than queueing. In contrast
to this common understanding, we prove that for service systems, forward-looking customers are
beneficial to the firm under certain conditions.
ACKNOWLEDGEMENTS
Over the past five years, I have received a lot of help and support at UNC. I am grateful to all the people
who have helped me during this journey. Firstly, I want to thank my advisors, Professor Serhan Ziya and
Professor Nur Sunar, for their generous guidance and support. You have also set an example of excellence as
a researcher, teacher and role model. Without your continuous help and support, I will not able to finish this
thesis. I also would like to thank Professor Chuanshu Ji, Professor Nilay Argon, and Professor Vidyadhar
Kulkarni for serving on my thesis committee and providing great advice on my thesis. I also want to thank
my fellow graduate students who help me and support me during this long journey.
TABLE OF CONTENTS
LIST OF TABLES . . . .
x
LIST OF FIGURES . . . .
xi
1
Introduction . . . .
1
2
Pooled or Dedicated Queues when Customers are Delay-Sensitive . . . .
5
2.0.1
Summary of Main Results . . . .
5
2.0.2
Relevant Literature . . . .
6
2.0.3
Outline of the Paper . . . .
9
2.1
Model . . . 10
2.1.1
Preliminary Analysis . . . 12
2.2
Analysis . . . 13
2.2.1
Explanation of Theorem 1 . . . 14
2.2.2
Numerical Comparison of the Pooled and Dedicated Systems . . . 17
2.2.3
The Impact of Benefit
R
and Number of Servers
N
. . . 20
2.3
Extensions . . . 23
2.3.1
Fixed Price . . . 23
2.3.2
Optimal Pricing . . . 24
2.3.3
Join-the-Shortest-Queue Policy . . . 25
2.3.4
Partial Pooling . . . 28
2.3.5
Unobservable System . . . 31
2.3.6
Observability as a System Feature . . . 33
3
Dynamic Learning and Rational Customers in Services . . . 36
3.0.1
Summary of Main Results and Insights . . . 36
3.0.2
Relevant Literature . . . 37
3.0.3
Outline of the Section . . . 38
3.1
Model . . . 39
3.2
Preliminary Analysis . . . 40
3.2.1
Forward-Looking Customer . . . 41
3.2.2
Myopic Customer . . . 41
3.2.3
Naive Customer . . . 42
3.3
Analysis . . . 42
3.4
Throughput comparison . . . 45
3.5
Value of Learning For Customers . . . 49
3.5.1
Impact of
y
. . . 51
3.5.2
Impact of
n
. . . 54
3.6
An Extension and Simulation Study . . . 55
3.6.1
Fully Rational Customers . . . 55
3.6.2
Numerical Study for the Optimal Policy . . . 56
3.6.3
Simulation . . . 57
3.6.3.1
Throughput . . . 57
3.6.4
Value of Learning . . . 58
3.7
Concluding Remarks . . . 59
A APPENDIX A: PROOF OF RESULTS IN CHAPTER 2 . . . 60
A.1 Proofs of Lemmas 1 and 2 and a Supplementary Result . . . 60
A.2 Proof of Theorem 1 . . . 63
A.2.1
Proof of Theorem 1 - Part (a): . . . 63
A.2.2
Proof of Theorem 1 - Part (b): . . . 63
A.4 Proof of Proposition 2 . . . 70
A.5 Proof of Proposition 3 and the Statement and the Proof of Proposition 20 . . . 72
A.6 Statement and Proof of Lemma 13 . . . 80
A.7 Proof of Theorem 2 . . . 89
A.8 Proof of Theorem 3 . . . 90
A.9 Proof of Proposition 4 . . . 109
A.10 Proof of Lemma 3 . . . 110
A.11 Proof of Proposition 5 . . . 118
A.12 Explanations and Proofs of Statements in Subsection 2.3.5 . . . 119
A.12.1 Preliminary Analysis . . . 119
A.12.2 Proof of Proposition 6 . . . 124
A.13 Proof of Proposition 7 . . . 128
A.13.1 Proof of Proposition 8 . . . 129
A.14 Proof of Proposition 9 . . . 129
A.14.1 Proof of Part (a) . . . 129
A.14.2 Proof of Part (b) . . . 131
A.15 Proof of Lemma 4 . . . 132
B APPENDIX B: PROOF OF RESULTS IN CHAPTER 3 . . . 138
B.1 Proof of Lemma 5 . . . 138
B.2 Proof of Proposition 10 . . . 138
B.3 Proof of Proposition 11 . . . 147
B.4 Proof of Proposition 12 . . . 150
B.5 Proof of Proposition 13 . . . 151
B.6 Proof of Proposition 14 . . . 153
B.7 Proof of Proposition 15 . . . 153
B.8 Proof of Proposition 16 . . . 156
LIST OF TABLES
2.1
The thresholds with the following parameters:
µ
= 1
,
c
= 2
, and
N
= 2
. . . 28
3.1
Throughput difference in percentage between the system with all the
LIST OF FIGURES
2.1
Comparison of pooled and dedicated systems when
c
= 1
,
µ
= 1
,
N
= 10
. In
this figure,
W
d≥
W
pif and only if (
R/c, ρ)
pair is in Region I, and
SW
p≥
SW
dif and only if (
R/c, ρ)
pair is either in Region I or in Region II. Region IV is as
explained in Section 3.2. . . 18
2.2
Throughput time ratio and social welfare ratio. The following parameters are
used:
R
= 75
,
c
= 4
,
N
= 10
and
µ
= 0.15
. . . 19
2.3
The percentages
β
W(R)
and
β
SW(R)
when
λ
= 0.35
,
c
= 1
,
µ
= 0.3
. . . 21
2.4
The percentages
β
W(N
)
=
.
Wp(NWd)−(NWd)(N)×
100%
and
β
SW(N
)
=
.
SWd(N)−SWp(N) SWp(N)×
100%
when
λ
= 0.35
,
c
= 1
,
µ
= 0.3
. . . 22
2.5
The percentages are defined as
β
Wa=
.
WpWa−Wa×
100%
and
β
aSW=
.
SWaSWp−SWp×
100%
. The following parameters are used:
c
= 6
,
µ
= 0.5
,
N
= 2
. . . 27
2.6
The dedicated, partially-pooled and pooled systems achieve the best performance
in black, grey and white regions respectively. The following parameters are used:
c
= 1
,
µ
= 1
and
N
= 20
. . . 30
3.1
Value function when
R
= 100
,
c
= 5
,
p
H= 0.6
,
p
L= 0.2
. . . 43
3.2
Belief threshold comparison when
R
= 100
,
c
= 5
,
p
H= 0.8
,
p
L= 0.2
. . . 45
3.3
Throughput comparison when
R
= 20
,
c
= 5
,
p
H= 0.4
,
p
L= 0.2
,
α
0= 0.35
. . . 48
3.4
Throughput comparison when
R
= 20
,
c
= 5
,
p
H= 0.4
,
p
L= 0.2
,
α
0= 0.6
. . . 48
3.5
Throught comparison when
R
= 20
,
c
= 5
,
λ
= 0.4
,
p
H= 0.4
,
p
L= 0.2
. The
red dot lines show the
95%
confidence interval. . . 49
3.6
The expected value of learning when
R
= 100
,
c
= 5
,
p
H= 0.7
,
p
L= 0.2
. In
the left panel,
α
0= 0.8
. In the right panel,
n
= 10
. . . 51
3.7
Value of Learning when
R
= 100
,
c
= 5
,
p
H= 0.7
,
p
L= 0.2
,
n
= 10
. . . 53
3.8
Value of Learning when
R
= 100
,
c
= 5
,
p
H= 0.7
,
p
L= 0.2
,
y
= 0.5
. . . 54
3.9
Threshold comparison when
R
= 100
,
c
= 5
,
p
H= 0.8
,
p
L= 0.2
. . . 57
3.10 Throughput comparison when
R
= 20
,
c
= 5
,
p
H= 0.4
,
p
L= 0.2
,
w
2=
w
1,
α
0= 0.35
. . . 58
CHAPTER 1
Introduction
One of the fundamental questions for services that are operated by multiple servers has been whether
to run the system with separated queues or a combined one. These queueing configurations are called
dedicated
and
pooled
, respectively. It is not difficult to see why pooling separate queues might be appealing:
a pooled system uses the available service capacity more efficiently because under pooling no server idles as
long as there are customers waiting, a possibility that exists when individual queues are kept separated. The
benefit of pooling is well established in the operations management literature: when servers are identical and
customers are homogeneous in their service requirements, pooling queues is proven to improve efficiency
by reducing idleness and the expected waiting time in the system.
When studying the age-old question of
to pool or not to pool
, the vast majority of the literature implicitly
assumed that customers are indifferent about how long they wait for service and have no say in their joining
decisions. However, a common feature of many queueing systems in practice is that customers are
delay-sensitive and decide whether to join a queue depending on their expected delay. Thus, it is important to
analyze systems with such customers, and understand if pooling is still preferable in these systems. This is
the primary objective of this paper.
The first example is the design of call centers. Many organizations are grappling with the question of
whether to consolidate their call centers or not (Rodriguez, 2014; Xerox, 2013; Southwest, 2012). With
consolidation, calls are processed in a single large call center, rather than separate, smaller and typically
region-specific call centers. In practice, the key benefit of consolidation is believed to be the efficient use
of resources due to pooling, thereby improving customer satisfaction with the same or even less number of
resources (Xerox, 2013). However, these anticipated benefits do not take customer behavior into account. In
many call centers, callers receive queue length or expected delay information, and based on that information,
they may choose not to join the system. (See Ibrahim (2018) for a literature review of such systems.)
The second example is the design of internal services in large organizations. For such organizations,
there has long been a discussion on whether support services such as information technology, consulting
and purchasing should be shared across different units of the organization or administered in a
decentral-ized manner where these services are provided within each individual unit (Schmidt, 1997; Azziz, 2014;
Bondarouk, 2014). Thus, in the management of internal services, the question of whether to operate a
dedicated system or a pooled one is of paramount importance. Within many organizations, such as
govern-ment agencies and universities, internal services are provided for free (see, e.g., page 113 of (Armbr¨uster,
2006) and (UAFS, 2018)), and successful implementations of such services typically rely on information
sharing, which enables members of the organization to observe and identify inefficiencies such as service
congestion and delays (Campbell Public Affairs Institute, 2017). Sharing support services is aimed to
im-prove organizational efficiency by tapping into the operational benefit of pooling (Mader and Roth, 2015;
U.S. Department of the Treasury, 2017). However, the design of such services also needs to account for the
user behavior: if users within an organization face long delays in their service requests, they could give up
solutions offered by the organization.
It is perhaps worth noting that the dedicated designs in both of these examples share a key feature: An
arrival has the options of only joining her dedicated line or leaving the system.
gain? We are not aware of any prior work that provides a theoretical analysis of the comparison between
pooled versus dedicated queues for an observable queueing system when customers make rational joining
decisions.
In the traditional pooling literature, the long-run average throughput time is a typical performance metric
used to compare pooled and dedicated systems. We also use it as a performance metric. Furthermore,
studying delay-sensitive self-optimizing customers allows us to analyze an additional performance metric,
i.e., social welfare, which is equivalent to consumer surplus in our setting.
The second project studies the learning behavior of customers when they don’t have full information
about the service speed. There is growing literature on strategic behaviors of customers since the
semi-nar work by (Naor, 1969). Some recent papers extend Naor’s model by considering incomplete
informa-tion of system parameters to the customers, and study the effect of informainforma-tion on system performance
((Cui and Veeraraghavan, 2016),(Hu et al., 2018), (Hassin and Roet-Green, 2017a), etc).
Call center has been extensively studied in operations literature since it plays an important role to
in-teract with customers in service industry. Customers usually need to wait on hold when they call customer
service.
75%
of people reported they were ”highly annoyed” when they could not get someone on the phone
in a reasonable amount of time according to a 2015 consumer report. As a result, customers feel frustrated
and abandon the service. Delay information can be announced to customers to improve their experience. A
common type of delay announcements is to inform the customers about the number of people ahead
peri-odically ((Jouini et al., 2011)). In this setting, customers are usually unknown with the system parameters.
They make abandonment decisions with the evolving information from the announcements.
waiting time based on her current ticket position and number of servers, and reneges if it is larger than
reneging patience, which follows exponential distribution.
Motivated by these practical settings, we raise the following questions. What policy should the customer
use to make joining decision and abandonment decision without full information? Is it always beneficial to
be forward-looking? From the service provider’s perspective, should he share the information with the
customers?
We study these research problems in a discrete time single-server queue setting. Customers do not know
the true service rate and have a Bernoulli prior belief on the service rate distribution. The service provider
inform the customers with the queue position upon arrival. The customers make joining decisions either
based on their expected payoff by joining in a myopic way, or in a more complicated way by dynamic
pro-gramming. We also consider the abandonment behaviors when customers update their beliefs in a Bayesian
framework based on the service completion information provided by the service provider. We characterize
the structural properties of three alternative policies, i.e., simple policy, myopic policy and forward-looking
policy. It is shown that being complicated may result in loss of total expected benefit for the customer. We
also conduct throughput comparison between systems with different types of customers.
CHAPTER 2
Pooled or Dedicated Queues when Customers are Delay-Sensitive
In this chapter, we consider a system which can be run as either the dedicated system or the pooled
system. We consider the optimal system choice in terms of long-run average throughput time and social
welfare.
2.0.1
Summary of Main Results
Considering delay-sensitive customers’ rational joining decisions in the comparison of pooled versus
dedicated queues gives rise to the following three unexpected results for the observable systems.
First, Smith and Whitt (1981) establish that if every arrival joins the system (without making decisions),
pooling queues is beneficial in the case of identical servers and jobs. In contrast, our paper proves (in
Theorem 1-(a)) that if arriving customers decide to join or balk, the dedicated system can outperform the
pooled system depending on the following two factors: (i) relative benefit of service, which is the ratio of
service benefit to customer’s waiting cost per unit time, and (ii) potential system load, which is the ratio
of arrival rate to service rate. Specifically, if both the relative benefit of service and the potential system
load are large, pooling queues strictly increases the average sojourn time and this increase is so large that,
compared to the dedicated system, the pooled system results in strictly smaller social welfare.
Second, our analysis and numerical studies show that the performance improvement due to separating
queues can be drastic. Specifically, our paper proves (in Theorem 2) that the percentage increase in the
social welfare with dedicated queues can be arbitrarily large, compared to the case with a pooled queue.
make their own joining decisions, the magnitude of the performance loss due to pooling can strictly increase
with the number of servers (keeping the arrival rate to service rate ratio the same).
To provide a complete picture, our paper also identifies conditions under which the pooled system
results in smaller average sojourn time and hence larger social welfare than the dedicated system. (Those
conditions can be found in Theorem 1-(b).)
Our paper also studies variants of the base model. Some of the key messages from this additional
analysis (in Section 2.3) are as follows: (i) The observability of queue length or real-time expected delay
information is necessary for our unexpected results to hold. (ii) The dedicated system may outperform
the pooled system even when customers are allowed to choose the shortest queue in the dedicated system.
(iii) All of our results extend when customers incur a fixed fee upon service completion.
1(iv) When
a social planner could charge a different service fee under each queue configuration to maximize social
welfare, pooling queues improves the social welfare. Thus, the welfare advantage of pooling queues can be
recovered if the social planner has the pricing lever.
2.0.2
Relevant Literature
Our paper belongs to the literature that studies pooled versus dedicated queues. To the best of our
knowledge, there is no prior work that theoretically analyzes the comparison of pooled versus dedicated
queues in an observable system when delay-sensitive customers make their own joining decisions. Our
paper provides such an analysis.
The analysis of pooling queues has long been an interest in the queueing literature. To our
knowl-edge, (Smith and Whitt, 1981) were the first to provide a mathematical investigation of pooling queues.
(Smith and Whitt, 1981) showed that when jobs (e.g., customers) are homogeneous in their service
require-ments and servers are identical, pooling separate queues increases the system efficiency by reducing the
expected steady-state waiting time. Since the publication of this seminal work, many articles studied the
benefit of pooling queues in different contexts and under a variety of conditions. (Calabrese, 1992)
pro-vided an alternative proof to show the benefit of pooling for system efficiency. (Benjaafar, 1995)
deter-mined bounds on performance improvements through pooling. Gans et al. (2003a) illustrated the benefits
of pooling call centers (in different geographical locations) into one. Using approximation formulas for a
two-server queueing system, van Dijk and van der Sluis (2008) made the observation that when customers
1are identical, a pooled system results in smaller long-run average waiting time than its dedicated counterpart.
(Andrad´ottir et al., 2017) showed that even if servers are subject to failures, pooling queues always results
in smaller expected steady-state number of jobs in the system and hence smaller long-run average waiting
average time, compared to the system with dedicated queues.
Unlike what has been established in this literature, our paper proves that when delay-sensitive customers
make their joining decisions in an observable system, pooling queues can result in much worse performance
than a dedicated system even with identical servers and homogeneous customers.
There have been observations that pooling parallel queues is not always beneficial and may result in
performance degradation; these observations are attributed to three main factors explained in (a) through (c)
below. Our paper identifies a different factor not previously identified in the pooling literature: observable
queue and customers’ ability to make a joining/balking decision. We now explain the aforementioned three
factors in (a) through (c) below, and discuss the relevant literature.
(a) If jobs are heterogeneous in their service requirements or servers are not identical, the pooled
sys-tem may perform worse than the dedicated syssys-tem. (Smith and Whitt, 1981) included a numerical
ex-ample with heterogeneous servers to make this point. (Rothkopf and Rech, 1987) discussed that if jobs
require different service times, combining separate queues into a single one can increase the average
de-lay. Section 5.3 of Mandelbaum and Reiman (1998) briefly discussed this effect of heterogeneous servers
in a parallel multi-server setting without providing proofs (as there are no exact formulas available in
that setting). Using approximation formulas for queueing models, van Dijk and van der Sluis (2008) and
van Dijk and van der Sluis (2009) constructed numerical examples to illustrate the aforementioned effect of
these factors.
ownership. (Song et al., 2015) empirically investigated the effects of pooling in an emergency department
and found that the dedicated system is superior to the pooled system with respect to the average waiting time
and the average length-of-stay. The paper attributes this to physicians’ increased ownership of the patients
under the dedicated system. Do et al. (2015) theoretically analyzed the implications of server slowdown due
to pooling, and showed that the pooled system can result in larger expected waiting time than the dedicated
system. Using a data set from a supermarket, Wang and Zhou (2017) provided an empirical evidence that
pooling queues can increase the service time. The main driver of this finding was explained to be the
social loafing effect with a pooled queue. (Armony et al., 2017) considered a two-server queueing system
where servers can choose their long-run average service rates, and incur a cost for the expected workload or
busyness. Armony et al. (2017) showed that if servers are workload-averse, pooling queues always achieves
lower expected queue length but can result in larger expected work-in-process (WIP).
(c) Apart from two factors explained in (a) and (b), (Rothkopf and Rech, 1987) conjectured that when
jockeying (i.e., switching from one queue to another) among parallel queues is possible for customers, under
very mild conditions, the average waiting time under the pooled system can be larger than that under the
dedicated system.
It is worth emphasizing that none of the papers mentioned in (a) through (c) theoretically analyzes
customers that can make their own joining decisions. Unlike all of the papers mentioned above, our work
provides a theoretical analysis of such self-optimizing customers in the context of pooling queues. In our
problem formulation, to avoid any performance advantage to the dedicated system and to analyze the effect
of customers’ joining decisions in isolation, we will exclude the above factors that were previously observed
to cause pooling to potentially perform worse than the dedicated system.
systems by considering rational customers’ joining decisions. Moreover, the main performance metric in
our paper is social welfare, which is the same as consumer surplus in our setting.
Our work is also relevant to the literature that studies delay-sensitive rational customers making their
own decisions in observable queueing systems. (The comparison of pooled versus dedicated queues has
not been investigated in this literature.) Our formulation of customers builds on the framework developed
and analyzed in the seminal work by (Naor, 1969). (Naor, 1969) considered a single-server queue where
customers can observe the queue length and decide whether to join the queue or balk depending on their
expected net benefit of joining the queue. In his setting, a balking customer gains zero expected net benefit,
while each joining customer incurs a constant waiting cost per unit time spent in the system, and receives
a reward upon service completion. One of the main findings of (Naor, 1969) is that allowing customers to
make their own decisions results in social welfare loss compared to the maximum achievable welfare. Many
articles extend the model analyzed in (Naor, 1969) in various dimensions. The comprehensive review of
these papers can be found in (Hassin and Haviv, 2003) and (Hassin, 2016a). But, two of them are
espe-cially worth highlighting here. (Debo and Veeraraghavan, 2014) extended Naor’s model by carrying out an
equilibrium analysis for a queue with incomplete information. In their setting, customers observe the queue
length but they do not exactly know the service value and the expected service time before making a join or
balk decision. The authors proved that customers’ joining probability does not necessarily decrease with the
queue length. (Cui and Veeraraghavan, 2016) built on Naor’s model to analyze a setting where customers
have different beliefs about the service time, and the service provider can reveal service information. They
established that revealing service information can significantly hurt the social welfare and consumer surplus.
2.0.3
Outline of the Paper
2.1
Model
Consider a first-come-first-served (FCFS) queueing system with
N
≥
2
servers. The service time of
each server is exponentially distributed with rate
µ >
0
.
2The system can be run with either dedicated
queues or a pooled queue. These two alternatives will be called
dedicated
and
pooled systems
, and indexed
by
j
=
d
and
j
=
p
, respectively.
The dedicated system contains
N
separate queues, each served by a separate server. In this setting, a
server together with its queue is called a dedicated
sub-system
. In the dedicated system, customers arrive
to each queue according to a Poisson process with rate
Λ
d=
λ
, and a server provides service only to
customers in his own queue.
3In contrast, in the pooled system, separate queues are combined into a single
one, and customers arrive to the queue according to a Poisson process with rate
Λ
p=
N λ
. Whenever a
server completes serving a customer, he serves the next customer waiting in the queue. Here,
Λ
dand
Λ
pcan
be interpreted as
potential arrival rate
for a queue in the associated system. In light of this, the ratio
ρ
=
.
λ/µ
(2.1)
is called the
potential system load
. As will be explained later, the actual arrival rate to a queue is different
than the potential arrival rate because the former is determined by customers’ joining decisions.
Customers make their own joining decisions. Regardless of the system type, upon arrival, each customer
first observes the queue length and then decides whether to join the queue or balk. If an arriving customer
decides to join the queue, the customer incurs cost
c >
0
per unit time she spends in the system. A customer
gains a benefit
R
after service completion, and the service is free of charge. Considering a queueing system
that provides free of charge service is common in the literature. Although their research questions are very
different than ours, several studies analyze such systems. (See, for instance, Hassin (1985), Armony et al.
(2009), Gai et al. (2011) and Haviv and Oz (2016).) Section 2.3.1 explains that all of our results and their
proofs extend in a straightforward fashion if customers pay a fixed fee
f >
0
upon service completion. In
2Our model considers identical servers to tease out the effect of customers’ joining decisions; heterogeneous servers were already observed to cause pooling to potentially perform worse than the dedicated system.
3
our formulation, all model parameters are common knowledge. This implies that for customers, observing
the queue length is the same as observing their real-time expected sojourn time.
As in Naor (1969), if an arriving customer decides to balk, she neither gets a benefit nor incurs a cost,
and hence she gains zero expected net benefit. If a customer arrives to a particular queue, the customer
receives the following expected net benefit by joining the queue:
E
[U
(n;
j)] =
R
−
W
¯
j(n
+ 1)c,
j
∈ {
d, p
}
.
(2.2)
Here,
W
¯
j(n
+ 1)
represents the expected time spent by the arriving customer in the system; for the pooled
system,
n
represents the number of customers that are already in the system, and for the dedicated system,
n
corresponds to the number of customers that are already in the arrived sub-system. A customer joins the
queue if and only if her expected net benefit is non-negative, which is equivalent to the following by (2.2):
E
[U
(n;
j)] =
R
−
W
¯
j(n
+ 1)c
≥
0;
otherwise she balks. This suggests that an arriving customer optimally joins the queue if and only if the
number of customers in the queue and its associated service is smaller than a threshold that depends on the
system type; otherwise, the customer balks.
The aforementioned optimal threshold rule implies two key characteristics of the systems in our
anal-ysis. First, the rate at which customers join the queue, which is represented by
λ
e,j, is always smaller than
the potential arrival rate
Λ
jfor
j
∈ {
d, p
}
. Second, regardless of the value of the potential system load
ρ
,
both pooled and dedicated systems are stable.
4Our primary goal is to analyze the implications of pooling for
social welfare
. In doing so, we will also
study the implications of pooling for long-run average time spent in the system, that is,
average sojourn
time
.
Denote by
W
j, the average sojourn time in the system
j
∈ {
d, p
}
. In our setting, the social welfare
equals the consumer surplus, which is the sum of long-run average net gains of all customers in a system.
As a result, the social welfare in the system
j
∈ {
d, p
}
is equal to the multiplication of these two factors: (i)
a single customer’s long-run average net benefit
R
−
W
jc
and (ii) the long-run average number of customers
4served, that is,
throughput
,
θ
j:
SW
j= (R
−
W
jc)θ
j=
.
(R
−
W
jc)λ
e,j=
Rλ
e,j−
cL
jif
j
=
p,
(R
−
W
jc)λ
e,jN
=
Rλ
e,jN
−
cL
jN
if
j
=
d.
(2.3)
Here,
L
pis the long-run average number of customers in the pooled system,
L
drepresents its counterpart in
one
of the
N
dedicated sub-systems, and the throughput
θ
jsatisfies the following:
θ
j=
λ
e,jif
j
=
p,
λ
e,jN
if
j
=
d.
(2.4)
According to (2.3), the average sojourn time and the throughput are the two key determinants of the
social welfare.
2.1.1
Preliminary Analysis
To avoid trivialities, this paper focuses on a case where
k
=
.
$
Rµ
c
%
≥
1.
(2.5)
Here,
⌊·⌋
is the standard floor function. The condition (2.5) means that a customer always joins an empty
system.
Lemma 1.
In the pooled system, an arriving customer joins the queue if and only if the number of customers
already in the system is
n
≤
K
−
1
, where
K
=
.
$
RN µ
c
%
Furthermore, in the pooled system, for
K > N
, the average sojourn time and social welfare are respectively
given by
W
p=
P
N−1i=0 N
i
i!
iρ
i+
NN N!
P
K i=Niρ
iP
N−1i=0 N
i i!
ρ
i+
NN N!
P
K−1i=N
ρ
iN λ
,
(2.7)
SW
p=
1
−
NN N!
ρ
KP
N−1i=0 N
i i!
ρ
i+
NN N!
P
K i=Nρ
i!
RN λ
−
P
N−1i=0 N
i i!
iρ
i+
NN N!
P
K i=Niρ
iP
N−1i=0 N
i i!
ρ
i+
NN N!
P
K i=Nρ
ic,
(2.8)
where
ρ
is as defined in
(2.1)
.
Lemma 2.
In the dedicated system, an arriving customer joins the queue if and only if the number of
customers already in that sub-system is
n
≤
k
−
1
, where
k
is as defined in
(2.5)
. Furthermore, in the
dedicated system, the average sojourn time and social welfare are respectively given by
W
d=
P
k i=0iρ
iP
k−1i=0
ρ
iλ
and
SW
d=
1
−
ρ
kP
ki=0
ρ
i!
RN λ
−
P
ki=0
iρ
iP
k i=0ρ
iN c,
(2.9)
where
ρ
is as defined in
(2.1)
.
Based on Lemmas 1 and 2, hereafter, we refer to
k
as the
balking threshold
in the dedicated system and
K
as the
balking threshold
in the pooled system. Note that the balking thresholds satisfy
K
≥
N k.
(2.10)
2.2
Analysis
We begin the analysis with one of our main results.
Theorem 1.
There exist constants
η
and
η
¯
such that the following results hold:
(a)
The dedicated system results in
(i)
strictly smaller average sojourn time and
(ii)
strictly larger social
welfare than the pooled system, i.e.,
W
d< W
pand
SW
d> SW
p, respectively, if
ρ >
1
and
R/c > η,
(2.11)
where
η
is finite when
ρ >
1
, and does not depend on either
R
or
c
.
the dedicated system, i.e.,
W
p≤
W
dand
SW
p> SW
d, respectively, if either
(
⋆
)
R/c <
(N
+ 1)/(N µ)
or
(
⋆⋆
)
ρ <
1
and
R/c >
η,
¯
(2.12)
where
η
¯
is finite when
ρ <
1
, and does not depend on either
R
or
c
.
Theorem 1-(a) establishes that when customers make their own joining decisions, pooling queues can
be undesirable even with identical servers and customers. There are two main drivers of this result: (i) The
system is observable. Each customer makes the joining decision based on her
own
expected sojourn time,
and joins as long as this sojourn time is (weakly) smaller than the longest one, which is experienced by the
customer who joins at the balking threshold. Thus, customers do not account for negative externality they
impose on customers behind in their joining decisions, leading to very congested systems. This situation is
in contrast to an unobservable queueing system where customers make their joining decisions based on the
average sojourn time across all customers that join the system. (ii) When the system has a large potential
load, i.e.,
ρ >
1
, the stationary probability of having
l
customers in the system is convex increasing in
l
.
Theorem 1-(b) proves that the benefit of pooling is recovered under conditions (2.12). A detailed
expla-nation of Theorem 1 is provided in Section 2.2.1.
2.2.1
Explanation of Theorem 1
We will first provide a step-by-step analysis to establish and explain Theorem 1-(a), which is our key
result. Because the throughput is an important determinant of social welfare by (2.3), we begin our analysis
with the following result.
Proposition 1.
The dedicated system results in strictly smaller throughput than the pooled system, i.e.,
θ
d< θ
p.
the pooled system also reduces idleness; this makes it less likely for the pooled system to operate at the
balking threshold than the dedicated system. Because of all these reasons, the pooled system results in
smaller balking probability and hence larger throughput than the dedicated system, as proved in Proposition
1.
Proposition 1 and (2.3) suggest that even if the dedicated system has a smaller average sojourn time
than the pooled system, the pooled system can still outperform the dedicated one in terms of social welfare.
The dedicated system can outperform the pooled system in terms of social welfare only when the former
has a sufficiently lower average sojourn time that offsets the lower throughput.
We now introduce a “
scaled queueing system
,” i.e.,
SQ system
, as a bridge for the comparison between
the dedicated and pooled systems. We consider the SQ system because comparing the dedicated system
with the SQ system or comparing the pooled system with the SQ system is analytically more tractable than
directly comparing the dedicated system with the pooled system.
Definition 2.1.
An
SQ system
is a single-server queueing system indexed by
j
=
s
with the following
properties:
(a)
Customers arrive to the system according to a Poisson process with rate
λN
.
(b)
The service
time has an exponential distribution with rate
µN
.
(c)
Each arriving customer balks if and only if the number
of customers already in the system is larger than
K
(as defined in
(2.6)
); otherwise, she joins the system.
Let
W
sand
SW
sbe the average sojourn time and social welfare in the SQ system, respectively. Then,
we have the following result.
Proposition 2.
(SQ versus Pooled)
Compared to the pooled system, the SQ system results in
(a)
strictly
smaller average sojourn time, i.e.,
W
s< W
p, and
(b)
strictly larger social welfare, i.e.,
SW
s> SW
p.
There are two key observations related to the SQ system: (i) The SQ and pooled systems have the same
balking threshold
K
. (ii) The service rate in the SQ system is larger than the one in the pooled system for any
given number of customers in the system, and the former is strictly larger than the latter when the number
of customers in the system is small. Then, by (i) and (ii), the SQ system results in strictly smaller average
sojourn time than the pooled system, as proved in Proposition 2-(a). The throughput in the SQ system is
strictly larger than the one in the pooled system by the proof of Proposition 2.
56This and Proposition 2-(a)
immediately imply Proposition 2-(b).
5
See inequality (A.41) in the proof of Proposition 2.
6
Proposition 3.
(SQ versus Dedicated)
The dedicated system results in
(a)
strictly smaller average sojourn
time and
(b)
strictly larger social welfare than the SQ system, i.e.,
W
d< W
sand
SW
d> SW
s, respectively,
if
ρ >
1
and
R/c > η,
(2.13)
where
η
is the same constant as the one in Theorem 1-
(a)
.
Remark 2.2.1.
There exists a constant
η
e
such that if
ρ <
1
and
R/c >
e
η
, then
W
d> W
sand
SW
d< SW
s.
This result is stated as Proposition 20 in Appendix A.5 of the Electronic Companion. Its proof can be found
in the same appendix.
Let us explain the rationale behind Proposition 3. To that end, denote by
L
sthe steady-state average
number of customers in the SQ system. Recall that
θ
sand
θ
dare the throughputs of the SQ and dedicated
systems, respectively, and
L
dis the steady-state average number of customers in each of the
N
dedicated
sub-systems. Based on this notation, let us first explain part (a) of the proposition. As will be explained in
detail below,
L
s> N L
dwhen
ρ >
1
. Consequently, if (2.13) holds, then
W
s> W
ddue to the following
two reasons: (i) When the relative benefit of service is large, i.e.,
R/c > η
, the balking thresholds in each
dedicated sub-system and the SQ system are both large, which implies that the throughputs
θ
sand
θ
dare
very close to each other. (ii) By Little’s Law,
W
s=
L
s/θ
sand
W
d=
N L
d/θ
d. Since
θ
sand
θ
dare very
close to each other, this implies part (a), i.e.,
W
s> W
d. To explain part (b) of the proposition, we note
the following. As stated above, when
R/c > η
, the throughputs
θ
sand
θ
dare very close to each other, and
thus, the average sojourn time is the determining factor in the comparison of social welfare in the SQ and
dedicated systems. As a result, part (b) holds.
We now explain why
L
s> N L
dwhen
ρ >
1
. For this purpose, let
π
d(i)
(respectively,
π
s(i)
) be the
steady-state probability of having
i
customers in a dedicated sub-system (respectively, in the SQ system).
Then,
L
d=
P
ki=0π
d(i)i
and
L
s=
P
Ki=0π
s(i)i
, where
k
and
K
are the balking thresholds in a dedicated
sub-system and the SQ system, respectively. When
ρ >
1
, the steady-state probabilities
π
d(i)
and
π
s(i)
are convex increasing in
i
, the number of customers. Thus, in the summations
L
d=
P
ki=0π
d(i)i
and
L
s=
P
Ki=0π
s(i)i
, the weight of the term
i
is convex increasing in
i
when
ρ >
1
. Because these weights
are probabilities that sum up to 1, we note that when
ρ >
1
, a larger
i
has a larger weight in both
L
sand
support of
π
d(i)
, which is
{
i
:
i
= 0,
1, . . . , k
}
. As a result,
π
s(
·
)
puts even more weight to larger values of
i
, compared to
π
d(
·
)
. Therefore, when
ρ >
1
, the convex increasing property of the steady-state distribution
is more pronounced in the SQ system than in the dedicated system. Combining this with (2.10), we deduce
that the sum
L
s=
P
Ki=0π
s(i)i
is strictly larger than the sum
N L
d=
N
P
ki=0π
d(i)i
.
By Propositions 2 and 3, if (2.13) holds,
W
d< W
s< W
pand
SW
d> SW
s> SW
p. Thus, we
have Theorem 1-(a). These orderings are in contrast to the classical understanding that is based on
no-customer-balking assumption. In the absence of customer balking, one would have
W
s< W
p< W
dand
SW
s> SW
p> SW
d, where
j
=
s
here is the modified scaled system that satisfies properties (a) and (b) in
Definition 2.1, and assumes no balking.
7We now explain the conditions in Theorem 1-(b). If (2.12)-(
⋆
) holds, a joining customer immediately
enters the service in both dedicated and pooled systems because
k
= 1
and
K
=
N
under that condition.
Thus, dedicated and pooled systems have the same average sojourn time
W
jand provide the same long-run
average net benefit to each joining customer. This and strictly larger throughput in the pooled system (by
Proposition 1) imply strictly larger social welfare for the pooled system if (2.12)-(
⋆
) holds.
The conditions in (2.12)-(
⋆⋆
) can be explained as follows. When the benefit is large (i.e.,
R/c >
η
¯
),
balking thresholds are large in both systems. With a relatively small potential load, i.e.,
ρ <
1
, dedicated and
pooled systems barely achieve their balking thresholds, implying very small expected number of balking
customers for both systems. Thus, the pooled and dedicated systems have very close throughputs under
(2.12)-(
⋆⋆
). Moreover, under these conditions, there is significant idleness in the dedicated system. As
a result, pooling results in smaller average sojourn time by reducing idleness in the system. This and
Proposition 1 imply larger social welfare for the pooled system.
2.2.2
Numerical Comparison of the Pooled and Dedicated Systems
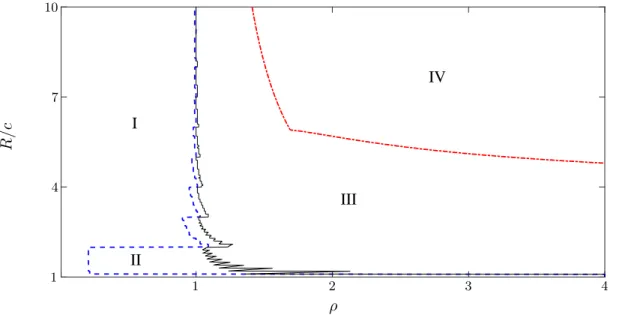
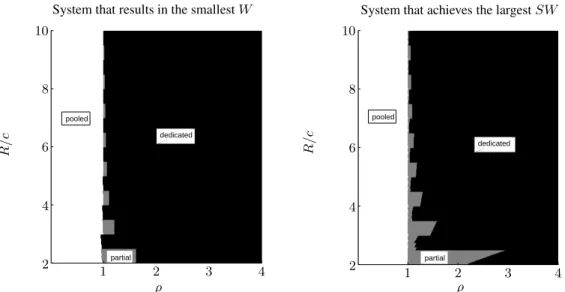
Figure 2.1 pictures conditions under which the dedicated system outperforms the pooled system for
a numerical example. In this figure,
SW
d> SW
pif and only if (
R/c, ρ
) pair lies in either Region III
or Region IV (i.e., the region to the right of the solid line). Thus, for a wide range of parameters, the
7When customers cannot balk, throughputs are the same forj∈ {s, d, p}because every arrival joins. As the service rate is larger inthe modified scaled system than in the pooled system for any given number of customers in the system,Ws< Wpin the absence
ρ
R
/c
I
II
III
IV
1 2 3 4
1 4 7 10
Figure 2.1: Comparison of pooled and dedicated systems whenc = 1,µ = 1,N = 10. The displayed dashed and solid boundaries between regions are non-smooth and zigzagged because of the floor function ink andK. In this figure,Wd≥Wpif and only if (R/c, ρ)pair is in Region I, andSWp≥SWdif and only if (R/c, ρ)pair is either in Region I or in Region II. Region IV is as explained in Section 3.2.
dedicated system results in strictly larger social welfare than the pooled system. Region IV corresponds to
the parameter space identified in (2.11). We can see that the sufficient condition (2.11) constitutes a large
portion of the parameter set in which
SW
d> SW
p.
Figure 2.1 demonstrates that the dedicated system results in strictly larger social welfare than the pooled
system for a given service rate if and only if
R/c
is not too small and
ρ > ρ
SWfor some constant
ρ
SW. In
this figure,
W
d< W
pif and only if (
R/c, ρ
) pair lies in either Region II, III or IV. This suggests that the
dedicated system results in strictly smaller average sojourn time than the pooled system if and only if
R/c
is not too small and
ρ > ρ
Wfor some constant
ρ
W≤
ρ
SW. We have
ρ
SW≥
ρ
Wbecause if the dedicated
system results in larger social welfare than the pooled system at a given
ρ
, then, by (2.3) and Proposition 1,
it must also result in strictly smaller average sojourn time than the pooled system at the same
ρ
.
Observe from Figure 2.1 that
ρ
W<
1
for certain values of
R/c
. Our further numerical analysis shows
that
ρ
SWcan also be smaller than 1 for some
R/c
. This means that
ρ >
1
is not a necessary condition
for the superior performance of the dedicated system. We also numerically observed that
SW
d> SW
pfor
ρ
ρ
0
0 1 2 3 4 5 6 1 2 3 4 5 6
−20% 0%
0% 20% 40% 60%
−500% 500% 1000% 1500% 2000% 2500% 3000%
ρ= 1
ρ= 1
T
h
e
P
er
ce
n
ta
g
e
βW
T
h
e
P
er
ce
n
ta
g
e
βS
W
Figure 2.2: Throughput time ratio and social welfare ratio. The following parameters are used: R = 75,c = 4, N = 10andµ= 0.15.
Note from (2.5) and (2.6) that the potential arrival rate
λ
does not affect the balking thresholds
k
and
K
.
However, Theorem 1 and Figure 2.1 demonstrate that
λ
plays an important role in the comparison between
the dedicated system and the pooled system through
ρ
. Figure 2.2 above sheds more light on the effect of
ρ
on the comparison between the pooled and dedicated systems.
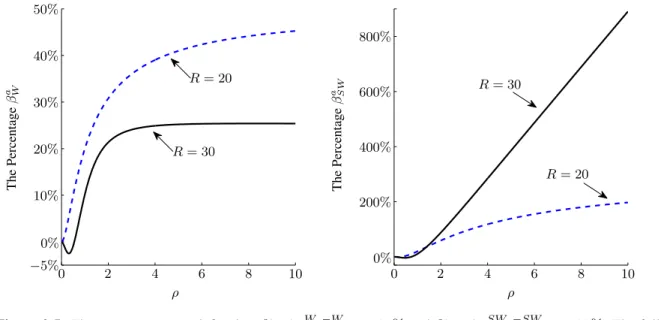
Figure 2.2 demonstrates the percentages
β
W= (W
.
p−
W
d)/W
d×
100%
and
β
SW= (SW
.
d−
SW
p)/SW
p×
100%
for a numerical example. A key message from this figure is that the dedicated system
can result in significantly larger social welfare than the pooled system for large
ρ
.
8Among other properties,
the steep increase in
β
Waround
ρ
= 1
in Figure 2.2 shows that when
ρ
is close to
1
, the average sojourn
time can increase in the potential load significantly faster under the pooled system, than under the dedicated
system. This increase eventually leads to welfare loss under pooling. Note from Figure 2.2 that the
ex-plained sojourn time phenomenon cannot be observed as
ρ
→
0
or
ρ
→ ∞
. (The aforementioned sojourn
time observations are analytically verified by (A.73), (A.75) and (A.76) in Lemma 13, which is in Appendix
A.6 of the Electronic Companion.) Overall, Figure 2.2 underscores the importance of judiciously evaluating
the pooled and dedicated systems for services, as the relative performance of a system can be very sensitive
to a change in
ρ
.
8
One can show that the ratioSWd/SWpcan increase unboundedly asρ→ ∞for example whenRµ/c=k+ 1/N. Our further
2.2.3
The Impact of Benefit
R
and Number of Servers
N
Theorem 1 naturally brings forth the following question: What is the percentage
improvement
in the
social welfare
SW
if the dedicated system is implemented instead of the pooled system? Theorem 2 below
answers this question by identifying a lower bound for the achievable aforementioned percentage under
certain conditions.
The parameter
R
is one of the determinants of
SW
because it affects both the throughput and the
average sojourn time through the balking thresholds
k
and
K
. In Theorem 2, we will include
R
as an
argument of
SW
(
·
)
to emphasize its dependence on
R
. After presenting Theorem 2, we will further discuss
the effect of
R
.
Theorem 2.
Compared to the pooled system, the percentage increase in the social welfare under the
dedi-cated system satisfies the following for
ρ >
1
:
max
R
β
SW(R)
=
.
SW
d(R)
−
SW
p(R)
SW
p(R)
×
100%
>
(N
−
2)
×
100%.
(2.14)
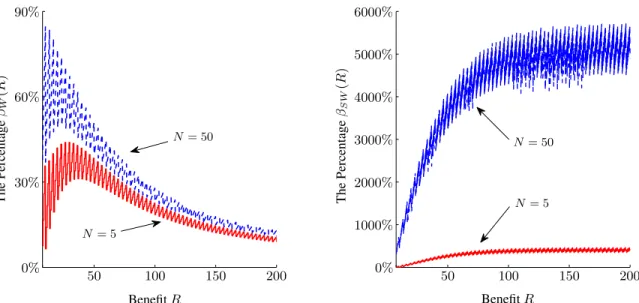
Figure 2.3 displays how
β
SW(R)
(defined in (2.14)) changes with
R
for a given system size. Because
welfare loss under the pooled system is due to the large increase in the average sojourn time with pooling,
it could also be worthwhile to see the percentage
increase
in the average sojourn time
W
due to pooling
queues. Thus, Figure 2.3 also displays
β
W(R)
=
.
Wp(RWd)−(WdR)(R)×
100%
with respect to
R
. There are a few
key observations in this figure: (i) Operating a system with dedicated queues rather than a pooled one can
significantly improve the social welfare in both small-scale and large-scale systems. (ii) Such significant
performance gain does not require a very large
R
. For example, when
N
= 50
, the percentage improvement
in social welfare under the dedicated system is larger than 100% for
R
≥
7.5
. The reason is that pooling
queues can drastically increase the average sojourn time even at moderate benefit
R
; in fact, the maximum
β
W(R)
is typically observed at moderate
R
, as displayed in Figure 2.3.
Consider a sequence of systems indexed by
n
=
{
2,
3, . . .
}
such that in the
n
thsystem, there are
N
=
n
BenefitR
BenefitR
50
50 100 150 200 0% 100 150 200
0% 30% 60% 90%
1000% 2000% 3000% 4000% 5000% 6000%
N= 50
N= 5
N= 50
N= 5
T
h
e
P
er
ce
n
ta
g
e
βW
(
R
)
T
h
e
P
er
ce
n
ta
g
e
βS
W
(
R
)
Figure 2.3: The percentagesβW(R)andβSW(R)whenλ = 0.35,c = 1,µ = 0.3. The displayed functions are non-smooth and zigzagged because of the floor function inkandK. Total potential arrival rate in the system withN servers isλN. Thus,Ncan be seen as the scale of the system.
size is large. Specifically, Theorem 2 shows that, compared to the pooled system, the dedicated system may
improve social welfare in a way that the percentage improvement in social welfare eventually takes values
larger than any fixed value as the system size increases.
It is well established in the literature that pooling queues in a larger system provides larger performance
benefits. For instance, Benjaafar (1995) demonstrates that when there is no balking, the average delay
decreases with the system size when multiple
M/M/1
systems are combined and run as a pooled system.
An important implication of this observation in their setting is that the social welfare benefit of pooling
also increases with the system size. In contrast, Figure 2.3 shows a numerical example where pooling in
a larger system results in
larger
percentage
loss
in social welfare for each
R
when customers make their
own joining decisions. Specifically, for any
R
,
β
SW(R)
with
N
= 50
is larger than that with
N
= 5
in
Figure 2.3. An important driver of this is that under the considered parameters, the percentage increase in
the average sojourn time due to pooling is larger in a larger system. (See
β
W(R)
in Figure 2.3.) Motivated
by these observations, Figure 2.4 provides a deeper numerical analysis on the impact of the system size on
the percentages
β
W(N
)
and
β
SW(N
)
. Here, we include
N
as an argument of the performance metric under
consideration to emphasize its dependence on
N
.
Number of ServersN
Number of ServersN
T
h
e
P
er
ce
n
ta
g
e
βS
W
(
N
)
T
h
e
P
er
ce
n
ta
g
e
βW
(
N
)
3
3 8 13 18 0% 8 13 18
0% 10% 20% 30% 40% 50% 60% 70%
100% 200% 300% 400% 500%
Figure 2.4: The percentagesβW(N) =.
Wp(N)−Wd(N)
Wd(N) ×100%andβSW(N)
.
= SWd(N)−SWp(N)
SWp(N) ×100%when
λ= 0.35,c= 1,µ= 0.3.