PERCEPTIONS OF STEREOTYPE VULNERABILITY, BELONGING AND CAMPUS CLIMATE BY AFRICAN AMERICANS ATTENDING A PREDOMINATELY WHITE
INSTITUTION
Loren Wright Thompson
Dissertation submitted to the faculty of the University of North Carolina at Chapel Hill in partial fulfillment of the requirements for the degree of Doctor of Philosophy in the School of Education
(School Psychology).
Chapel Hill 2017
Approved by: Rune J. Simeonsson Steven Knotek Sandra Evarrs Dana Griffin
ii © 2017
iii ABSTRACT
LOREN WRIGHT THOMPSON: Perceptions of stereotype vulnerability, sense of belonging and campus climate by African Americans attending a Predominately White Institution.
(Under the direction of Rune J. Simeonsson)
The purpose of this study was to examine of stereotype vulnerability, sense of belonging and campus climate for African American college students at a Predominately White Institution (PWI) in the Southeast. This research used a sociocultural model to explore African American student perceptions at a PWI in the southeast of the United States. This study hypothesized that campus climate would moderate a relationship between stereotype vulnerability and sense of belonging. It was also hypothesized that gender (male, female) differences would exist
concerning perceptions of these variables. An anonymous Qualtrics survey link, containing the three scales and demographic questions, was provided to students, through student led
organizations (N=102). Pearson Product Moment Correlation statistic identified correlations between stereotype vulnerability and sense of belonging, sense of belonging and campus climate, as well as, stereotype vulnerability and campus climate. Further, a Multiple Analysis of Variance (MANOVA) found differences in the perception of stereotype vulnerability and sense of
iv DEDICATION
v
ACKNOWLEDGMENT
First and foremost, I have to praise God, who has fortified me; providing the strength, courage, and patience necessary to complete this process. I must also give honor to my husband
vi
TABLE OF CONTENTS
LIST OF TABLES ………...ix
LIST OF FIGURES ………...x
CHAPTER I: INTRODUCTION Statement of Problem………...…….…...1
Statement of Purpose ………..….………...2
Research Questions ………...…...………...4
Definition of Terms ………...………...………...4
CHAPTER II: REVIEW OF LITERATURE Introduction ………...5
Sociocultural Framework ………...6
Stereotype threat/vulnerability …………...………...11
Sense of belonging ………...17
Campus climate ………...20
Rationale ………...23
Hypotheses ………...25
CHAPTER III: OUTLINE OF PROCEDURES Introduction ………...……….………...26
Research Design and Data Analysis ………..…………...26
vii
Procedures ………...………...………...30
Measures ………..………..………...32
CHAPTER IV: PRESENTATION OF FINDINGS Preliminary and Demographic Data ...37
Analysis of Hypothesis 1 ...39
Analysis of Hypothesis 2 ...41
Analysis of Hypothesis 3 ………..42
CHAPTER V: DISCUSSION Findings ………..………..44
Implications ………...………....47
Limitations ………..………..50
Future Directions ………....………..………52
Conclusion ………....………..………..52
APPENDIX A: EXAMPLES OF MEASURES Stereotype vulnerability Scale ………...………56
Psychological Sense of School Membership ………..………..57
Campus climate Survey-Undergraduate ………..……….59
Campus climate Survey-Graduate ………..……..66
Demographic Information-Undergraduate ……...73
Demographic Information-Graduate ………...……..75
APPENDIX B: RECRUIMENT LETTER ………..…….77
viii
ix
LIST OF TABLES
I. Means, Skewness and Kurtosis for Variables………...………....37
II. Participant Demographic Characteristics………...39
III. Summary of Correlations for Primary Variables……….………41
IV. Hierarchical Regression Analysis Summary ………..42
x
LIST OF FIGURES
1 CHAPTER I INTRODUCTION Statement of the Problem
Although levels of racial integration within high schools in the United States have decreased (Rankin & Reason, 2005), demographic trends and landmark court cases concerning discriminatory admission practices have led to an increase in racial integration in higher education (Ancis, Mohr, & Sedlacek, 2000). African American undergraduate enrollment at degree granting institutions increased from 943,000 to 2,269,000 between 1976 and 2008; increasing their share of total enrollment from 10% to 14% (Aud, Fox, & Kewal-Ramani, 2010). The enrollment of African American graduate students increased from 90,000 in 1976 to 315,000 in 2008; increasing their share of the total graduate enrollment from 6% to 12%. Many students will experience their first significant interracial interaction as they transition to college (Rankin & Reason, 2005).
2
percent, however this increase was from 20 percent to 21 percent for African Americans. In 2007, forty three percent of European Americans students graduated within four years; which is four percentage points higher than the national average. African Americans equaled the national average after six years, but did not reach the four year completion percentage of
European students (Sydey & Dillow, 2012). While university enrollment has increased for African Americans, statistics still highlight challenges concerning academic attainment outcomes.
Further, campus experiences reported by African Americans do not parallel those of European Americans (Ancis, Mohr, & Sedlacek, 2000).Campus experiences result from
historical inequality and general social context. In the United States, desegregation, Civil Rights Law litigation (Title IV), and a surge in enrollment of diverse populations in universities raised awareness concerning overt discriminatory practices, however, covert and unconscious practices still plague the academic attainment and educational experiences of African Americans
(Hurtado,1992). U.S universities must now connect educational quality to agendas of inclusion, leading various diversity initiatives that ignore socio-historical context and lack integration (Milem, Chang & Antonio, 2005),
Statement of Purpose
3
However such research continues to suggest racial gaps persist even when socioeconomic and other factors are controlled (Taylor, 2005). Stereotype threat is believed to occur when an individual perceives that they are vulnerable to confirming a stereotype about a group they are identified with; leading to an impact on task performance (Steele & Aronson, 1995). Numerous research studies have framed stereotype threat as an explanation for the academic differences between African Americans and Whites Americans (Aronson & Inzlicht, 2004; Good, Aronson, & Inzlicht, 2003; Steele& Aronson, 1995), but widespread interventions are limited (Milem, Chang & Antonio, 2005). Through stereotype threat, the presence of a negative social stereotype about African Americans can influence their individual academic performance.
Lave and Wenger (1991) have shed light on aspects of the academic learning experiences that are often overlooked. These sociocultural theorists state that theories growing out of
psychological orientations have left areas such as interconnections of activity, activity systems, communities, cultural and political economy within an environmental context, or climate, unexplored (p. 121). Within Lave and Wenger’s framework, the construct of belonging
4
and/or failed to consider the importance the social context of a setting when analyzing stereotype threat. In addition, previous studies have assumed but not assessed a link between stereotype threat and sense of belonging. These issues are addressed in this study by three research questions.
Research Questions
RQ 1: Is there a significant relationship between the perceptions of stereotype vulnerability and sense of belonging for African American college students at a predominately white institution? RQ 2: Does perceptions of campus climate significantly strengthen the relationship between stereotype vulnerability and sense of belonging among African Americans college students at a predominately white institutions?
RQ 3: Are there significant differences in the perceptions of stereotype vulnerability, sense of belonging and campus climate between female and male African American students at a predominately white institution?
Definition of Terms
The construct stereotype threat occurs when an individual perceives that they are
5
perceives his/herself at-risk for stereotype threat, is used as a proxy. This construct will be measured with self-reports on the stereotype vulnerability Scale (SVS).
The construct of sense of belonging is defined as the extent to which an individual feels accepted, respected, included, and supported by others in their school social environment
(Goodenow, 1993). This construct will be assessed with self-reports on the Psychological Sense of School Membership Scale.
6 CHAPTER II
REVIEW OF LITERATURE
In order to address the growing trend towards African American university enrollment and the need for contextual research concerning the perspective of African Americans, this literature review will utilize a socio-cultural framework and examine previous research concerning stereotype threat, sense of belonging, and university campus climate. The
relationship between stereotype threat vulnerability and African Americans students’ sense of belonging will be addressed. Then, literature on the relationship between sense of belonging and campus climate will be explored. Given the relationship of sense of belonging with stereotype threat vulnerability and campus cultural climate, a rationale will be presented that cultural campus climate has a moderating role on the relationship between stereotype threat vulnerability and sense of belonging.
Framework: Sociocultural Learning Theory
7
culture, race and academic achievement include the sociocultural principles of tools and artifacts, multiple levels of embedded systems leading to contradictions between them, interactions with capable others, and identity intertwined in the process of learning.
Tools and Artifacts. Cultural tools and artifacts are critical to learning and development (Wertsch, 1991). Artifacts are both material and ideational. In the material form, artifacts are viewed as tangible material such as pencils, paper, and academic test. While in the form of ideational, artifacts may be words, rituals, or other cultural practices like using the GRE to inform college readiness. Ideational artifacts are tools that have consistently preformed overtime to achieve the goals they are designed to accomplish (Cole, 1998). Artifacts can also represent ideas and cultural conceptions about “self” that facilitate or impair interactions in cultural activities. When individuals, administrators, or other governing bodies maintain the idea that African Americans are worst academically, then an artifact exists that African Americans lack relevant tools for academic success. Furthermore, the assumption of a lack in appropriate tools can restrict the type of activities African Americans believe they can participate in and the activities available to them (Nasir, 2004).
8
Tools are used to achieve goals in activity systems (Wertsch 1991), such as educational attainment. Every African American produces and reproduces his or her culture though activity that is embedded in several higher levels of history and can motivate and be motivated by individual behavior (Cole, 1998; Hand & Nasir, 2006). These systems are divergent; they may not share the same tools, artifacts or operations. The unequal distribution of tools, artifacts, and operations make contradictions possible when systems interact. These contradictions help to create opportunities for development; however contradictions also frame the trajectory for legitimate participation in activities. Participation in cultural activities provides further
activities, cultural tools, and interactions, in that individuals who do not gain entry into a system are not afforded certain activities (Nasir & Cooks, 2009).
Contradictions between Systems. Contradictions in behavior help to explain how larger sociopolitical and economic friction mediate local practices and learning in people (Yeo, Tan, & Lee, 2006). Contradictions vary at different levels within an activity system. Contradictions have been described in four levels. When considered at the primary level, a contradiction
concerns a concept that is inappropriate to accomplish a goal or action. For example using a pen to fill out a “scantron” bubble sheet would be inappropriate because the testing program does not
9
educational setting that encourages individualism and rewards competitiveness (Boykin, Lilja & Tyler, 2004). The fourth level of contradiction proposes that trouble may exist between central
activity and one of its neighboring activities. For example, a tension between participation based learning in a subject area, such as science, that requires acquisition focused activities (Yeo & Tan, 2014).
Social interactions are dialectical and multi-dimensional; containing a personal dimension and interpersonal dimension. The personal dimension is comprised of individual cognition, emotion, behavior, values and beliefs. The interpersonal dimension is comprised of communication, role performances, and interactions with important social others. The
interpersonal dimension also contains the community/institutional planes which hold shared history, language, rules, values, beliefs and identities (Rogoff, 2008). Social interactions
constitute ecologies that integrate the individual, social, and cultural tools that occur during one’s life time.
10
trajectories represent newcomers joining the community with expectations of being full
participants, while peripheral trajectories involve individuals remaining marginal to the practices over time. The differences in trajectories frame leaning opportunities and opportunities for the development of identity (Hood, 2006).
Identity and Learning. According to sociocultural theory, learning is an aspect of identity and identity is a result of learning (Wenger, 1998). This conceptualization presents learning as academic achievement and also as an ontogenetic process of participation in cultural practices and identity creation (Nasir & Cooks, 2009). Identity building in the context of
activities is constant and continual between the individual and other levels of social interactions, including other people, the school, and the United States pedagogic cultural system (Wenger, 1998).
11
imagined identities. Consequently, perceived choices of what to do and how to do things is constrained by a history of participation and identity (Nasir & Hand, 2006).
Ideational artifacts represent ideas about race that constrain the participation of some and enable the participation of others. Stereotypes can be particularly useful in describing how ideational artifacts influence individual thinking and performance (Nasir, 2004). The influence of stereotypes has been a saturated yet unresolved topic since compelling evidence of stereotype threat indicated academic underperformance in individual African Americans can be caused by the introduction of a negative stereotype (Steele, Aronson 1995). Sociocultural theories that utilize levels of analysis and address race and power are useful to frame stereotype threat. Through a sociocultural lens, stereotype threat can be considered a cultural artifact derived over time by an intersection of macro level sociocultural patterns and individual academic functioning (Nasir, 2004).
Stereotype threat
12
In 1995 Aronson and Steele formed an experiment assessing the stereotype vulnerability of African American Students and its effect on academic performance as measured by the GRE. African American participants in the researchers study, expected to take a difficult ability-diagnostic test showed significantly greater cognitive activation of stereotypes about African Americans, greater cognitive activation of concerns about their ability, a greater tendency to avoid racially stereotypic preferences, a greater tendency to make excuses for their performance, and finally, a greater reluctance to have their racial identity linked to their questionnaires.
Reflecting upon these initial results, the researchers concluded Stereotype threat caused the grades and test scores of negatively stereotyped students not to be commensurate with their ability (Walton & Spencer, 2009). Perhaps more importantly, the concept of “stereotype threat” which has saturated academic literature over the past 20 years, proposes that the mere threat of confirming the stereotype that African American cannot achieve at the level of European Americans can decrease an individual’s academic functioning (Steele & Aronson, 1995). For African Americans, experiencing negative stereotypes can create a chronic evaluative threat (Cook, Purdie-Vaughns, Garcia, & Cohen, 2012).
13
participants were also asked to indicate the likelihood that their responses were correct from nine probability estimates from 20% to 100%. These researchers found that African Americans who were stereotype vulnerable knew less about their abilities than less vulnerable African Americans and non-stereotyped individuals such as European Americans. This finding indicated that
stereotype vulnerability impairs knowledge of self by promoting an over calibration of capability. The researchers concluded “self-presentational” concerns or a “bravado response” may have led students to present themselves in a more favorable light (Aronson & Inzlicht, 2004).
Good, Aronson, and Inzlicht (2003) explored a long term intervention for stereotype threat designed for adolescents in middle school. In a mentoring program the researchers exposed an experimental group of minorities to the “expandable nature of intelligence” and the power of a student to bounce back after academic disappointment. Prior to the experiment and upon the conclusion of the mentoring sessions the students were given the Texas Assessment of Academic Skills (TAAS) test. At the end of the school year, the students were administered the TAAS test again. Good et al.’s findings corroborated with their hypotheses. Encouraging seventh graders to attribute poor academic performance to factors outside their own ability was found to enhance their performance.
Aronson, Fried and Good (2002) induced a sense of the malleability of intelligence for a group of African American college students in order to target stereotype threat. College students were encouraged to send messages to middle school aged youth. In the malleable pen pal
14
promoted the malleability of intelligence and the importance of passing the message on. College students in the control pen pal condition were also instructed to encourage their young pen pals, but they were told to give a different message. The non-pen pal condition did not receive any intervention via a pen pal. The grades of the European American and African American and students in the experimental pen pal group improved. While a reported academic enjoyment indicated measured by questionnaire persisted for the African American students, over time academic enjoyment dissipated for the European American students.
Cohen and Walton (2007, 2011) explored the use of value affirmation as a protective factor for stereotype threat. Seventh grade students in an experimental condition were instructed to write 15-20 sentences at the beginning of the school year about two personal values. Seventh grade students in the control condition were instructed to write about values that were not important to them. The academic performance for students in the experimental condition surpassed the academic performance of those in the control condition and persisted for two years. African American students in the experimental condition received significantly higher grades than their peers in the control condition, lessening a gap in achievement by 40% (as cited by Yeager & Walton, 2011).
Stereotype threat not only involves the personal identity but also the social identity. Currently, the general consensus toward the application of stereotype threat is to approach it as a multi-threat concept in order to most accurately predict when and who threats will affect.
15
become concerned their actions will appear stereotypical which may causes arousal and
underperformance. Social identity threats affect ones concept of the social group. Such a threat may undermined an individual’s belief that their group is competent to address negative
stereotypes thus causing arousal and underperformance (Wout, Danson, Jackson and Spencer, 2007).
Three processes involving imbalances between task domain, personal identity, and social identity have been identified to elicit stereotype threat (Schmader, John, & Forbes 2008). The first process occurs when one is performing in a given domain where a negative stereotype exists. Researchers typically manipulate this process by priming negative connections between one’s group and performance domain. A second process that leads to an imbalance is when environmental cues cause one’s social identity to be more salient than their personal identity. Such a process is related to stereotype threat experienced by minority groups performing in majority context. Lastly, an imbalance can occur when individuals derive worth from their personal identity when performing well on particular task in which their social group is known to underperform (Schmader, John, & Forbes 2008).
16
face interactions, shifts in positioning over time, and the capital associated with practices in the social history of communities.
Studies on stereotype threat have proposed interventions, and identified factors related to resilience (Aronson & Inzlicht, 2004; Good, Aronson, & Inzlicht, 2003). Unfortunately, many of the proposed interventions seem to lack true applicability as they do not appear to be situated in individuals’ experiences. They propose messages which African Americans often times do not
hear in life or not as often as dialogues on racial disparities. Factors related to resilience in the face of stereotype threat are useful but run the risk of becoming traits placed in people instead of commonalities between people and their culture (Gutiérrez & Rogoff, 2003). For example, studies addressing resilience also fall short in addressing stereotype threat because there has been little consideration of how an African American who initially responded to stereotype threat can learn over time through interactions within and between activity systems to overcome stereotype threat.
Prior interventions have not taken into consideration contextual factors, such as, the impact of curriculum, quality of instruction nor aspects of the objective environment (Spitzer & Aronson, 2015). Previous interventions may be useful in sterile conditions, but the real
17
To address the issues of a more ecologically situated perspective on stereotype threat, Purdie-Vaughns, Steele, Davies, Ditlmann, & Crosby (2008) found that setting alone can signal the degree of threat an individual experiences.The researchers found aspects of a setting can convey a message or cue that the treatment of an individual is contingent upon his group identity. Furthermore the researchers address the importance of considering aspects of the environment as functions of an African Americans connection to the setting.
Sense of belonging
The need for social belonging—for seeing oneself as socially connected—is a basic human motivation (Baumeister & Leary, 1995). Sense of belonging is a fundamental drive to obtain lasting positive interpersonal relationships (Baumeister & Leary; Osterman, 2000). Belonging is synonymous with relatedness (Osterman, 2000). Students who experience a sense of relatedness are more likely to have positive attitudes toward class assignments, exhibit more engagement in school, participate more in school activities and invest more effort in the learning process. Several studies have linked a sense of belonging to positive outcomes such as greater academic motivation (Goodenow & Grady, 1993; Anderman & Anderman, 1999). Male students may experience a sense of belonging differently than female students; experiencing sense of belonging to a lesser degree (Osterman, 2000; Goodenow, 1993). Students from
underrepresented groups also have different experiences when it comes to sense of belonging (Goodenow & Grady, 1993; Hurtado & Carter, 1997).
18
can co-occur with perceived negative social-academic experiences (i.e., loneliness & criticism from an instructor). When this co-occurrence arises, students may perceived it as evidence that they do not belong in academic settings.
Cohen and Walton (2007) found that negatively stereotyped groups are less certain about their social bonds in professional settings and more likely to question their social belonging. Like stereotype threat, sense of belonging is sensitive to group representation in a setting. A decreased sense of belonging can occur in the absence of negative feedback or evaluation. Cohen & Walton (2007) manipulated sense of belonging by encouraging a group of students to believe that they were lacking friends in their field of choice. African American students under this condition reported a significantly lower sense of fit and potential in their field of study. In a second study Cohen & Walton (2007) found that sense of belonging or fit for African Americans is vulnerable to level of adversity experienced within a day.
A sense of belonging is particularly important for students as they begin college, due to the stress associated with academic pressure, loneliness (Spitzer & Aronson, 2015), structural differences in the environment and high expectations of autonomy (Wilson & Gore, 2013). In addition, students are experiencing the loss of some pre-college relationships. On college campuses, positive interactions with faculty and positive peers as well as academic integration and a commitment to obtaining a degree are all important components of academic success (Tinto, 1987). For college students, higher levels of student sense of belonging is associated with higher grades, higher perceived academic competence, increased self-worth and less
19
belonging undermines student performance and health (Wilson & Gore, 2013; Walton & Cohen, 2007).
In order to enhance the academic performance of group of African American college students, Cohen & Walton (2011) devised a short intervention to promote sense of belonging. Students first read a fabricated report that surveyed senior students at their school. The reported indicated that most students worried about whether they belonged in college during the difficult first year but grew confident in their belonging with time. To internalize the message,
participants wrote an essay describing how their own experiences in college echoed the
experiences summarized in the survey. Participants turned their essay into a speech and delivered the speech while being video taped. African Americans in the control group showed no
improvement in GPA from the fall of their freshman year through their senior year. By contrast, the GPAs of intervention-treated African Americans rose over time. By the students’ senior year, the difference in achievement between European Americans and African American students was cut by 79%.
20
Purdie-Vaughns, Garcia, & Cohen, 2012; Purdie-Vaughns, Steele, Davies, Ditlmann, & Crosby 2008).
Campus climate
Perceptions of racial tension are not created solely in the minds
of specific individuals, but rather are rooted in a shared institutional reality (Hurtado, 1992, p.557). An individual’s participation in a setting is dependent upon the varying historical situations that molded and continue to mold the social world in which they dwell (Holland & Lave, 2009). Structural properties of an environment are integral to shaping social interaction and individual attitudes and behaviors of actors within a system (Hurtado, 1992). The climate of a campus can be defined as current perception and attitudes of students regarding issues of diversity on campus (Rankin & Reason, 2005). This definition includes personal campus experiences and perception of institutional actions.
21
Perceptions of racial climate differ by institution. The ethnic composition and selectivity of a university impact perception of campus climate (Hurtado, 1992). A great number of
Predominantly White Institutions (PWIs) have a history of exclusionary practices (Milem, Clayton-Pedersen, Hurtado, & Allen, 1998). A college's historical legacy of exclusion can determine the prevailing climate and influence current practices (Hurtado, 1992). Specifically, historical remnants of segregated campuses continue to affect the climate for racial/ethnic diversity on college campuses through old policies that promote homogeneity and
attitudes/behaviors that hinder interracial interaction (Milem, Clayton-Pedersen, Hurtado, & Allen, 1998). Research indicates that perceptions of a supportive environment reinforce positive learning and social outcomes (Rankin & Reason, 2005).
Perception of campus climates differ as a function of racial group. Students of color report campus climate experiences that are offensive, hostile or intimidating in nature and that interfere with learning to a higher degree than European American peers (Rankin & Reason, 2005) In their 2000 study, Ancis, Sedlacek, & Mohr found that African American college students reported more racial tension in residence halls than their European American peers, reported less faculty respect for diverse ethnic groups than their European American peers (less equitable treatment by faculty), more pressure to minimize overt racial-ethnic group
characteristics (language, dress) to fit in and more pressure to conform to stereotypes concerning their race in order to fit in.
In a qualitative study, Johnson-Ahorlu, (2013) explored stereotypes and cultural climate of African American students, who voiced perceptions of stereotypes on their campuses and
22
Americans as “intellectually incapable” and “undeserving of university admission” (p. 387). Focus group participants expressed a pressure to not conform to stereotypes about African Americans and to demonstrate group worth.
Rankin and Reason (2005) found that African American students were more likely to disagree that their university promoted diversity and less likely to agree that curriculum represented contributions of people from underrepresented populations in comparison to their European peers. In addition, African Americans were significantly more likely to endorse the use of workshops on race, and mandatory classes and staff training as institutional strategies to address race issues. Overall, African Americans reported that institutional interventions would improve campus racial climate. This finding is consistent with previous research. Academic courses which address diversity are associated with a decrease in racial bias (Milem, 2003), the quality of interaction with diverse peers and a commitment to social action (Laird, Engberg, & Hurtado, 2005). Diversity workshops are associated with individuals that are open to diversity
and an increased satisfaction with college. Rankin and Reason (2005) concluded thatworkshops, training, as well as fiscal and administrative interventions should be utilized to improve
perceptions of campus climate. The researchers assert that faculty members are socializing agents on campus, setting intellectual and behavioral norms. Fiscal and administrative
interventions may include recruitment and retention of faculty members of diverse groups. The research also indicated that the presence of faculty members of underrepresented populations has a positive impact on perceived racial climate and student outcome.
23
per context, therefore, exploration should occur with consideration of setting. In order to fully analyze academic concerns faced by underrepresented populations, it would be beneficial to integrate campus climate with research on cognitive processes, such as stereotype threat in specific environments.
Rationale
Increases in college enrollment during the 1990’s have not lead to equivalent campus
experiences for African American college students (Ancis, Mohr, & Sedlacek, 2000; Rankin & Reason, 2005). The academic difficulties experienced by African American students, within
educational systems in the United States, remains one of the most perplexing and pressing concerns within educational systems in the United States (Rovai, Gallien Jr, & Wighting, 2005). Extensive research has indicated that stereotype threat is a factor that limits academic
performance for African Americans (Steele & Aronson, 1995; Aronson & Inzlicht 2004; Walton & Spencer, 2009). In spite of sustained efforts, interventions have been largely ineffective as evident by the persistence of the differences at all achievement levels (Rovai, Gallien Jr & Wighting, 2005). In order to provide interventions that are ethically and culturally relevant, information regarding the perspectives of diverse students is needed (Ancis, Mohr, & Sedlacek, 2000). These perspectives are situated in and inseparable from their socio-historical context
(Holland & Lave, 2005).
24
Americans through interventions involving correcting faulty attributions about environmental cues and providing affirmation in non-affirming environments (Yeager & Walton, 2011; Cohen & Walton 2011). Furthermore research indicates that a sense of belonging is impacted by
environmental cues within a setting (Walton & Cohen, 2007). Environmental cues such as racial composition, are also components of a campus’ climate (Reason & Rankin, 2005; Hurtado, 1992).
Prior research has not explored the campus climate of colleges and universities, in the context of stereotype threat, even though studies indicate that environmental settings impact stereotype threat (Purdie-Vaughns, Steele, Davies, Ditlmann, & Crosby, 2008) as well as a sense of belonging ( Cook, Purdie-Vaughns, Garcia & Cohen, 2012). Campus climate involves
perceptions of attitudes and actions of campuses with regards to diversity (Rankin & Reason, 2005). African American students report campus experiences that include a lack of support and unreceptive campus environments (Rankin & Reason, 2005); especially in Predominantly White Institutions (Milem, Clayton-Pedersen, Hurtado, & Allen, 1998). Male African American
students are more susceptible to differences in academic experiences; indicated by decreased rates of academic outcome measures (i.e., four year graduation rate and first year GPA).
As discussed above, the cultural context or climate has implications for the social outcomes of students; therefore cultural climate is an important construct for higher education research and policy (Rankin & Reason, 2005). Campus climate may moderate a relationship between perceptions of stereotype threat and sense of belonging. A moderator is a variable that
25
setting’s climate may lessen the strength of the relationship between perceptions of stereotype threat and perceptions of belonging. The association between stereotype threat, sense of belonging and campus climate should be analyzed in order to identify factors that can inform future interventions and improve the campus experience of African American college students attending predominately white institutions.
Hypotheses
H1: There will be a significant negative relationship between self-reports of stereotype vulnerability and sense of belonging among African American college students at a predominately white institution.
H2: The strength of the relationship between self-reports of stereotype vulnerability and sense of belonging among African American college students at a predominately white institution will be significantly moderated by the addition of perceptions of campus climate, with a decrease in the strength of the relationship.
H3: There will be significant differences on self-reports of stereotype vulnerability, sense of belonging and campus climate between African American female students African American and male students at a predominately white institution. Specifically, male students will report
26 CHAPTER III METHODOLOGY
The overarching purpose of this study was to examine the contextual perceptions African American college students at predominately white institution. Specifically, this research
examined the relationship between stereotype vulnerability, sense of belonging and campus climate among African Americans at a predominately white institution in the south. This chapter describes the research design and analysis, the targeted population, data collection process and the measures utilized.
Research Design and Data Analysis
27
28 Figure I
Moderator Model Utilizing Hierarchical Linear Regression
X1 × X2 Interaction X1: stereotype
vulnerability
Y: sense of belonging X2: campus
29 Study Participants
All participants were students enrolled at The University of North Carolina at Chapel Hill (UNC-CH) who self-identified as African American. Participants included current
undergraduate and graduate students, over the age of 18. The sample population included one hundred and two male and female students.
Setting history and context. The university used in this research study has an overall population of approximately 29,000 graduate and undergraduate students (UNC-CH Diversity & Multicultural Affairs, 2014-2015).The racial composition of the targeted setting indicates a downward trend of enrollment rates of African American students in the past five years. In this setting, 8.5% of undergraduate students and 7.4% of graduate students are African American. The four year graduation rate is 81% for black females and 61% for black males. The university average four year graduation rate is 85.5% for females and 77% for males. African American faculty members represent 5.3% of faculty of the overall faculty population. On the campus of UNC-CH differences in academic attainment can be viewed in statistics concerning male African American students.
30
frustration for the Black students attending UNC-CH. The Student Body was created by Julia Balk in October of 1990. It was installed in front of Davis Library. After the sculpture’s
installation, UNC-CH students expressed disapproval of some of the statues, which they believed promoted racial and gender stereotypes. The work consisted of a group of seven bronze figures, including an African American male figure twirling a basketball on his finger, an African American woman balancing a book on her head, an Asian American women carrying a violin, and a white woman holding and apple and leaning on her male companion’s shoulder. Saunders Hall (now Carolina Hall) was a building on campus named after William Saunders, a UNC graduate and trustee who was secretary of state in North Carolina from 1879 to 1891. Saunders was also a Klu Klux Klan member. Student protests prompted the renaming of the building in 2015. The Unsung Founders memorial was commissioned by the 2002 senior class at UNC-CH, in order to honor the black slaves and freed men who contributed to the building of UNC-CH. All four of these artifacts have promoted a dialogue and at times protests concerning race and culture. In addition, these structures impact the social systems and activities within a setting. Procedures
Prior to conducting this research study, the primary researcher submitted the proposal for ethical review by the university’s institutional review board (IRB). Upon approval, data
31
meetings with the lead investigator. The undergraduate research assistant’s role was to provide copies of the recruitment letters (see Appendix B) to members of campus minority organizations (ex. The Black Student Movement, historically black sororities and fraternities). In order to unsure confidentiality, only the principal investigator had access to data collected and any identifying information. The university undergraduate assistant’s access to research study materials was restricted to the recruitment letter.
The recruitment letter referred students to a single questionnaire on the Qualtrics website by providing a web address. The Qualtrics software program is anonymous (individual
32
The questionnaire did not include questions about the participants' names, email address, physical addresses, or IP addresses. To obtain information needed to distribute the raffle
incentive and still keep survey responses anonymous, the survey responses and the contact information were stored in two separate locations. Two surveys were created; the questionnaire previously mentioned and a second “incentives” survey that collected the information needed to deliver incentives to participants. The average completion time for the questionnaire was twelve minutes. After completion of the questionnaire, participants indicated their willingness to enroll into a raffle for several monetary awards of fifty dollars. Qualtrics redirected willing participants to the separate survey within the Qualtrics program, to provide a name and a mailing address. Data collection occurred for eight weeks. After data collection, participants were randomly selected for the monetary raffles and gift cards were mailed to participants.
Measures
33
of my gender” (Barnard, Burley, Crooks, & Olivares, 2008). Steele, James, and Barrett (2002) have noted the internal consistency for this measure to be high as .84.
Dodson-Sims (2005) adapted this stereotype threat vulnerability measure for African Americans and academic achievement by changing terms indicating gender to terms indicating race and academic ability (i.e., “My academic success may have been easier for people of my race”). This adapted scale is also on a 7 point Likert Style scale. Dodson-Sims (2005) formed a
pilot study of 37 randomly assigned African Americans. The eight items on this adapted measure were found to reflect two dimensions. Dimension one was labeled “negative personal experiences”. Questions such as “Professors expect me to do poorly in class because of my race” and “Some people feel I have less academic success because of my race” were included in this dimension. Dodsen-Sims (2005) reported the internal consistency of this dimension was moderate (Cronbach’s alpha =.70). The second dimension was labeled “racial group
characteristics”. Questions such as “People of my race rarely face unfair evaluations in academic classes” and “My race does not affect people’s perception of my academic
achievement” were included in this dimension. The internal consistency for this dimension was also found to be moderate (Cronbach’s alpha .50).
Psychological Sense of School Membership: Sense of belonging was assessed utilizing the Psychological Sense of School Membership Scale. Goodenow (1993) designed The
34
with good internal consistency (Alpha =.88). Questions include: “I feel like I am a part of my school” and “Teacher’s at my school respect me”. The Psychological Sense of School
Membership Scale utilizes a 5-point scale (1 not true at all to 5 completely true).
Subsequent studies have utilized the Psychological Sense of School Membership Scale at the high school level (Sanchez, Colon, & Esparaza, 2005; Shochet et al., 2007), as well as the university level (Freeman et al., 2008; Pittman & Richmond, 2007). In order to utilize the Psychological Sense of School Membership Scale with a college population Pittman and Richmond (2007) made slight modifications to the scale. For example, “Most teachers at my school are interested in me” was modified to “Most professors at [name of university] are interested in me”. Pittman and Richmond (2007) found the internal consistency to be good (αT1 = .91, αT2 = .97). Items 3, 6, 9, 12 and 16 of the scale were negatively worded so they were
reverse coded that a high value indicates the same type of response on every item. The scores are summed into a total score. Higher scores indicate higher levels of sense of belonging.
Campus climate: The Climate Survey was adapted from the NC State University campus climate Survey. The NC State University campus climate Survey assesses student’s beliefs concerning the campus’s focus on diversity and inclusion, particularly for
underrepresented populations. This instrument is normed on undergraduate and graduate
35
external to participants), Milieu (items that represent characteristics of individuals at the school), Social System (items that represent patterns or rules (formal & informal) of operating or
interacting in the school) and Culture (items that reflect campus norms, values, belief systems concerning diversity).Figure II provides an illustration of how the study at hand conceptualizes campus climate through the lens of Tagiuri, Litwin & Barnes (1968).
36
Ecology: Physical locations and materials (i.e., campus buildings
and classroom curriculm)
Milieu:
Charactersitics of individuals at the
institution.
Culture: Believes, values norms concerning diversity
Social Systems:
Formal and informal rules of interacting within
the setting
Figure II
Campus Climate Model
:
Climate
Sociocultural Context:
Historical context (i.e., inclusion/exclusion practices;
37 CHAPTER IV
RESULTS
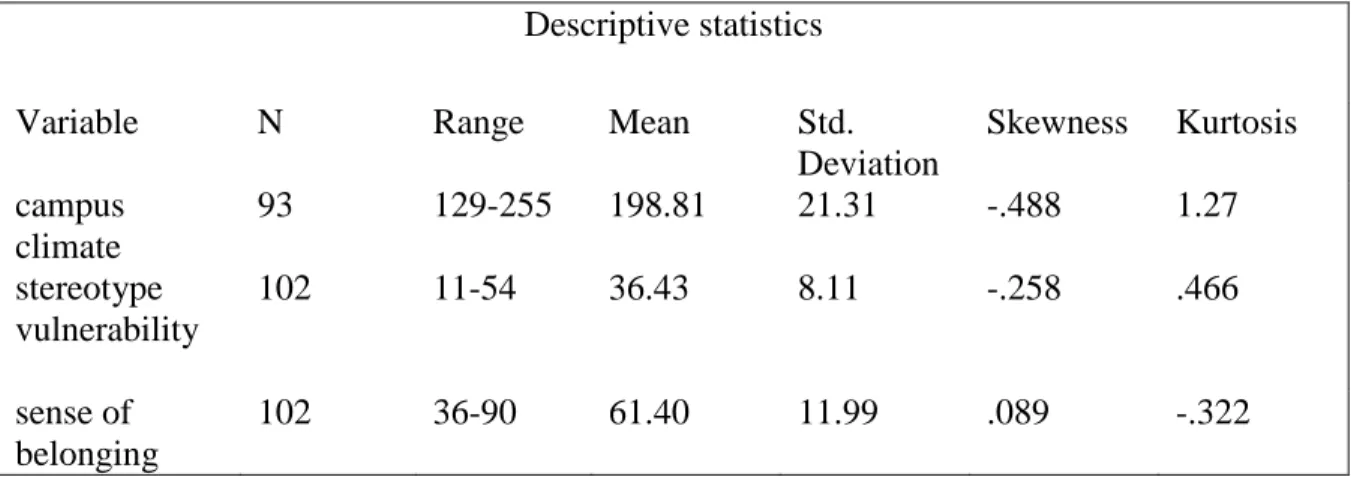
This study examined the relationship between perceptions of stereotype vulnerability, sense of belonging and campus climate among African American students at a predominately white institution in the south. This chapter presents the data analysis, descriptive statistics and results found. As a preliminary step, the data was screened for normality and outliers, and reliability coefficients were determined. The data suggested no serious departures for normality with reference to skewness and kurtosis (see table 1). Descriptive statistics based on the variables were derived. Range, mean and standard deviation scores were computed for the stereotype vulnerability, sense of belonging and campus climate scales. Reliability coefficients were assessed for each measure. Analysis of Cronbach’s alpha for the measures indicated good internal consistency; sense of belonging (.91), campus climate (.84), and stereotype vulnerability Scale (.78).
Table 1: Means, Skewness and Kurtosis for Variables Descriptive statistics
Variable N Range Mean Std.
Deviation
Skewness Kurtosis campus
climate
93 129-255 198.81 21.31 -.488 1.27
stereotype vulnerability
102 11-54 36.43 8.11 -.258 .466
sense of belonging
38 Expected
Years to Graduate
93 1.00-2.00 1.09 .28 --- ---
Descriptive statistics were derived for major demographic characteristics of the sample population (see table II). One-hundred and thirty-one students began the survey, however, only One hundred and two responded with sufficient data for analyses. The majority of respondents (77%) were female students. Although ages ranged from eighteen to forty-nine, roughly sixty-two percent of participants were aged eighteen to twenty. The majority of respondents were in their junior year (31%), however, a substantial amount of respondents were in their freshmen (18%), sophomore (19%) and senior (21%) years. Eight percent of respondents were doctoral students. The majority of participants reported a middle-class upbringing (40%). Furthermore, the majority of respondents (31%) endorsed that they attended a high school where they were a different race than most students.
Table II: Participant Demographic Characteristics
Variable N %
______________________________________________________________________________
Total Participants 102 100
Graduate Students 9 8.82
Undergraduate Students 93 91.17
Gender
Male 23 22.55 Female 79 77.45 Age
18-20 64 62.27
21-25 33 32.35
26-29 3 2.94
30-39 0 0
40-49 2 1.96
39
Freshman 19 18.62 Sophomore 20 19.60 Junior 32 31.37 Senior 22 21.56 Doctoral 9 8.82 Socioeconomic Background
Low Income 10 9.80 Working Class 31 30.39 Middle Class 41 40.19 Upper Middle Class 18 17.64 Upper Class/Wealthy 2 1.96 Racial/Ethnic Composition of High School
All/nearly all students were the same race 22 20.75 Most students were the same race as participant 11 10.78 Half of students were the same race as participant 24 23.52 Most of students were a different race as participant 32 31.37 All/Nearly all students were a different race 13 12.74 GPA Ranges Reported by Undergraduate Participants
4.00-3.50 24 25.80 3.49-3.00 35 37.63 2.99-2.50 25 26.88 2.49-2.00 8 8.60 Below 2.0 1 1.07
Hypothesis one proposed that there was a significant negative relationship between the perception of stereotype vulnerability and sense of belonging for African American college students at a predominately White institution (see table III). As predicted, the relationship (r = -.577, p < .01) between stereotype vulnerability and sense of belonging was significant and negative, suggesting that students who perceived higher levels of stereotype vulnerability,
40
Additional correlations were conducted to assess possible associations in the demographic information (see table III). GPA was found to be negatively correlated with stereotype vulnerability (r=.-223, p<.05) and positively correlated with sense of belonging (r=.268, p<.05). Respondents who perceived higher levels of stereotype vulnerability self-reported lower GPA levels. On the other hand, respondents who perceived higher levels of sense of belonging were more likely to report higher GPA levels. A point-biserial procedure was run to assess relationships between gender and the primary variables as well as demographic variables. A positive correlation was found for gender and stereotype vulnerability (r=.288, p<.01). A negative correlation was found for gender and sense of belonging (r=-.308, p<.01). Male participants were coded as one and female participants were coded as two; therefore this indicates that women were reporting higher levels of stereotype vulnerability and lower levels of sense of belonging than men. Higher scores on the Expected Years to Graduate demographic question meant more years to graduate (Question 6; 1=4 years, 2= 5 years, 3= 6 years). A
41 Table III: Summary of Correlations for Variables
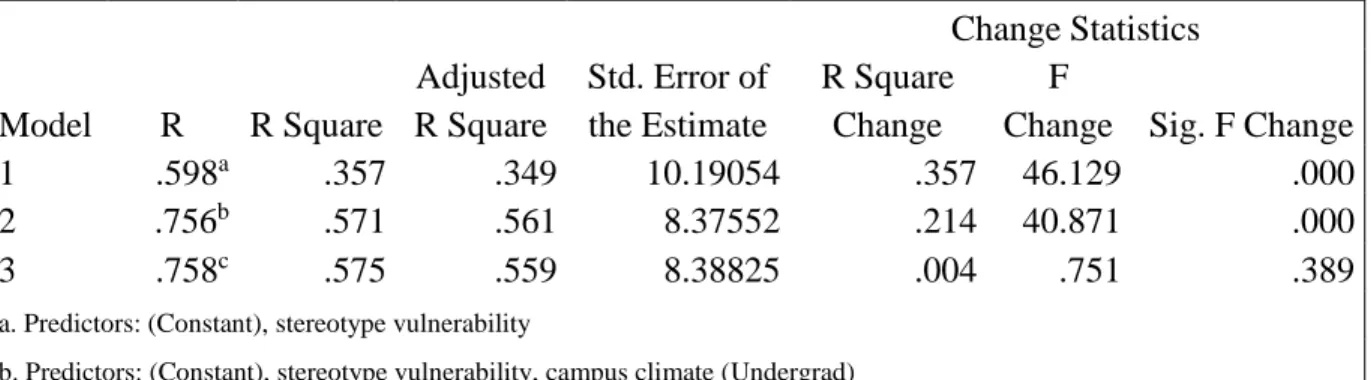
Hypothesis two stated that campus climate moderated the relationship between stereotype vulnerability and sense of belonging among African Americans college students at a
Predominately White Institution. A hierarchical multiple regression analysis was conducted to test hypothesis two with sense of belonging as the dependent variable (see table IV). In the first step, stereotype vulnerability accounted for a significant amount of variance (36 %) in sense of belonging, F (1, 83) = 46.13, p < .001. Campus climate was added to the regression model, which accounted for a significant portion of variance (57%) in sense of belonging, F (2, 82) = 54.58, p < .001. Next, the interaction term between stereotype vulnerability and campus climate was added to the regression model, to test the moderating role of campus climate in predicting
Variables SV SB CC
(U)
Gender Socio-economic background
Classification Age Expected Yrs. to Graduate GPA Stereotype Vulnerability (SV) 1 Sense of Belonging (SB)
-.577** 1
Campus Climate (Undergrad)
-.516** .679** 1
Gender .288** -.306** -.167 1
Socio-economic background
-.025 .168 -.015 .098 1
Current Classification
.095 .060 -.139 .083 .158 1
Age -.084 .105 -.003 .113 .091 .666** 1
Expected Yrs. to Graduate
.009 .136 .030 .280** .192 .069 -.034 1
GPA -.223* .268* -.044 .033 .230* -.103 -.181 .371** 1
**. Correlation is significant at the 0.01 level (2-tailed).
42
sense of belonging. This term did not account for a significant proportion of the variance in sense of belonging F (1, 81) = 1.49, p = .227. Campus climate did not moderate the relationship between stereotype vulnerability and sense of belonging.
Table IV: Hierarchical Regression Analysis Summary
Model R R Square
Adjusted R Square
Std. Error of the Estimate
Change Statistics R Square
Change
F
Change Sig. F Change
1 .598a .357 .349 10.19054 .357 46.129 .000
2 .756b .571 .561 8.37552 .214 40.871 .000
3 .758c .575 .559 8.38825 .004 .751 .389
a. Predictors: (Constant), stereotype vulnerability
b. Predictors: (Constant), stereotype vulnerability, campus climate (Undergrad)
c. Predictors: (Constant), stereotype vulnerability, campus climate (Undergrad), stereotype vulnerability X campus climate
43
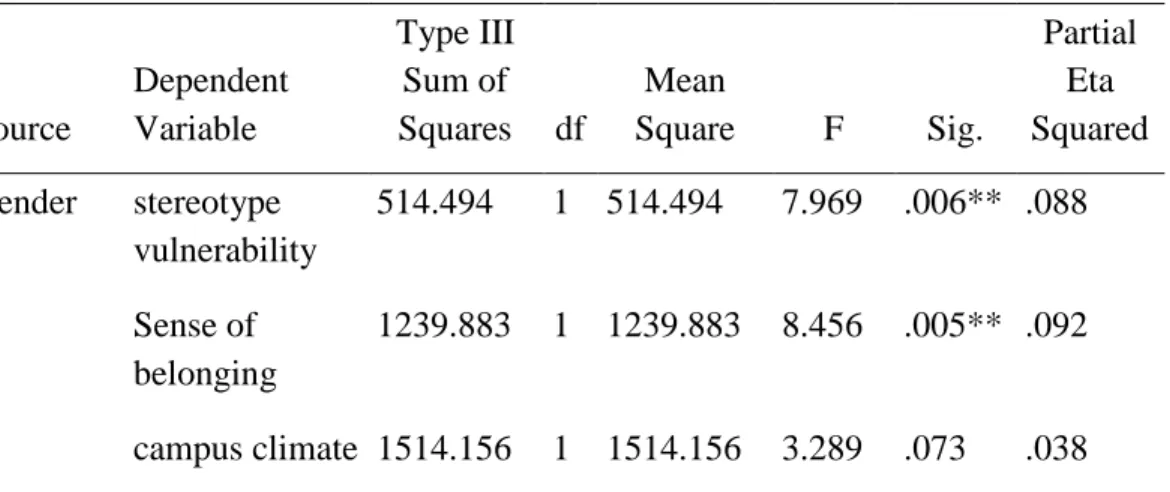
was not significant with mean scores for males being 196.83 and 205.18 for female students reflecting the lack of differences in their perceptions of campus climate.
Table V: MANOVA Summary for Gender Differences among Stereotype Vulnerability, Campus Climate and Sense of Belonging
Source
Dependent Variable
Type III Sum of Squares
df
Mean
Square F Sig.
Partial Eta Squared Gender stereotype
vulnerability
514.494 1 514.494 7.969 .006** .088
Sense of belonging
1239.883 1 1239.883 8.456 .005** .092
44 CHAPTER V DISCUSSION
The focus of this research study was to examine relationships and an interaction between stereotype vulnerability, campus climate and sense of belonging. As predicted, a negative relationship was found between student sense of perceived stereotype vulnerability and perceived campus climate at the university. In addition, a positive association was found between perceived campus climate and student perceptions sense of belonging. However, the relationship between student perceptions of sense of belonging and stereotype vulnerability was not influenced by the campus climate of the university. Interestingly, gender differences were found in perceptions of stereotype vulnerability and sense of belonging but not campus climate. Contrary to the predictions of this research study, female participants reported experiencing stereotype vulnerability to a greater degree and a sense of belonging to a lesser degree than male participants. Chapter five, expounds these findings, explores implications for universities, discusses limitations of the study, and concludes with future areas of research.
45
environmental cues and perceive them as an indication that they do not belong in the university
setting (Purdie-Vaughns, Steele, Davies, Ditlmann & Crosby, 2008). A practical example of this
is a student of a stereotyped group who receives a poor grade on a paper and attributes the
teacher’s feedback to their lack of fit in the domain assessed or the teacher’s disinterest in their
ability. With increased perceptions of stereotype vulnerability, critical feedback and evaluation
become threats and indicative of a hostile environment, instead of opportunities for challenge
and growth (Cook, Purdie-Vaughns, Garcia, & Cohen, 2012). This may lead to periods of
disengagement (i.e., the immediate withdrawal from preforming tasks within an academic domain) and eventually disidentification (i.e., progressively placing less importance on one’s performance within an academic domain); thus narrowing of future career paths for African American students (Woodcock, Hernandez, Estrada& Schultz, 2012). Disidentification and disengagement are both self-protective strategies; employed to place distance between a
student’s self-concept and their performance on a stereotyped area (i.e., academic domain for
African American students).
46
research study reported that few or none of their courses clearly integrated diversity into course content (i.e., diversity topics, authors of diverse populations, global perspectives). Through a sociocultural lens, this is an indication that the environment lacks appropriate material and ideological artifacts, which can hinder activities or interactions within systems. Environmental factors, that comprise an institution’s climate, can invoke a sense of threat by making the stereotype more salient. A number of environmental factors have been identified that make stereotypes more salient. One of these factors is token status, if a student is one of few members of a stereotyped group in a setting (Sekaquaptewa & Thompson, 2003; Steel & Aronson, 1995). Another factor is Identity Salience, defined as highlighting that a student is a member of the stereotyped group, for example, documents requesting that a student provide their race. An additional factor is when an evaluation is in the stereotyped domain for the stereotyped group (Aronson, Fried & Good 2002; Steele & Aronson, 1995). For example, there is a perception that women underperform in science, technology, engineering and mechanical (STEM) fields,
therefore; stereotype threat can arise for women when they are assessed in STEM subjects. If the individual assessing the student is not a member of the stereotyped group, stereotypes concerning the subject area also become more salient. For example, women perform better on standardized math tests when their proctors are female than when their proctors are male (McGlone &
Aronson, 2006; Shih, Pittinsky & Ambady, 1999).
47
However, females, but not males reported higher levels of stereotype vulnerability and lower levels of perceived campus climate and sense of belonging. One explanation for this finding is the impact of intersecting identities (Purdie-Vaughns & Eibach, 2008). African American women represent a marginalized group nestled within a stigmatized group. This may heighten their susceptibility for stereotypes. African American women confront both gender and racial stereotypes concerning STEM and mathematic fields. (Schmader, 2002; Shapiro & Williams, 2012; Spencer, Steele & Quinn, 1999).
It is also possible that other variables account for differences in outcomes for male and female African American students seen at predominately white institutions. Male students may differ in individual characteristics, such as, college preparedness, indicated by pre-college GPA, SAT/ACT scores and previous classroom experiences (Allen, Robbins, Casillas & Oh, 2008; Combs, Slate, Moore, Bustamante, Onwuegbuzie, & Edmonson 2010). In addition, African American males in this research study represent a smaller proportion of the overall university population than African American females. This may factor into observed differences in academic experiences between female and male African American students in this research study.
Implications
48
perceptions of sense of belonging and campus climate and stereotype vulnerability via a multi-level plan of action.
Within the university ecosystem, professors are vital agents for modeling campus
expectations and disseminating belief systems of the campus community concerning diversity to students. Administrative/fiscal policies that prioritize the recruitment and retention of African American faculty members promote campus climate. Further, the presence of faculty of color is linked to positive perceptions of climate and student outcomes (Milem, 2003; Rankin & Reason, 2005). Institutional policies and university declarations should explicitly support racial/ethnic diversity and disavow racism by faculty, staff and students. Over a third of the participants in this research study reported experiencing inappropriate, stereotypical remarks from peers on campus. This can be targeted through mandatory workshops and classes on race/ethnicity (Rankin & Reason, 2005). Another way to promote climate through university policy is through
49
Faculty members are socializing agents within a university that set intellectual and social norms (Rankin & Reason, 2005). Forging positive professor-student relationships foster an inclusive climate and promote sense of belonging. Classroom environments provide a space to explore effective communication strategies of different dialogues and challenging mechanisms of social development. Open and on-going dialogues on race and the importance of diversity are important to foster a positive campus climate and promote student sense of belonging (Milem, 2003; Rankin & Reason, 2005).
Classroom level strategies that target stereotype threat and sense of belonging also highlight the importance of a growth-mindset. A growth mind-set based approach emphasizes the normality of failure and the malleability of intelligence (Aronson, Fried, Good, 2002; Good, Aronson and Inzlicht, 2003; Dweck, Walton, & Cohen, 2014). Through this approach, students are encouraged to view critical feedback as a belief in their ability to meet high standards. In addition, success is not attributed to innate ability but effort, utilizing strategies and seeking help. Professors whom promote a growth-mind set, inform students that they perceive intelligence is malleable, regardless of the race/culture of a student.
50
able to control important outcomes (Cohen & Walton 2011 & Fischer, 2010). Value-affirmation writing assignments and interactive projects remind negatively stereotyped students of the attributes they value in themselves. Research has confirmed that reflecting upon diverse,
positive aspects of self reduces stress, helps negative effects seem less threatening and improves functioning (Yeager & Walton, 2011).
Limitations
Although this research study produced important finding on stereotype vulnerability, sense of belonging and campus climate, several factors limited the results. One limitation was the sample size, in particular, a limited number of male respondents. Participants were recruited through various African American student organizations and campus functions. It is possible that a disproportionate number of the members of these African American organizations are female students. Another limitation was the lack of information concerning individual variables that may be associated with stereotype vulnerability and sense of belonging. Such variables include college preparedness (Allen, Robbins, Casillas, & Oh, 2008), parental SESand first generation college status (Harackiewicz et. al., 2014).While information on parental SES was collected for descriptive statistics, a limited small size in each SES background (i.e., low income, working class, middle class, upper middle class, wealthy), prevented the adequate exploration of parental SES in this study. Parental SES impacts academic experience through both stereotype threat and sense of belonging (John-Henderson, Rheinschmidt, Mendoza-Denton & Francis 2014; Jury, Smeding, Stephens, Nelson, Aelenei & Darnon, 2017).
51
relationships among stereotype vulnerability and campus climate and sense of belonging. In addition, this research study did not take into account socio-historical context nor history as a confounding variable. A historical event, unrelated to the aims of the current study, occurred during the study period. Data collection began November 11th, 2016, three days after the 2016 presidential election. Differences in voting were seen across educational attainment, age, race and gender. Ninety-five percent of Black women in North Carolina voted for the losing
candidate, Hillary Clinton (CNN Politics, 2016). Eighty-six percent of all Black voters were aged eighteen to thirty. The same age range as approximately ninety-eight percent of this research study’s sample population. This indicates that a substantial number of female participants may have voted for Hilary Clinton. In addition, Election Day polls indicated that seventy-six percent of Black women reported that they were “scared” of a “Trump win”. This was higher than any
other group, with fifty-six percent of Black men,thirty-four percent of White women and twenty-six percent of white males reporting the same fear. Were gender differences between African American males and females inflated by the election results?
52
SAT scores), parental engagement, or college expectations, which may hinder or promote academic experiences.
Future Directions
Group differences in the perceived campus climate, among classification levels (i.e., freshman, sophomore, junior, senior) at the university, could be explored to assess whether chronic threat (years of evaluation, critical feedback and negative stereotypes) strengthens the negative association between stereotype vulnerability and sense of belonging. Do underclassmen (freshmen and sophomores) have lower levels of stereotype vulnerability and higher levels of sense of belonging than upperclassmen (juniors and seniors)? Furthermore, qualitative studies exploring campus climate would provide a richness to the results of this study through obtaining the voices of African American UNC-CH students. Focus groups with African American students may identify themes with regards to concerns about toxic environmental factors, such as, negative peer interactions and perceptions of university statements on diversity. Classroom level stereotype vulnerability studies, could assess the generalizability of laboratory interventions to real world settings. These studies may lead to research assessing scaling up classroom level interventions, to deter Stereotype threat, campus wide.
Conclusion
The strength of this study was its use of sociocultural theory; a framework which
53
relationships among stereotype vulnerability, campus climate and sense of belonging for African American students though the collection of self-report measures. Gender differences were also analyzed for these three constructs. While student perceptions of the variable campus climate was not found to have a proposed moderating role for the relationship between student sense of stereotype vulnerability and sense of belonging, all three variables were found to be associated with each other. Higher levels of student stereotype vulnerability were associated with lower levels of both climate and sense of belonging. In addition, increased perceptions of campus climate were related to perceptions of belonging. These findings are consistent with previous research on stereotype threat and sense of belonging. Female African American students reported higher levels of stereotype vulnerability and lower levels of sense of belonging. This finding may provide insight into research on women and stereotyped domains, as well as theories of dual minority status. Additional research on the intersectionality of race and gender may elucidate mechanisms and protective factors with regards to stereotype vulnerability for African American female students. Multi-level campus and classroom wide interventions that integrate the
constructs of stereotype vulnerability, sense of belonging and campus climate may be beneficial to enhance student perceptions, due to the connections found among these variables. A mixed methods research study, utilizing focus groups with African American students followed by quantitative methods to devise a measure, may provide a transformative approach. In mixed methods research, a transformative design is historically and culturally relevant to the specific population of interest, while capitalizing on the rigor, generalizability replicability of
54
55 Figure III:
Revised Model Conceptual Model
Individual Factors:
Parental SES 1st Generation Status College Preparedness
Gender Race/Ethnicity
Resp
Stereotype Vulnerability
Sense of Belonging Perception of Campus