CHARACTERIZATION OF WATER OXIDATION CATALYSTS FOR IMPLEMENTATION IN A DYE -SENSITIZED PHOTOELECTROSYNTHESIS CELL (DSPEC)
KATHERINE E.MICHAUX
A dissertation submitted to the faculty at the University of North Carolina at Chapel Hill in partial fulfillment of the requirements for the degree of Doctor of Philosophy in the Department
of Chemistry.
Chapel Hill 2015
ii © 2015
iii ABSTRACT
Katherine E. Michaux: CHARACTERIZATION OF WATER OXIDATION CATALYSTS FOR
IMPLEMENTATION IN A DYE-SENSITIZED PHOTOELECTROSYNTHESIS CELL (DSPEC) (Under the direction of Royce W. Murray)
Chapter One is an introduction to solar energy conversion and the Dye-Sensitized Photoelectrosynthesis Cell (DSPEC). It goes into detail about the development of the individual parts of the DSPEC, including the semiconductor electrodes, photosensitizers and catalysts that have been implemented in similar devices. It then gives a brief history of the use of iridium oxide nanoparticles as water oxidation catalysts.
Chapter Two describes the film formation process for iridium oxide nanoparticles, focusing particularly on the electroflocculation technique. Studies were performed which determined the mechanism of electroflocculation, focusing on the short electroflocculation time periods. Three different electroflocculation methods – constant potential, potential pulsing and potential cycling – were implemented and the resulting iridium oxide nanoparticle films were compared electrochemically and microscopically. Electroflocculation was also compared to chemical flocculation and a direct pH change method of film formation.
iv
electroflocculated nanoparticles demonstrates the increase in crystallinity via electroflocculation. SEM demonstrates the morphology of the electroflocculated films. Change in surface charge of the iridium oxide nanoparticles with respect to pH is depicted with zeta potential measurements. Finally, XPS of various forms of the iridium oxide nanoparticles shows the different forms of iridium within the nanoparticles, likely distinguished by surface and core iridium sites.
Chapter Four details the behavior of iridium oxide nanoparticles in organic media through a few different methods. First, the behavior of an electroflocculated iridium oxide nanoparticle film is examined in an aprotic solvent, as well as the changes in the electrochemical behavior when a proton source is added. A hot injection thermal degradation synthesis of iridium oxide nanoparticles is also explored. Exchange into organic media via valeric acid capping ligands is discussed. This leads to the ferrocenation of the iridium oxide nanoparticles using a Click reaction with a phosphate terminated ligand. Electrochemical tagging of the iridium oxide nanoparticles elaborates on the surface chemistry and diffusion coefficient in aprotic media.
Chapter Five explores a dip-coated layer-by-layer synthesis of a chromophore-catalyst photoanode assembly consisting of a Ru(II) polypyridal dye and iridium oxide nanoparticle catalyst. Preparation of Ru(II) polypyridyl-iridium oxide nanoparticle (IrOx NP)
chromophore-catalyst assemblies on a FTO|nanoITO|TiO2 core/shell by a layer-by-layer procedure is described
for application in Dye Sensitized Photoelectrosynthesis Cells (DSPEC). Significantly enhanced, bias-dependent photocurrents with Lumencor 455 nm 14.5 mW/cm2 irradiation are observed for core/shell structures compared to TiO2 after derivatization with [Ru(4,4’-PO3H2bpy)2(bpy)]2+
(RuP2) and uncapped IrOX NPs at pH 1 and pH 5.8 in HClO4 and NaSiF6 buffers, respectively,
v
FTO|nanoITO|TiO2|-RuP2,IrO2, are dependent on TiO2 shell thickness and applied bias, reaching
0.2 mA/cm2 at 0.5 V vs AgCl/Ag with a shell thickness of 6.6 nm. Long term photolysis in the
NaSiF6 buffer results in a marked decrease in photocurrent over time due to surface hydrolysis
and loss of the chromophore from the surface. Long term stability, with sustained photocurrents, has been obtained by Atomic Layer Deposition (ALD) of overlayers of TiO2 to stabilize surface
binding of -RuP2 prior to the addition of the IrOX NPs.
Chapter Six focuses on the electrochemical characterization of three novel Ru(II) quaterpyridine complexes and the assessment of their potential for benzyl alcohol oxidation catalysis. The terminal ligands for these complexes are varied between CH3CN, Cl and vinyl
pyridine. Their electrochemical behavior in acetonitrile and aqueous media are reported. When dissolved in aqueous media, an exchange of the CH3CN ligands with H2O allows the complexes
vi
vii
ACKNOWLEDGEMENTS
First and foremost, I would like to thank my adviser Prof. Royce Murray. You have been a wonderful mentor as both a scientist and a human being. I cannot express how grateful I am that you decided to take me on as a graduate student. Thank you for sticking around until I finished this and allowing me to be a part of “the incredible shrinking lab.” I have very much appreciated having you in my corner for the past five years and I’m so thankful that you’re not a 500 lb gorilla like uncompensated resistance.
Thank you to all of the former Murray laboratory members with whom I’ve had the pleasure of meeting and interacting. It’s a brilliant group of scientists that I’m excited to join the ranks of. I would especially like to thank Alessa Gambardella and Joe Roberts, the two people whom I’ve spent the most time with over the course of graduate school. Alessa – I appreciate you teaching me the ropes of both graduate school and iridium oxide nanoparticles. In a way, I see this thesis as a continuation of yours and I hope I was able to bring your astute analytical skills into this research. Our coffee walks, despite me not drinking coffee, were always a
highlight of my afternoons. Joe – You were the best labmate a person could hope for. You kept me sane for four years with our daily morning talks – not an easy feat in the least. I also
appreciate your efforts in keeping the numbers up in the lab with your army of undergraduates. I can’t wait to hear about your new army and your upcoming teaching position.
viii
achievement of my graduate school career. I hope graduate school doesn’t break you and that you’re able to mentor a student who is even half as brilliant as you are.
To all of the scientists I’ve had the opportunity to collaborate with through the Energy Frontier Research Center for Solar Fuels at UNC – thank you. You have my deepest gratitude. This includes, but probably isn’t limited to, Paul Giokas, Dennis Ashford, Rob Binstead, Leila Alibabei, Ben Sherman, Kyle Brennaman and Alex Lapides. These experiences have prepared me for my career in ways you can’t imagine.
To all of my friends, both from home and here at UNC – I would never had made it through these past five years without you. I would especially like to thank James Treadway, Will Black, Katie Moga and Jenna Ogden. James – Our late night study sessions with Moga are what got me through our first year of grad school. For that and your incredibly patience, I will be forever grateful. Will – You have been a wonderful friend. I will always cherish our bourbon drinking and Derby parties and I can’t wait to trash talk you in 2020 when VT beats Michigan. Moga – I don’t know what I would’ve have done in graduate school without my other Katie. I’m sure I would’ve given up long ago. After all, we do come in pairs. I hope, one day, we’re able to finish Covert Affairs. JMO – While there have been over 700 miles between us, I am so thankful for all of the time we’ve been lucky enough to spend together. You are my best friend and your support has meant the world to me. You have been the one person who was never afraid to tell me the truth, even when I was about to run my car into a bush. I excitedly await for the day when we finally live in the same city again.
ix
taking my phone calls, even if I do call you excessively. Grandma, Papa S. and Papa M. – You are all wonderful inspirations in everything you do. I love every visit that I get with you and look forward to visiting more often once I’m done with school. Thank you for being the best role models a person could ask for, both personally and professionally. Woody – You are an inspiration. Your hard work in everything you do has been my motivation to finish this thing. As I said in the dedication, I look forward to reading your dissertation one day, even if it is in physics. Sidney – Thank you for sending me daily pictures of cats. I hope it’s not too sad to say that they’re the highlight of my day. I am so proud of you. You’re going to make a wonderful physical therapist. Last, but certainly not least, Chip – You are a hoot. Thank you for
FaceTiming me any time you find your way to an iPad. I love our conversations about science and I hope that you keep your natural curiosity through the rest of your life.
To my fiancé Brendan – I don’t even know if I can put into words how much your
support has meant to me. It has been so wonderful to have you as my friend and partner over the past five years. You were the one who had to listen to all of my self-doubt and every time I thought I should give up. Each and every time you told me exactly what I needed to hear,
whether or not I wanted to hear it at the time. It has been an incredible experience going through this journey with you. I am so excited to see where the next step takes us. Maybe one day, we’ll even get married.
x
TABLE OF CONTENTS
LIST OF FIGURES………....xv
LIST OF TABLES .………xxvi
LIST OF SCHEMES……….…….xxviii
LIST OF ABBREVIATIONS AND SYMBOLS………..xxix
CHAPTER 1:Introduction to the Dye-Sensitized Photoelectrosynthesis Cell (DSPEC) ... 1
1.1 Solar Energy as a Renewable Source ... 1
1.2 The Dye-Sensitized Photoelectrosynthesis Cell (DSPEC) ... 7
1.3 The Photoanode ... 8
1.4 Catalysts for Water Oxidation ... 11
1.4.1 Homogeneous Catalysts ... 12
1.4.2 Metal Oxide Heterogeneous Catalysts ... 14
1.5 Iridium Oxide Nanoparticles ... 16
1.6 References ... 21
CHAPTER 2:Film formation of Iridium Oxide Nanoparticles ... 29
2.1 Introduction ... 29
2.2 Experimental ... 31
2.2.1 Electrochemical Experimental Setup ... 31
2.2.2 Iridium Oxide Nanoparticle Synthesis ... 31
2.2.3 Electroflocculation of Iridium Oxide Nanoparticles ... 31
2.2.3.1 Electroflocculation via Constant Potential ... 32
xi
2.2.3.3 Electroflocculation via Potential Cycling ... 33
2.2.4 Microscopy of the IrOX NP Films ... 33
2.2.5 Chemical Flocculation of Iridium Oxide Nanoparticles ... 33
2.2.6 Direct pH Change for Iridium Oxide Nanoparticle Precipitation ... 34
2.3 Results and Discussion ... 34
2.3.1 Electroflocculation of Iridium Oxide Nanoparticles via Constant Potential ... 34
2.3.1.1 Electroflocculation with Rotation of Electrode ... 36
2.3.1.2 Electroflocculation at Varying pH ... 37
2.3.1.3 eQCM Monitoring of Electroflocculation ... 38
2.3.1.4 Microscopy of IrOx NP Films at Early Electroflocculation Times ... 39
2.3.2 Different Methods of Electrofloccuation ... 41
2.3.2.1 Constant Potential ... 41
2.3.2.2 Pulsing the Potential ... 44
2.3.2.3 Cycling the Potential ... 48
2.3.2.4 Comparison of Various Electroflocculation Methods ... 52
2.3.3 Chemical Flocculation of Iridium Oxide Nanoparticles ... 57
2.3.4 Direct pH Change for Iridium Oxide Nanoparticle Precipitation ... 59
2.4 Conclusions ... 60
2.5 Acknowledgement ... 60
2.6 References ... 62
CHAPTER 3:Characterization of Iridium Oxide Nanoparticles ... 63
3.1 Introduction ... 63
3.2 Experimental ... 66
3.2.1 Aqueous Hydrolysis of IrOX NPs ... 66
xii
3.2.3 Precipitation of Iridium Oxide Nanoparticles ... 66
3.2.4 Electrochemistry of Iridium Oxide Nanoparticles ... 67
3.2.5 UV-Vis Spectroelectrochemistry of Iridium Oxide Nanoparticles ... 67
3.2.6 Raman Spectroscopy of Iridium Oxide Nanoparticles ... 68
3.2.7 Microscopy of Iridium Oxide Nanoparticle Films... 68
3.2.8 Zeta Potential Measurements of Iridium Oxide Nanoparticles ... 68
3.2.9 X-Ray Photoelectron Spectroscopy of Iridium Oxide Nanoparticles ... 68
3.3 Results and Discussion ... 69
3.3.1 Electrochemistry of Iridium Oxide Nanoparticles ... 69
3.3.1.1 Electrochemical Behavior of IrOX NP Films at Different pH ... 69
3.3.1.2 Kinetic Studies of Water Oxidation Catalysis vis IrOX NP Films ... 72
3.3.1.3 Catalytic Tafel Plots ... 76
3.3.2 UV-Vis Spectroelectrochemistry of Iridium Oxide Nanoparticles ... 79
3.3.3 Zeta Potential Measurements of Iridium Oxide Nanoparticles ... 81
3.3.4 Raman Spectroscopy of Iridium Oxide Nanoparticles ... 85
3.3.5 Microscopy of Iridium Oxide Nanoparticles ... 90
3.3.6 X-ray Photoelectron Spectroscopy of Iridium Oxide Nanoparticles ... 93
3.4 Conclusions ... 97
3.5 Acknowledgments... 98
3.6 References ... 99
CHAPTER 4:Iridium Oxide Nanoparticles in Organic Media ... 102
4.1 Introduction ... 102
4.1.1 Electrochemistry of Iridium Oxide Nanoparticles ... 102
xiii
4.1.3 Ligand Modification of Metal Oxide Nanoparticles in Organic
Media ... 104
4.2 Experimental ... 106
4.2.1 Aqueous Hydrolysis of IrOX NPs ... 106
4.2.2 Electroflocculation of IrOX NP Films ... 106
4.2.3 Non-Aqueous Electrochemistry of Iridium Oxide Nanoparticle Films ... 106
4.2.4 Addition of Carboxylic Acids and Carboxylates ... 107
4.2.5 Hot Injection Thermal Degradation Synthesis of IrOX NPs ... 107
4.2.6 Valeric Acid Exchange of IrOX NPs to Organic Media ... 108
4.2.7 Ferrocenation of IrOX NPs ... 108
4.2.8 Instrumentation ... 110
4.2.8.1 High Resolution Transmission Electron Microscopy (TEM) ... 110
4.2.8.2 Energy-Dispersive X-Ray Spectroscopy (EDS) ... 110
4.2.8.3 Centrifugation ... 110
4.2.8.4 X-Ray Photoelectron Spectroscopy (XPS) ... 111
4.2.8.5 Electrochemsitry ... 111
4.3 Results and Discussion ... 111
4.3.1 Electrochemistry of Iridium Oxide Nanoparticle Film in Non- Aqueous Media ... 111
4.3.2 Addition of Carboxylic Acids and Carboxylates to Organic Media ... 114
4.3.3 High Boiling Point Solvent Synthesis of Iridium Oxide Nanoparticles ... 116
4.3.4 Ferrocenation of Iridium Oxide Nanoparticles ... 120
4.4 Conclusions ... 126
xiv
4.6 References ... 128
CHAPTER 5:Chromophore Catalyst Assemblies of RuP2 and Iridium oxide nanoparticles ... 130
5.1 Introduction ... 130
5.2 Experimental ... 132
5.2.1 Materials ... 132
5.2.2 Synthesis of IrOX NPs ... 132
5.2.3 Assembly of RuP2-IrOX NP systems ... 132
5.2.4 Fabrication of nanoITO-FTO substrates:... 132
5.2.5 ALD deposition ... 133
5.2.6 Spectroelectrochemical Characterization ... 134
5.2.7 Photolysis Measurements... 134
5.2.8 O2 Detection ... 134
5.3 Results and Discussion ... 135
5.3.1 Dip-Coating Layer-by-Layer Synthesis of RuP2 and IrOX NP Assemblies ... 135
5.3.2 UV-Vis Spectroelectrochemistry of RuP2 and Iridium Oxide Nanoparticles on nanoITO ... 136
5.3.3 Photolysis of RuP2 and Iridium Oxide Nanoparticle Assemblies at pH 1 ... 138
5.3.4 Photolysis of RuP2 and Iridium Oxide Nanoparticle Assemblies at pH 5.8 ... 141
5.3.5 Atomic Layer Deposition of TiO2 as Stabilization Technique ... 146
5.4 Conclusions ... 149
5.5 Acknowledgement ... 150
5.6 References ... 151
xv
6.1 Introduction ... 153
6.1.1 Molecular Water Oxidation Catalysts ... 153
6.1.2 Benzyl Alcohol Oxidation Catalysis ... 154
6.2 Experimental ... 157
6.2.1 Synthesis of the ruthenium quaterpyridine ligand and [Ru(qpy)2(Cl)2] complex ... 157
6.2.2 Synthesis of Complex 1 ... 157
6.2.3 Synthesis of Complex 2 ... 157
6.2.4 Synthesis of Complex 3 ... 158
6.2.5 Electrochemical experimental setup ... 158
6.2.6 Detection of benzyl alcohol and benzaldehyde via Gas Chromatography ... 159
6.3 Results and Discussion ... 159
6.3.1 Electrochemistry of Ru(qpy)L2 in Acetonitrile ... 159
6.3.2 Electrochemistry of Ru(qpy)L2 in Aqueous Media ... 161
6.3.3 Addition of Benzyl Alcohol to Aqueous Ru(qpy)L2 Solutions ... 163
6.3.4 Bulk Electrolysis of Ru(qpy)(CH3CN)(Cl) with Benzyl Alcohol ... 167
6.4 Conclusion ... 169
6.5 Acknowledgement ... 170
xvi
LIST OF FIGURES
Figure 1.1: Annual global energy demand by decade since 1990, as well as the predicted increase over the next 35 years. ... 2 Figure 1.2: Band gaps of common semiconductor materials. The negative
limit on the left corresponds to the conduction band energy and the positive limit on the right corresponds to the valence band energy. The dotted lines represented the potentials required for water oxidation and proton reduction. ... 4 Figure 1.3: Schematic of the Dye-Sensitized Photoelectrosynthesis Cell, where
sunlight is used to oxidize water and use the resulting protons to reduce CO2 to CH4. ... 7
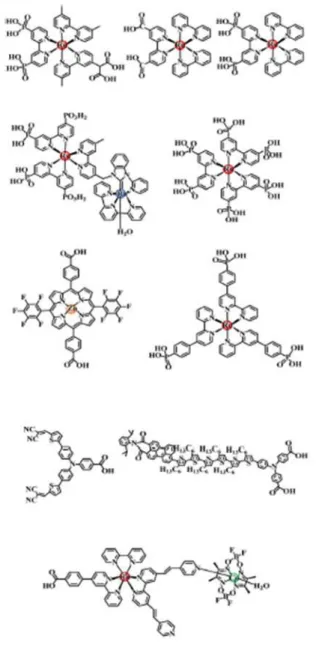
Figure 1.4: Examples of the structures of commonly used chromophores for DSSC and DSPEC devices. ... 10 Figure 1.5: Examples of more recent molecular complexes that have served as
water oxidation catalyssts. ... 13 Figure 1.6: “Volcano plot”, developed by S. Trasatti, relating the metal-oxygen
bond strength of each material to the overpotential required for water oxidation catalysis. ... 15 Figure 2.1: Cyclic voltammetry of an electroflocculated IrOX NP film, depicting
the IrV/IV and IrIV/III redox waves and the onset of water oxidation in 0.1 M NaOH solution (pH = 13). Electrode area 0.071 cm2. ... 34 Figure 2.2: Cyclic voltammetry of an electroflocculated IrOX NP film, depicting
the IrIV/V redox wave and water oxidation catalysis region in 0.1 M NaOH solution (pH = 13). Electrode area 0.071 cm2. ... 35 Figure 2.3: Cyclic voltammetry in 0.1 M NaOH of the GC disk (a) and Pt
ring (b) after electroflocculation of pH 13 IrOX NPs while rotating
at 500 rpm. ... 36 Figure 2.4: Cyclic voltammetry after the electrofloccultion onto Au coated
slides of different pH IrOX NPs. CVs were performed in pH 1
xvii
Figure 2.5: Electroflocculation of IrOX NPs ([Ir] = 2.5 mM, pH 13) at 0.9 V
vs. Ag/AgCl onto a Au coated quartz crystal, as monitored by eQCM. The measured current is the blue line; green corresponds to the change in mass obtained from the change in frequency of the quartz crystal. The black arrow indicates the end of the observed induction period. 1 μg increase in mass corresponds to roughly 1.67 × 10⁻¹⁰ mol IrOX NPs/cm2. ... 38
Figure 2.6: AFM (left) and SEM (right) images of electroflocculated IrOX NP
films depicting the “islands” of NPs that form initially on the 0.209 cm2 electrode surface. Both samples were electroflocculated onto a Au coated glass slide for 5 minutes. ... 39 Figure 2.7: AFM of Au coated glass slides after varying times of electro-
flocculation in pH 13 IrOX NPs. Very little change in surface
roughness (seen by the RMS) and topography is seen in the first 120 s of electroflocculation. ... 40 Figure 2.8: AFM images of Au coated glass slides subjected to 0 s (left) and
180 s (right) of electroflocculation. After 180 s, patches of IrOX
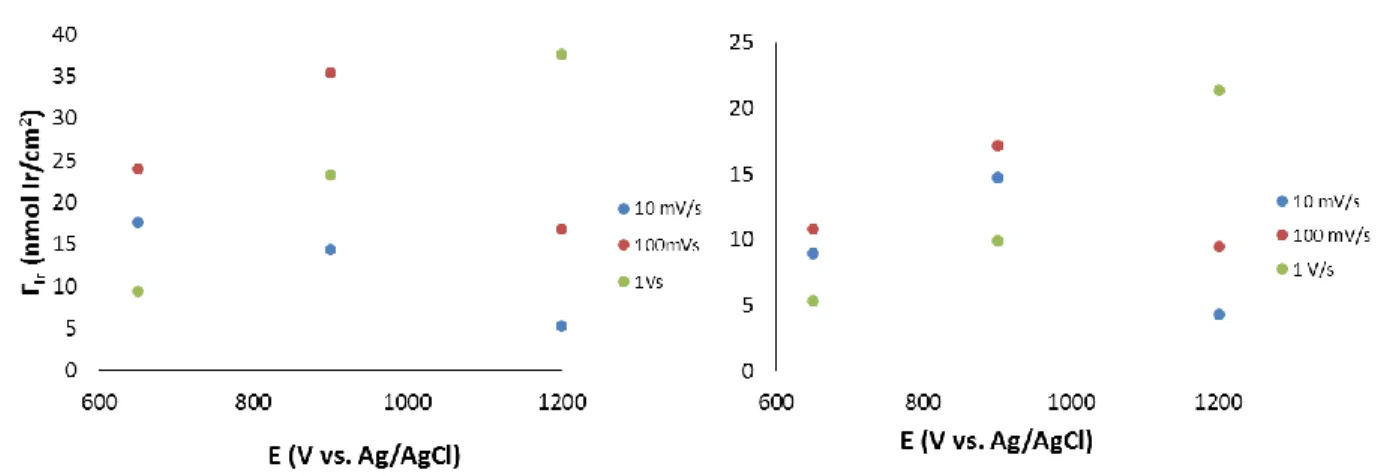
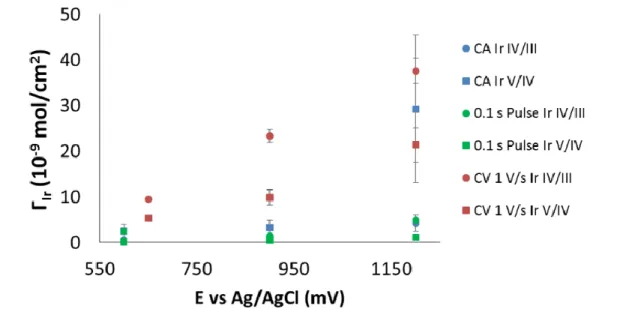
NPs are visible, as indicated by the blue squares. ... 41 Figure 2.9: Coverage of Ir (ΓIr) after electroflocculation at different potentials,
using the chronoamperometry method. The coverages calculated from the IrIV/III couple is represented in blue and the coverages calculated from the IrV/IV couple are in red. ... 42 Figure 2.10: Coverage of iridium (ΓIr) for the IrV/IV (red) and IrIV/III (blue)
waves with respect to length of electroflocculation in min at 1.2 V vs. Ag/AgCl. ... 43 Figure 2.11: Cyclic voltammetry of the IrOX NP films formed via potential
pulsing. The lower potential limit was 0 V vs. Ag/AgCl and the upper potential limit was varied between 1.2 V (green), 0.9 V (red) and 0.6 V (blue). The different pulse lengths were 0.1, 0.2 and 0.5 s at the upper potential limit. CVs were performed in fresh 0.1 M NaOH solution and the CVs shown above are at ν = 50 mV/s. ... 45 Figure 2.12: Coverage of iridium (ΓIr) with respect to the upper potential limit.
Coverage for the IrIV/III- couple is on the left and that for the IrV/IV
xviii
Figure 2.13: Coverages of iridium (ΓIr) for the IrIV/III (left) and IrV/IV (right)
couples with a lower potential limit of 0.2 V vs. Ag/AgCl. The upper potential limit is shown on the x-axis and the different pulse lengths are in different colors, 0.5 s in red, 0.2 s in green and 0.1 s in purple. ... 47 Figure 2.14: Coverages of iridium (ΓIr) for the IrIV/III (left) and the IrV/IV couples
formed via potential pulsing with a lower potential limit of 0.6 V vs. Ag/AgCl. The upper potential limit is represented along the x-axis and the pulse length is represented by different colors, 0.5 s as blue, 0.2 s as red and 0.1 s as green. ... 48 Figure 2.15: Cyclic voltammetry of three different films formed via potential
cycling and different scan rates: 10 mV/s in blue, 100 mV/s in red and 1 V/s in green. Each CV was taken in a new 0.1 M NaOH solution at 50 mV/s. ... 49 Figure 2.16: Coverages of iridium (ΓIr) from film formed via potential cycling
with a lower potential limit of 0 V vs. Ag/AgCl for the IrIV/III (left)
and IrV/IV (right) couples. The upper potential limit is represented along the x-axis and the scan rates are represented by different colors, 10 mV/s in blue, 100 mV/s in red and 1 V/s in green. ... 50 Figure 2.17: Coverages of iridium (ΓIr) from film formed via potential cycling
with a lower potential limit of 0.6 V vs. Ag/AgCl for the IrIV/III (left) and IrV/IV (right) couples. The upper potential limit is represented along the x-axis and the scan rates are represented by different colors, 10 mV/s in blue, 100 mV/s in red and 1 V/s in green. ... 51 Figure 2.18: Coverages of iridium (ΓIr) from film formed via potential cycling
with a lower potential limit of 0.4 V vs. Ag/AgCl for the IrIV/III (left) and IrV/IV (right) couples. The upper potential limit is represented along the x-axis and the scan rates are represented by different colors, 10 mV/s in blue, 100 mV/s in red and 1 V/s in green. ... 51 Figure 2.19: Cyclic voltammetry of films formed via different methods
xix
Figure 2.20: Coverages of iridium (ΓIr) for films formed via different
electroflocculation methods, depicted in the legend on the right. The IrIV/III values are represented by circles, while the IrV/IV values
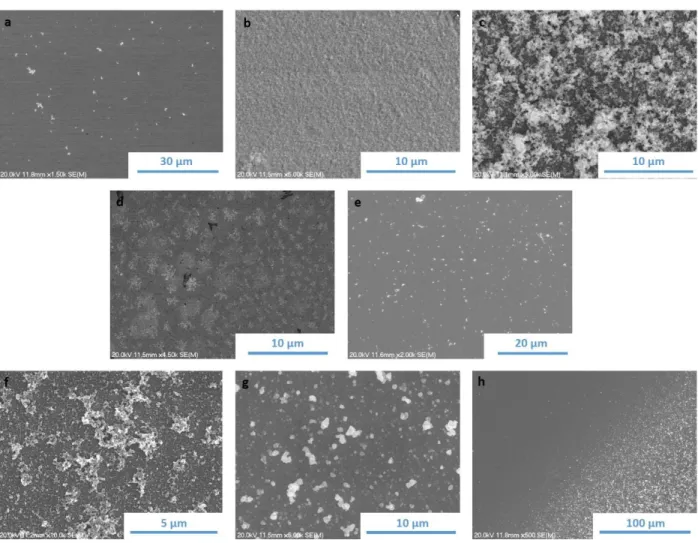
are squares. The blue data points denote values obtained from a film formed via constant potetial, while the green data points are from films flocculated by potential pulsing and the red from potential cycling. The lower potential limit is 0 V vs. Ag/AgCl for all films. ... 53 Figure 2.21: SEM images of electroflocculated IrOX NP films formed via
different electroflocculation methods.. (a) Constant potential with applied potential of 0.6 V. (b) Constant potential with applied potential of 0.9 V. (c) Constant potential with applied potential of 1.2 V. (d) Potential pulsing, 0.5 s pulse, upper potential limit of 0.9 V and lower potential limit of 0.6 V. (e) Potential pulsing, 0.5 s pulse, upper potential limit of 0.9 V and lower potential limit of 0 V. (f) Potential cycling, 10 mV/s scan rate, upper potential limit of 0.9 V and lower potential limit of 0 V. (g) Potential cycling, 100 mV/s scan rate, upper potential limit of 0.9 V and lower potential limit of 0 V. (h) Potential cycling, 1 V/s scan rate, upper potential limit of 0.9 V and lower potential limit of 0 V. All potentials are versus a Ag/AgCl reference electrode. ... 56 Figure 2.22: IrOX NP solution as-synthesized as pH 13 (left) and after the
addition of CAN (right). The solution changes from a clear, purple solution to a colorless solution with a brown precipitate. ... 57 Figure 2.23: XPS of the precipitate formed via “chemical flocculation” of the
IrOX NPs with Ce(IV). The precipitate was drop-cast onto a Au
coated glass slide. ... 58 Figure 3.1: Cyclic voltammetry of an electroflocculated IrOX NP film, depicting
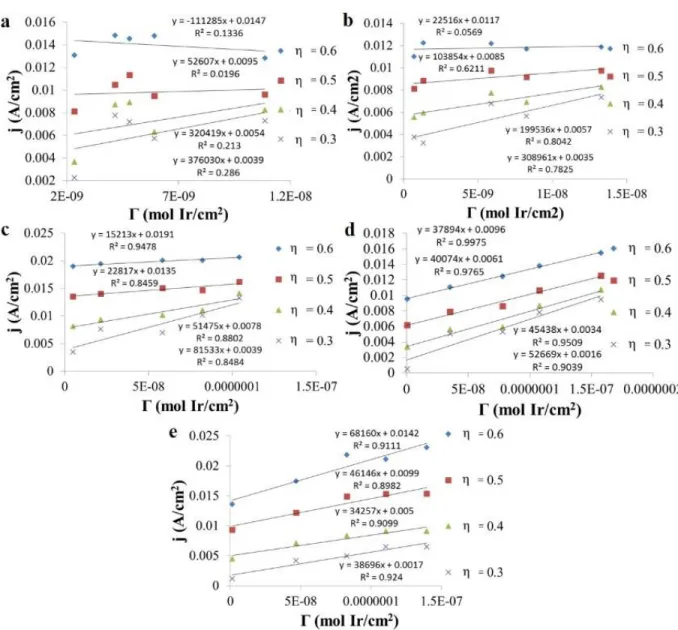
the IrV/IV and IrIV/III redox waves and the onset of water oxidation in 0.1 M NaOH solution (pH = 13). Electrode area 0.071 cm2. ... 69 Figure 3.2: j (A/cm2) vs. Γ
Ir (mol Ir/cm2) for four different overpotentials (η),
indicated by the different symbols in each graph. a) Plot for IrOX
NP films in pH 3 phosphate buffer. b) Plot for IrOX NP films in pH
5 phosphate buffer. c) Plot for IrOX NP films in pH 7.5 phosphate
buffer. d) Plot for IrOX NP films in pH 10 phosphate buffer. e) Plot
for IrOX NP films in pH 12 phosphate buffer... 74
Figure 3.3: Distribution plot of the different phosphate species with respect to pH. The kcat values for the 5 different buffers are plotted, as well,
xx
Figure 3.4: Catalytic Tafel plots for IrOX NP films, electroflocculated for
various lengths of time (indicated by the different colors) in different pH buffers. a) IrOX NP films in pH 3 phosphate buffer.
b) IrOX NP films in pH 5 phosphate buffer. c) IrOX NP films in pH
7.5 phosphate buffer. d) IrOX NP films in pH 10 phosphate buffer.
e) IrOX NP films in pH 12 phosphate buffer. ... 77
Figure 3.5: Catalytic Tafel plot of similar coverage IrOX NP films in different
pH phosphate buffers, represented by the different colors. The slope corresponds to the kcat and mechanism of catalysis, while the
y-intercept corresponds to the exchange current density. ... 78 Figure 3.6: UV-Vis difference spectra for the precipitated IrOX NP films on
a nanoITO buffer in pH 5.8 NaSiF6 buffer. The potential was
varied in 20 mV increments from -0.2 to 1.4 V vs. Ag/AgCl and was held for 60 s before each absorbance spectra was obtained. ... 80 Figure 3.7: a) Distribution plot of each Ir oxidation state with respect to applied
potential (V vs. Ag/AgCl), derived from the difference spectra in Figure 3.6. b) The difference spectra of each individual Ir oxidation state. ... 81 Figure 3.8: TEM images of the isopropanol precipitated IrOX resupsended in
various 0.1 M phosphate buffer:. a) pH 3.3 b) pH 7.7 d) pH 11 e) pH 12. ... 82 Figure 3.9: Zeta potential distributions for the isopropanol precipitated IrOX
NPs, resuspened in various phosphate buffers: a) pH 2 b) pH 3.3 c) pH 5.8 d) pH 7.7 e) pH 11 and f) pH 12. ... 83 Figure 3.10: Raman spectra of the IrOX NPs in two different states. a) As-
synthesized IrOX NPs in 0.1 M NaOH. b) Electroflocculated IrOX
NP film on Au slide. ... 84 Figure 3.11: Before (blue) and after (orange) Raman spectra of the same electro-
flocculated IrOX NP film, which presents a decrease in crystallinity
over time. ... 85 Figure 3.12: a) Raman spectra of an electroflocculated IrOX NP film over time
xxi
Figure 3.14: SEM images at 30 and 35x magnification of electroflocculated IrOX NP films after exposure to various phosphate buffers and
electrochemical experiments. a) Immediately after electroflocculation, no phosphate buffer. b) After pH 12 phosphate buffer. c) After pH 10 phosphate buffer. d) After pH 7.5 phosphate buffer. e) After pH 5
phosophate buffer. f) After pH 3 phosphate buffer. ... 88 Figure 3.15: SEM images at 80,000 and 90,000x magnification of electro-
flocculated IrOX NP films after exposure to various phosphate
buffers and electrochemical experiments. a) Immediately after
electroflocculation, no phosphate buffer. b) After pH 12 phosphate buffer. c) After pH 10 phosphate buffer. d) After pH 7.5 phosphate buffer. e) After pH 5 phosophate buffer. f) After pH 3 phosphate buffer. ... 89 Figure 3.16: Electroflocculated IrOX NP films after varying lengths of time. a)
3 minutes of electroflocculation. b) 5 minutes of electroflocculation. c) 12 minutes of electroflocculation. d) 15 minutes of electroflocculation. ... 90 Figure 3.17: Cross-section SEM images of an electroflocculated IrOX NP film
on a Au coated glass slide. a) 600x magnification. b) 35,000x
magnification. ... 91 Figure 3.18: High resolution x-ray photoelectron spectra focused on the Ir 4f
peak of IrOX NPs in four different states. a) As-synthesized IrOX
NPs in 0.1 M NaOH (pH 13). b) Electroflocculated IrOX NP film
on a Au coated glass slide. c) Valeric acid capped IrOX NPs in DCM.
d) Chemically flocculated IrOX NPs, precipitated via (NH4)2Ce(NO3)6. ... 92
Figure 3.19: X-ray photoelectron spectra of an electroflocculated film before (red) and after (blue) holding the potential at -300 mV vs. Ag/AgCl. ... 96 Figure 4.11: pH dependency of the formal potentials of IrV/IV and IrIV/III for the
freely diffusing IrOX NPs (blue) and the electroflocculated IrOX
NP films (black) in various phosphate buffers. ... 103 Figure 4.2: Cyclic voltammetry of an electroflocculated IrOX NP film in
DMSO with 0.1 M TBAP. Three different scan rates are
xxii
Figure 4.3: a) Cyclic voltammetry of an electroflocculated IrOX NP film
in DMSO with additions of nanopure H2O. b) Cyclic voltammetry
of an electroflocculated IrOX NP film in DMSO with additions of
0.1 M NaOH in nanopure H2O. c) Final CV of an electroflocculated
IrOX NP film in 50% DMSO, 50% H2O. d) Final CV of an electro-
flocculated IrOX NP film in 50% DMSO, 50% 0.1 M NaOH. Scan
rate is 10 mV/s for all figures. Black arrows indicated the direction in which the Ir redox waves are shifting. ... 112 Figure 4.4: Cyclic voltammetry of various carboxylates in CH3CN and 0.1 M
TBAP. Various scan rates are shown, 200 mV/s in blue, 300 mV/s in orange and 400 mV/s in purple. a) 4 mmol tetrabutylammonium hexanoate with a GC working electrode. b) 4 mmol tetrabutyl- ammonium hexanoate with an electroflocculated IrOX NP film. c) 4
mmol tetratbutylammonium valerate with a GC working electrode. d) 4 mmol tetrabutylammonium valerate with an electro-
flocculated IrOX NP film. ... 113
Figure 4.5: Differential pulse voltammetry of an electroflocculated IrOx NP
film in 0.1 TBAP, 10 mM hexanoic acid CH3CN. 10 µL increments
of 0.1 TBAOH were added to the solution and a negative shift of the redox couple is observed with each addition. ... 115 Figure 4.6: Shift of the peak potential via differential pulse voltammetry with
the addition of 0.1 M TBAOH. a) Titrations of 10 mM hexanoic acid and 5 mM valeric acid. b) Titration of 20 mM oxalic acid. ... 116 Figure 4.7: TEM images (a and b) and histogram (c) of the IrOX NPs
sytnthesized via the hot injection thermal degradation synthesis. ... 117 Figure 4.9: XPS of the hot injection, thermal degradation synthesis IrOX NPs.
a) Full spectrum demonstrates a large C s1 peak at 300 eV due to the surfactant shell. b) High resolution spectrum of the Ir 4f double peak. ... 118 Figure 4.9: EDS spectrum of the hot injection, thermal degradation synthesis
IrOX NPs, demonstrating the presences of Ir in the NPs seen in the
TEM images of Figure 4.6. ... 118 Figure 4.10: TEM images (a and b) of the valeric acid capped nanoparticles,
as well as a histogram (c) of the nanoparticle diameter in nm. ... 119 Figure 4.11: TEM images (a and b) of the N3IrOX NPs and a histogram of the
xxiii
Figure 4.12: a) Full XPS spectrum of the N3IrOX NPs. b) High resolution scan
of the Ir 4f double peak. c) High resolution scan of the N 1s peak. A double peak at 399.5 and 406 eV indicates the presences of an N3
species. ... 121 Figure 4.13: TEM images (a and b) of the FcIrOX NPs, as well as a histogram
(c) of the nanoparticle diameters. ... 122 Figure 4.14: EDS of the FcIrOX NPs pictured in Figure 4.12, demonstrating the
presence of both Ir and Fe. ... 123 Figure 4.15: a) Full x-ray photoelectron spectrum of FcIrOX NPs. b) High
resolution scan of the Fe 2p peak. c) High resolution scan of the N s1 peak. ... 123 Figure 4.16: a) Cyclic voltammetry of the FcIrOX NPs in 0.1 M TBAP DMSO
using a Au coated glass slide as a working electrode. b) Cyclic
voltammetry of the FcIrOX NPs in 0.1 M TBAP DMSO using a
Au microdisk working electrode. c) Peak current (ip) vs. the square
root of scan rate (ν1/2) from the CVs presented in (a). ... 124
Figure 5.1: Diagram of the dipcoated layer-by-layer assembly of RuP2 and
IrOx NPs on various electrodes. A) Assembly is seen on the
mesoporous TiO2 substrate atop FTO coated glass. B) Assembly is
built upon the core/shell electrode with a nanoITO core coated with a thin TiO2 shell, deposited via atomic layer deposition. ... 131
Figure 5.2: TEM images of A) the 50 cycles nanoITO/TiO2 core/shell
electrode and B) the 100 cycles nanoITO/TiO2 electrode. The
darker core represents the nanoITO coke and the surrounding layer is the TiO2 shell, further pointed out by the bar lines. ... 133
Figure 5.3: (a) UV-Vis absorbance spectrum of RuP2-IrOX NP assembly on
a nanoITO electrode. (b) UV-Vis difference spectra of RuP2 – IrOX
NP assembly on nanoITO in a pH 5.8 NaSiF6 buffer, as the applied
potential is varied (bottom to top) from -0.2 V to 1.2 V vs. Ag/AgCl. Two features are observed: A) increase in absorbance due to oxidation of Ir from IrIII to IrVI where it becomes a black absorber and B) photobleaching of RuP2 as it is oxidized from RuII to RuIII. ... 135
Figure 5.4: UV-Vis difference spectra of RuP2 on nanoITO/FTO coated glass with varying potential in a pH 5.8 NaSiF6 buffer, as the applied
potential is varied (bottom to top) from -0.2 V to 1.2 V vs. Ag/AgCl.
xxiv
Figure 5.5: (Top): Concentration gradients of each redox species present from -0.2 to 1.4 V vs. Ag/AgCl at pH 5.8. (Bottom): Individual difference spectra of each oxidation species. The first four changes in spectra correspond to different oxidation states of Ir. The last change corresponds to the oxidation of the RuP2. ... 137
Figure 5.6: Photolysis of the chromophore (RuP2), catalyst (IrOX), and
chromophore-catalyst assembly (RuP2,IrOX) on three difference
electrode types: (a) FTO|nanoITO, (b) FTO|TiO2 and
(c) FTO|nanoITO|TiO2. In each chart, the traces for RuP2 alone is
in blue, IrOx alone is in orange and the assembly of the two is in
purple. Three different light intensities. 10%, 50% and 100% correspond to 3.4, 14.5 and 23.1 mW/cm2 at 455 nm, respectively. A potential bias of 0 V vs. Ag/AgCl was applied. ... 140 Figure 5.7: Photocurrent density of the RuP2-IrOX NP assemblies on a
FTO|nanoITO|TiO2 core/shell electrodes at pH 1 with varied
applied potential bias. These values are taken after 90 s of photolysis when illuminated by the Lumencor at 455 nm and 14.5 mW/cm2. (The photocurrent density is based on the geometric area of the electrode.) ... 141 Figure 5.8: Photocurrent measurements of the RuP2-IrOX assembly, as well
as the individual components. Photocurrents on a TiO2 mesoporous
electrode are featured on the left in (a) and photocurrents on a 100 cycle nanoITO/TiO2 core/shell electrode are on the right in (b).
Three different light intensities. 10%, 50% and 100% correspond to 3.4, 14.5 and 23.1 mW/cm2 at 455 nm, respectively. A potential bias of 0 V vs. Ag/AgCl was applied. ... 142 Figure 5.9: O2 detection using a four electrode set up. On the left, the black
trace is WE1 with the RuP-IrOx assembly and the red trace is the
O2 detection at WE2. The figure on the right is the same O2
detection from the figure on the left. There is a time delay between when the light is switched on and when O2 is detected due to the
wide spacing between WE1 and WE2. Faradaic efficiencies of 20-25% were observed for these assemblies. ... 143 Figure 5.10: Photocurrent density of the RuP2-IrOX NP assemblies on two
xxv
Figure 5.11: A cartoon of the assembly after an additional ALD of ~ 1 nm of TiO2, represented by the light blue edge of the nanoparticles.
This ALD layer is added after the chromophore (RuP2) is adsorbed to the surface, but before the IrOX NPs are deposited. This creates
a protective layer of TiO2 around the phosphonic acid groups of the
chromophore, which anchor the complex to the metal oxide surface. ... 147 Figure 5.12: Photocurrent densities after 2 hours of photolysis for the RuP2-IrOX
assemblies on the nanoITO/TiO2 core/shell electrodes (TiO2
thickness = 6.6 nm) with and with ALD stabilization (10 cycles) were 110 µA/cm2 and 97 µA/cm2, respectively. Photolysis conditions were at pH 5.8 with an applied potential bias of 300 mV vs. Ag/AgCl, while illuminating at 455 nm and 14.5 mW/cm2. ... 148 Figure 5.13: Photolysis of PMAA stabilized FTO|nanoITO|TiO2|RuP2, IrOX
assembly. The light (455 nm, 14.6 mW/cm2) is turned on at 60 s, indicated by the arrow. A potential bias of 0.4 V vs. Ag/AgCl was
applied in a pH 5.8 NaSiF6 buffer. ... 149
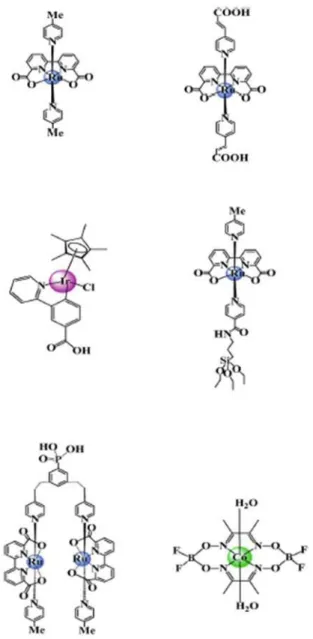
Figure 6.1: Structures of the three quaterpyridine complexes studied. In 1, L = Cl, MeCN. In 2, L = MeCN. In 3, L = vinyl pyridine (VP). ... 154 Figure 6.2: Heating program for GC detection of benzyl alcohol and benzaldehyde. ... 159 Figure 6.3: Cyclic voltammetry of complexes 1 (orange), 2 (blue) and 3 (green)
in 0.1 M TBAPF6 and MeCN, at 10 mV/s. ... 160
Figure 6.4: Cyclic voltammetry of 1 in 0.1 M TFA at 25 mV/s. ... 161 Figure 6.5: Cyclic voltammetry of Comlex 2 in 0.1 M TFA at 25 mV/s. Scan
1 is in blue and scan 12 is in orange. The CVs change over time due to MeCN exchange with H2O. ... 162
Figure 6.6: Cyclic voltammetry of Complex 3 in 0.1 M TFA. The blue curve corresponds to the GC working electrode, where higher rates of polymerization are observed (the peak formation at 0.5 V). The orange curve corresponds to the BDD working electrode, which observes no polymerization of the catalyst. ... 163 Figure 6.7: Cyclic voltammetry of Complexes 1 (a), 2 (b) and 3 (c) in 0.1
M TFA, without (blue) and with (orange) benzyl alcohol. ... 165 Figure 6.8: Plot of ic/ip vs. ν-1/2 for Complex 1 in 0.1 M TFA with 20 mM
benzyl alcohol. CVs were performed using a BDD working electrode, Pt auxiliary electrode and Ag/AgCl reference electrode. Three different potentials were reported, each vs. Ag/AgCl. The kobs derived from each potential was 320 s-1, 3800 s-1 and 7500 s-1,
xxvi
Figure 6.9: (a) Cyclic voltammetry of low concentrations of Complex 1 and 20 mM benzyl alcohol. (b) The linear relationship between the
concentration of the catalyst, Complex 1, and the limiting current…………...…..164 Figure 6.10: Chronoampergram of a bulk electrolyses of Complex 1 and benzyl
alcohol in 0.1 M HClO4 and 20% MeCN, where the potential was held
at 1.4 V vs. Ag/AgCl for 13 hours. nanoITO on FTO coated glass was used as a working electrode, with a Pt auxiliary electrode and 3 M Ag/AgCl reference electrode………165 Figure 6.11: Complex 1 in 0.1 M HClO4 and 20% MeCN before (left) and
after (right) bulk electrolysis. The complex undergoes a color change from pink to orange, indicating the catalyst may be
xxvii LIST OF TABLES
Table 3.1: Examples of how the measured coverage of Ir of the same film can vary between different pH solutions. ΓIr is in mol Ir/cm2 and
is determined by integrating the IrV/IV oxidation wave. ... 70 Table 3.2: Change in charge (Q) of the Ir IV/V wave with varying scan rate
(ν) at pH 3. ... 71 Table 3.3: Conductivity measurements (mS/cm) of each of the phosphate
buffers. pH 3 and 5 are both 1.0 M phosphate and pH 7.5, 10 and 12 are 0.1 M phosphate. ... 72 Table 3.4: Examples of how the coverage of Ir can change before and after
potentials more positive the onset of water oxidation are applied. ΓIr is in mol Ir/cm2 and is determined by integrating the IrV/IV
oxidation wave. ... 73 Table 3.5 kcat (s-1) of water oxidation catalysis for two different overpotentials
in 0.1 M phosphate buffers of varying pH. ... 75 Table 3.6: The slopes (b) and exchange current values (j0) for the IrOx NP
films at different pH values taken from the catalytic Tafel plot. Each film was electroflocculated for 10 minutes. ... 79 Table 3.7: Zeta potentials for IrOX NPs, resuspended in 0.01 M Phosphate
buffers of various pH. ... 84 Table 3.8: Ir 4f7/2 and Ir 4f5/2 binding energies (eV) for each Ir species in the
different preparations of IrOX NPs. The percent of each Ir species is
within the IrOX NPs is also presented in the last column. ... 94
Table 5.1: Photocurrent (µA/cm2) of the RuP2-IrOX NP assemblies on three
different electrodes in pH 5.8 NaSiF6 solution, illuminated at 450
nm at 14.5 mW/cm2 with an applied potential bias of 0 V. The
core/shell electrode has an ALD TiO2 layer that is 3.7 nm in thickness. ... 135
Table 5.2: Photocurrent (µA/cm2) of the RuP2-IrOX NP assemblies on three
different electrodes in pH 5.8 NaSiF6 solution, illuminated at 450
nm at 14.5 mW/cm2 with an applied potential bias of 0 V. 50 cycles
and 100 cycles refer to 3.7 nm and 6.6 nm thickness of the TiO2 shell. ... 138
Table 5.3: Photocurrent (µA/cm2) of the RuP2-IrOX NP assemblies, with a 24
hour loading time for RuP2, in pH 5.8 NaSiF6 solution, illuminated
xxviii
Table 5.4: Photocurrent (µA/cm2) over time from assemblies of electro- flocculated IrOX NPs and RuP2, where the arrangement of the
photoanode is FTO|TiO2|IrOX,RuP2. Two different electroflocculation
times were explored, 10 and 20 minutes. The photoanodes were backlit at a 45° angle with a 455 nm LED at 14.5 mW/cm2. A 0 V vs. Ag/AgCl potential bias was applied in pH 5.8 NaSiF6 buffer. ... 143
Table 6.1: Formal potential of each of Complexes 1, 2 and 3 in 0.1 M TBAPF6
and MeCN. ... 160 Table 6.2: E1/2 values for the aqueous electrochemistry of Complexes 1, 2, and
xxix
LIST OF SCHEMES
Scheme 4.1: Water oxidation mechanism for electroflocculated IrOX NPs
films ... 102 Scheme 4.2 Water oxidation mechanism for the freely diffusing IrOX NPs
above pH 6 ... 103 Scheme 4.3: Synthetic route for the Click Ferrocenation of IrOX NPs. The purple
circle represents the IrOX NPs, which begin the synthesis as valeric
xxx
LIST OF ABBREVIATIONS AND SYMBOLS
A Area of the Electrode
A (unit) Ampere
Å Angstrom
AFM Atomic Force Microscopy
AgBF4 Silver Tetrafluoroborate
Ag/AgCl Silver/Silver Chloride Reference Electrode
ALD Atomic Layer Deposition
Al2O3 Aluminum Oxide
Ar Argon
Au Gold
BDD Boron Doped Diamond Electrode
BF4- Tetrafluroborate Anion
BnOH Benzyl Alcohol
bpy 2,2’-bipyridine
BTU British Thermal Unit
C Carbon, Elemental
CO Concentration of the Catalyst
CS Concentration of the Substrate
ca. Circa
CAN Cerium Ammonium Nitrate
Ce Cerium
xxxi
Ce(OH)3 Cerium (III) Hydroxide
CH4 Methane
CH3CH2OH Ethanol
CHCl3 Chloroform
CH3CN Acetonitrile
CH3OH Methanol
Cl Chloride, Chloro
cm Centimeter
cm-2 Inverse Centimeter
Co Cobalt
CO2 Carbon Dioxide
Co3O4 Cobalt Oxide
Cu Copper
CuSO4 Copper Sulfate
CV Cyclic Voltammetry
D Diffusion Coefficient in cm2/s
dia. Diameter
DCM Dichloromethane
DMF Dimethylformamide
DMSO Dimethyl Sulfoxide
dpp 2,0-di(pyrid-2’-yl)-1,10-phenanthroline
dppi 3,6-di-(4-methylpyrid-2-yl) pyridazine
xxxii
DSA Dimensionally Stable Anode
DSPEC Dye-Sensitized Photoelectrosynthesis Cell
DSSC Dye-Sensitized Solar Cell
e- Electron
E Potential
E0 Formal Potential
E1/2 Measured Half-Wave Potential in Cyclic Voltammetry
Ep Measure Peak Potential
EC’ Electrochemical Reaction Followed by a Chemical Reaction
EDS Energy Dispersive X-Ray Spectroscopy
EIROF Electrodeposited Iridum Oxide Film
eQCM Electrochemical Quartz Crystal Microbalance
ET Electron Transfer
EtOH Ethanol
eV Electron Volt
EXAFS Extended X-Ray Absorption Fine Structure
F Faraday’s Constant, 96485 coulombs/mole
Fc Ferrocene
Fc+ Ferrocenium
FcIrOX Ferrocenated Iridium Oxide Nanoparticles
Fe Iron, Elemental
Fe2O3 Iron Oxide
xxxiii
FTO Fluorine-Doped Tin Oxide
FTO│nanoITO Nanoscopic Tin-Doped Indium Oxide Film on a Fluorine-Doped Tin Oxide Coated Glass Slide
Ga Gallium
GaP Gallium Phosphide
GC Glassy Carbon Electrode
H+ Proton
H2 Hydrogen, Molecular
HClO4 Perchloric Acid
HER Hydrogen Evolution Reactoin
HNO3 Nitric Acid
HPT Hydride Proton Transfer
hr Hour
hr-1 Inverse Hour
H2O Water
H2O2 Hydrogen Peroxide
HOMO Highest Occupied Molecular Orbital
H2SO4 Sulfuric Acid
H2PO3 Phosphonic Acid
H3PO4 Phosphoric Acid
H2PO4- Monobasic Phosophate Anion
HPO4-2 Dibasic Phosphate Anion
PO4-3 Tribasic Phosphate Anion
xxxiv
iL Limiting Current for a Catalytic Reaction
ilim Limiting Current for a Microelectrode CV Experiment
ip Peak Current
ISS Steady-State Current
In Indium
iR Current Times Resisitance
Ir Iridium, Elemental
IrIII Iridium (III) Oxidation State
IrIV Iridium (IV) Oxidation State
IrV Iridium (V) Oxidation State
IrVI Iridium (VI) Oxidation State
IrIV/III Iridium 3+, 4+ redox couple
IrV/IV Iridium 4+, 5+ redox couple Ir 4f5/2 Iridium 4f5/2 Electron Orbital
Ir 4f7/2 Iridium 4f7/2 Electron Orbital
Ir(acac)3 Iridium Acetylacetonate
[IrCl6]-2 Iridium(IV) Chloride Anion
IrOX Iridium Oxide Nanoparticles
IrOX·nH2O Hydrated Iridium Oxide Nanoparticles
IrO2 Iridium Oxide, Bulk Material
[Ir(OH)6]-2 Iridium(IV) Hydroxide Anion
ITO Tin-doped Indium Oxide
xxxv
j0 Exchange Current Density
k Boltzmann Constant in J/K
kcat Catalytic Rate Constant
kobs Observed Rate Constant
K2IrCl6 Potassium hexachloroiridate
L Liter
LED Light Emitting Diode
LUMO Lowest Unoccupied Molecular Orbital
M Molar (mol/L)
mA Milliamp
mC Millicoulomb
Mebimpy 2,6-bis(1-methylbenziidazol-2-yl)pyridine
MeCN Acetonitrile
mg Milligram
MgSO4 Magnesium Sulfate
MHz Megahertz
min Minute
mL Milliliter
mM Millimolar (mmol/L)
mmol Millimole
mol Moles
mV Millivolt
xxxvi
n Number of Electrons
nc Number of Electrons Involved in the Catalytic Reaction
np Number of Electrons Involved in the Peak Reaction
N Number of Moles
N2 Nitrogen, Molecular
Na Sodium
NaHCO3 Sodium Bicarbonate
NaN3 Sodium Azide
nanoITO Nanoscopic Tin-Doped Indium Oxide Films
NaOH Sodium Hydroxide
Na2SiF6 Sodium Hexafluorosilicate
(NH4)2Ce(NO3)6 Cerium Ammonium Nitrate
NHE Normal Hydrogen Electrode
Ni Nickel
NiO Nickel Oxide
N3IrOx Iridium Oxide Nanoparticles with Azide Terminated Capping
Ligand
nm Nanometer
NP Nanoparticles
O Oxygen, Elemental
O2 Oxygen, Molecular
OER Oxygen Evolution Reaction
Os Osmium
xxxvii
PEC Photoelectrolysis Cell
PhCHO Benzaldehyde
PhCHOH Benzyl Alcohol
pic Picoline
PMAA Poly(methacrylic acid)
PO4-3 Phosphate Anion
POCl3 Phosphoryl Chloride
PSII Photosystem II
Pt Platinum
Q Charge in coulombs
QCM Quartz Crystal Microbalance
qpy Quaterpyridine
r Hydrodynamic Radius of a Nanoparticle
r0 Radius of a Microdisk Electrode
R Gas Constant in J/mol K
Rh Rhodium
RHE Reversible Hydrogen Electrode
RMS Root Mean Square
rpm Rotations Per Minute
RRDE Rotating Ring Disk Electrode
RT Room Temperature (ca. 25 °C)
Ru Ruthenium
xxxviii RuP2 [Ru(4,4’-PO3H2bpy)2(bpy)]2+
s Second
[S]bulk Concentration of Substrate in Bulk Solution
SAM Self-Assembled Monolayer
SEM Scanning Electron Microscopy
Si Silicon
SIROF Sputtered Iridium Oxide Films
SnO2 Tin Oxide
Sn:In2O3 Tin-Doped Indium Oxide (ITO)
T Temperature
TBAOH Tetrabutylammonium Hydroxide
TBAP Tetrabutylammonium Perchlorate
TBAPF6 Tetrabutylammonium Hexafluorophosphate
TDMAT Tetrakis(dimethylamido)titanium
TEM Transmission Electron Microscopy
TFA Trifluoroacetic Acid
THF Tetrahydrofuran
Ti Titanium
TiO2 Titanium Dioxide
TO Turnover
trpy 2,2′:6′,2″-terpyridine
UV-Vis Ultraviolet-Visible Spectroscopy
xxxix
VP Vinyl Pyridine
WE Working Electrode
WO3 Tungsten Oxide
WOC Water Oxidation Catalyst
XANES X-Ray Absorption Near Edge
XAS X-Ray Absorption Spectroscopy
XPS X-Ray Photoelectron Spectroscopy
vs. Versus
ZnO Zinc Oxide
α Transfer Coefficient
Γcat Coverage of Catalyst
ΓIr Coverage of Iridium in mol/cm2
ΔEp Difference in Potential of the Oxidative and Reductive Peak for a
Redox Couple
ΔG Gibbs Free Energy
η Viscosity in cP
µA Microamp
µg Microgram
µL Microliter
µm Micrometer
µM Micromolar
ν Scan Rate
ω Rotation Rate
xl
1
CHAPTER 1: Introduction to the Dye-Sensitized Photoelectrosynthesis Cell (DSPEC)
1.1 SOLAR ENERGY AS A RENEWABLE SOURCE
Over the past few decades, the global energy demand has significantly increased due to growing economies, advances in technology and increased access to that technology. Figure 1.1, from the International Energy Outlook of 2013 published by U.S. Energy Information
Administration, depicts this trend and further predicts how this demand will increase through 2040.1 There is need for a renewable efficient energy source to meet this perpetually increasing demand.
2
Battery materials have been proposed as a storage method for solar energy. Most recently, Tesla Motors announced the production of at-home versions of their car batteries, Powerwall©, that can pair with photovoltaic materials for solar energy storage.3 However, the materials for such high power density batteries can become quite expensive. Batteries are also prone to losing their charging and discharging ability over time, largely due to loss of structural integrity of the cathodes and anodes. An alternative to this is to use a different method of storing solar energy, by mimicking plants and storing this energy in chemical bonds, as is done in
photosynthesis.
One of the most sought after reactions for storing energy in chemical bonds is the splitting of water into molecular oxygen and hydrogen. Per its mass, hydrogen has one of the highest energy densities of any molecule. As a fuel, it has the added benefit of producing water as its only side product, eliminating the production of greenhouse gases. Generating hydrogen from the splitting of water involves two half reactions: the oxidation of water to oxygen gas and protons and the reduction of those protons to hydrogen gas. The major obstacle in this reaction is the large activation energy of water oxidation required in the thermodynamically uphill
3
reaction. While the free energy change (ΔG) of this reaction corresponds to 1.23 eV, an energy within the solar spectrum, it often requires more energy (i.e. overpotential, η) due to a large kinetic obstacle from the multielectron process. This large overpotential results in a need for either a semiconductor with a large enough band gap energy to compensate for this increase in energy requirement or a catalyst to lower the overpotential of the water oxidation reaction.
The semiconductor requirements for water splitting involve a large band gap energy, a conduction band energy with a potential more negative than the formal potential (E0) of the
H+/H2 reaction and a valence band energy with a potential more positive than the formal
potential of the O2/H2O reaction. One such material that fits these requirements is TiO2, which
has a band gap of ca. 3 eV. In 1972, Honda and Fujishima first demonstrated solar water splitting via illumination of a TiO2 semiconductor photoanode coupled with a Pt cathode.4
However, the conduction band of TiO2 is just barely more negative than that of the proton
reduction reaction, which leads to slow overall water splitting. Finding a semiconductor material that is efficient and stable in the conditions for both the oxygen evolution reaction (OER) and the hydrogen evolution reaction (HER) has been a challenge. Because of this, dual band gap cells have been explored, where a p-type semiconductor material is combined with an n-type
semiconductor material to more efficiently split water.2 The use of two different semiconductor
4
The development of photocathode semiconductor materials has largely focused on phosphide, sulfide, telluride and selenide materials, consisting of various ratios of Ga, Cd and In.5,6,7,8,9,10,11,12, This focus is due to their conduction band being sufficiently negative, as shown in Figure 1.2. Due to the large overpotential, the addition of a Pt catalyst to the
semiconductor/liquid interface has been implemented.5a,13 It was found that using catalytic metal
particles, instead of a metal film, improved efficiency for H2 production, likely because a
continuous metal film blocks light absorption by the semiconductor. By limiting the coverage of the catalyst to island-like structures, the electrode material is essentially transparent.2
Conversely, photoanode semiconductor materials for water oxidation have been largely oxide based. The valence band on these materials consist of O 2p orbitals, with the valence orbitals of the metals serving as the conduction band.2 Because of this, the valence band of these materials are all very similar, while the conduction band is varied based on which metal ions are present; examples include TiO2, Fe2O3, WO3 and ZnO (Figure 1.2).14,15 Because the valence
Figure 1.2: Band gaps of common semiconductor materials. The negative limit on the left corresponds to the conduction band energy and the positive limit on the right corresponds to the valence band energy. The dotted lines
5
band energies tend to be significantly higher than the OER potential, the excess energy that is absorbed escapes via thermal relaxation, resulting in poor efficiency.
Unassisted solar water splitting has been widely reported using a combination of the n-type TiO2 semiconductor electrode combined with the p-type GaP.16,17,18,19,20 Efficiencies up to
1% were reported, largely due to the instability of the p-GaP photocathode. These were all examples of some of the first photoelectolysis cells (PEC). Combination of a PEC device with a photovoltaic (PV) device has also been explored, where the light that isn’t absorbed by the PEC semiconductor is instead absorbed by the PV. This provides a bias that is required to split water.21
In a similar manner, Grätzel combined a dye-sensitized solar cell (DSSC) with a WO3
photoanode to increase efficiency.22,23,24 DSSC devices generally contain a high surface area semiconductor, such as TiO2, with dyes bound to the surface to absorb light and inject the
6
DSSC devices have other advantages as well. The implementation of the dye splits the duties of the semiconductor material. The dye serves the purpose of absorption, while the
semiconductor electrode’s sole responsibility is charge separation of the injected electron and the resulting holes. Most DSSC devices implement a high surface area, mesoporous semiconductor structure, which results in high loading of the dye,27 and use TiO2 as their base, which is a
relatively cheap material, reducing cost of the overall device.28,29,30 Because of this, they also are simple to fabricate, lightweight and are flexible in design.25 The use of a dye attached to
mesoporous semiconductor base has also been applied to the photocathode as well, with NiO serving as the base.31,32,33,34,35 The combination of both an n-type DSSC with a p-type DSSC has also been explored for its advantages. By manipulating the absorption of each dye molecule so that they’re complementary to each other, the theoretical maximum efficiency is greater than 40%, significantly higher than a single device.25 Currently, the efficiency is much less ideal, but
strides have been made to further improve the function of these devices.
While strides have been made to improve the stability and efficiency of photoanode and cathode materials for water splitting, the large overpotentials required, especially for water oxidation, result in higher energy requirements needed for water splitting. To reduce these high overpotentials, electrocatalysts have been added on the surfaces of both semiconductor
electrodes. Pt has proven to be the ideal electrocatalyst for the HER, with a low overpotential of 50 mV at 10 mA/cm2. Electrocatalysts for the OER have proven to be more elusive; some examples of these are discussed in Section 1.4. The DSSC, when combined with electrocatalysts for water oxidation and reduction, leads to the development of the Dye-Sensitized
7
1.2 THE DYE-SENSITIZED PHOTOELECTROSYNTHESIS CELL (DSPEC)
The Dye-Sensitized Photoelectrosynthesis Cell (DSPEC) was originally proposed by Thomas J. Meyer in 2005.36 The goal of these devices is to take common resources, such as H2O and CO2 and yield a fuel entirely from sunlight to store solar energy for later use. This
device consists of two semiconductor electrodes with chromophore catalyst assemblies, as pictured in Figure 1.3. At the photoanode, a chromophore is excited via sunlight and injects an excited electron into the semiconductor material. The chromophore then oxidizes the catalyst, attached by a bridging ligand, which in turn oxidizes water to O2 and H+. The protons then travel
across a membrane to the photocathode, where they are reduced to some type of fuel by another chromophore-catalyst assembly. The fuel that is produced can be manipulated based on what catalyst is present at the cathode. Examples include H2, CH4, CH3OH and CH3CH2OH. The
example shown in Figure 1.3 illustrates the flow of electrons throughout the device, from the
8
excitation of the photoanode chromophore over to the photocathode, where the catalyst specifically reduces CO2 and H+ to form CH4.
DSPEC devices are very similar in structure to the DSSC devices discussed above. They both consists of the mesoporous semiconductor material for high surface area electrodes, as well as high loading concentrations of each dye. The major difference between the two is the addition of electrocatalysts at both the photoanode and photocathode in the DSPEC. DSSC devices use an electron mediator in order to regenerate the ground state of each dye. In a DSPEC, the catalyst is responsible for regenerating the ground state of the dye. On the photoanode side of the device, the catalyst reduces the chromophore back to its ground state by donating an electron. After successive electron donations, the catalyst then oxidizes the desired reagent, in this case water, to form molecular O2 and H+. This dependence on the catalyzed reaction to regenerate the
chromophore is what distinguishes the DSPEC from the DSSC.
There are major challenges to be overcome on both sides of the DSPEC device, including efficient absorption by the chromophore, limiting back electron transfer within the system, photoanode and photocathode stability and lowering the overpotential required for both the cathodic and anodic reactions.26,37,38,39 As the topic of this dissertation focuses on the
photoanode half of this device, this introduction will focus on the development of that half of the device.
1.3 THE PHOTOANODE
9
device. This is easier said than done, as the stability conditions for the dye can be very different than those for the catalyst and the semiconductor material. The second requirement is that the sensitizer must absorb in the visible part of the solar spectrum, in order to maximize how much of the light is going to towards water splitting and not waste. Ideally, the dyes would be fixed to the semiconductor surface by a linker that is stable under aqueous conditions. Finally, the HOMO and LUMO of the dye must be at sufficient energies for the flow of electrons that is required for water oxidation in this setup. The HOMO must be at a potential more positive than of the onset of water oxidation for the particular catalyst it is paired with. Conversely, the LUMO energy level must be more negative than the conduction band of the semiconductor in order to be able to inject excited electrons.
Examples of some popular chromophores in the literature that have been utilized in DSSC and DSPEC devices are featured in Figure 1.4.26 All of these dyes incorporate highly
conjugated pi systems for efficient molecular absorption in the UV-Visible region of the solar spectrum and then electron transfer into the desired semiconductor surface. Most of the dyes consist of polypyridal ligands paired with Ru centers and are derivatized from [Ru(bpy)3]2+, a
gold standard for a chromophore in these types of devices. Most importantly, all of these
photosensitizers have a linker which can anchor them to the metal oxide semiconductor surface. The linkers are generally either carboxylic acid or phosphonic acid groups, which are known to interact with metal oxide surfaces. Carboxylic acids are generally considered a weaker
interaction than the phosphonic acid groups, which form covalent bonds with metal oxide surfaces. Phosphonic acid groups, however, are prone to hydrolysis attack as pH increases.51 Because of this, significant research has been focused on ways to further stabilize the
10
thermodynamic potential of water oxidation is shifted to more negative potentials and should require less potential bias to proceed.
Stabilization of these linkers has been thoroughly explored. One proposed method is to cover the chromophore with an electronically and ionically conductive material, such as Nafion or other electropolymerized films.52 Modifying the ligands of the chromophores to include vinyl
11
freely diffusing in solution, the vinyl groups will polymerize and form a film on the electrode surface, stabilizing the chromophore in the process.53,54,55,56,57 More recently, physically
blocking the anchoring group with a metal oxide material, such as Al2O3 or TiO2, has been
explored.58,59,60,61,62,63,64,65,66,67 Atomic layer deposition was implemented in order limit the metal oxide film growth to less than 1 nm in thickness. By limiting film growth to this thickness, the linker is covered, but not the entire chromophore, in order to maintain both the maximum absorption and ET to the catalyst.. These thin films have shown promise is stabilizing phosphonic acid groups at pH values up to 13.68
Improvements in the semiconductor electrode have also been made by altering the structure. Nanostructured semiconductors, such as rods, have shown enhancement in
photocurrent.69,70 This is due to the decreased path length for the excited electron to travel from injection to the conductive circuit. Because this is shorter, there is less chance of
recombination.3 Core/shell electrodes have also been developed, which involve a thin
semiconductor shell surrounding a conductive core. 71,72 This maintains the high surface area of the mesoporous titania with nanostructured optically transparent conductive materials such as tin-doped indium oxide.74 The thin semiconductor layer limits back electron transfer to the dye and improves electron injection into the circuit.
1.4 CATALYSTS FOR WATER OXIDATION
12
wavelengths, i.e. in the visible region and near IR region, have the potential to be used to split water. This improves the solar energy conversion efficiency, as more of the solar spectrum can be applied towards water splitting.
There are two major requirements for an efficient water oxidation catalyst.2 The first is that it must be able to create a sufficient amount of O2, at a low overpotential, i.e. this reaction
should occur at the rate at which the chromophore is injecting electrons into the semiconductor electrode. This means electron transfer must be fast between the chromophore and catalyst and within the catalyst to oxidize water. The other condition is that the catalyst must be photo- and electrochemically robust under the conditions of water oxidation for extended periods of time. Both molecular, homogeneous catalysts and heterogeneous catalysts have been explored. This dissertation delves into the characterization of IrOX NPs, a heterogeneous water oxidation
catalyst, and three new Ru polypyridal complexes, which have shown potential as water oxidation catalysts.
1.4.1 Homogeneous Catalysts
Orginially, catalysts for water oxidation were synthesized to structurally mimic
Photosystem II (PSII), the main player in natural photosynthesis that produces oxygen gas (O2).
In this system, O2 is generated from splitting water molecules. H2O is oxidized by manganese
sites within the complex that are bonded together by µ-oxo bridges. Using this as an inspiration, various mono-, di-, tri- and tetrametallic complexes have been suggested as catalysts using ruthenium, manganese, rhodium, osmium and iridium metal
centers.74,75,76,77,78,79,80,81,82,83,84,85,86,87,88,89,90,91,92,93 They have polypyridal ligands, such as
13
All of these molecular catalysts consist of a metal center that can access high oxidation states, such as 4+, 5+ or higher. These high oxidation states are required for water oxidation catalysis. Organometallic complexes which cannot access these states have repeatedly shown lack of catalytic activity.26 A relatively new trend in research has been to synthesize seven coordinate Ru complexes, where there is an open site on the metal center that can react with H2O. Licheng Sun et al. has observed fast water oxidation rates with Ce(IV) as a chemical