HIV Treatment
HIV treatment as prevention among people who
inject drugs – a re-evaluation of the evidence
Hannah Fraser,
1,†Christinah Mukandavire,
1,†Natasha K Martin,
1,2Matthew Hickman,
1Myron S Cohen,
3William C Miller
3and
Peter Vickerman
1*
1
School of Social and Community Medicine, University of Bristol, Bristol, UK,
2Division of Global Public
Health, University of California San Diego, CA, USA and
3Department of Epidemiology, University of
North Carolina, Chapel Hill, NC, USA
*Corresponding author. School of Social and Community Medicine, Oakfield House, Oakfield Grove, University of Bristol, Bristol BS8 2BN, UK. E-mail: [email protected]
†Christinah Mukandavire and Hannah Fraser are joint first authors.
Accepted 1 June 2016
Abstract
Background:
Population-level associations between community measures of HIV viral
load and HIV incidence have been interpreted as evidence for HIV anti-retroviral treatment
(ART) as prevention among people who inject drugs (PWID). However, investigation of
concurrent HCV and HIV incidence trends allows examination of alternative explanations
for the fall in HIV incidence. We estimate the contribution of ART and reductions in
inject-ing risk for reducinject-ing HIV incidence in Vancouver between 1996 and 2007.
Methods:
A deterministic model of HIV and HCV transmission among PWID was
cali-brated to the baseline (1996) HIV and HCV epidemic among PWID in Vancouver. While
incorporating parameter uncertainty, the model projected what levels of ART protection
and decreases in injecting risk could reproduce the observed reduction in HIV and HCV
incidence for 1996–2007, and so what impact would have been achieved with just ART or
just reductions in injecting risk.
Results:
Model predictions suggest the estimated reduction (84%) in HCV incidence for
1996–2007 required a 59% (2.5–97.5 percentile range 49–76%) reduction in injecting risk,
which accounted for nine-tenths of the observed decrease in HIV incidence; the
remain-der was achieved with a moremain-derate ART efficacy for reducing sexual HIV infectivity (70%,
51–89%) and an uncertain ART efficacy for reducing injection-related HIV infectivity (44%,
0–96%). Despite this uncertainty, projections suggest that the decrease in injecting risk
reduced HIV incidence by 76% (63–85%) and ART further reduced HIV incidence by 8%
(2–19%), or on its own by 3% (
34–37%).
Conclusions:
Observed declines in HIV incidence in Vancouver between 1996 and 2007
should be seen as a success for intensive harm reduction, whereas ART probably played
a small role.
Key words:Injecting drug users, HAART, HIV, HCV, Anti-retroviral treatment
VCThe Author 2016; all rights reserved. Published by Oxford University Press on behalf of the International Epidemiological Association 466
Introduction
The pivotal trial, HPTN 052, and numerous observational studies among sero-discordant couples have shown that HIV anti-retroviral treatment (ART) can reduce the risk of heterosexual HIV transmission by over 90%,1,2with new evidence also suggesting prevention benefit among men who have sex with men (MSM).3However, although some prevention benefit should be expected among people who inject drugs (PWID), due to decreases in viral load, the magnitude of this benefit is uncertain.
In a prospective cohort study conducted in Vancouver, associations between HIV incidence among PWID and community measures of the median HIV viral load among diagnosed PWID (so-called community viral load) have been interpreted as evidence for the prevention benefit of ART among PWID.4 However, although the association held after adjustment for time-varying injecting risk behav-iours, which also generally decreased over the study period, it is unclear whether all factors affecting HIV incidence were adequately accounted for.5,6Also, there is discussion over whether the median viral load among HIV-diagnosed PWID well proxies the overall infectivity of a PWID population,7first because it does not account for the variability in viral load,7and so infectivity, among unsuppressed PWID who were the majority of HIV-diagnosed PWID in Vancouver during the late 90 s,4and second because undiagnosed PWID are not incorporated in the community viral load measure, but may contribute dis-proportionately to transmission if many PWID are undiag-nosed (as was case in late 90 s in Vancouver8).
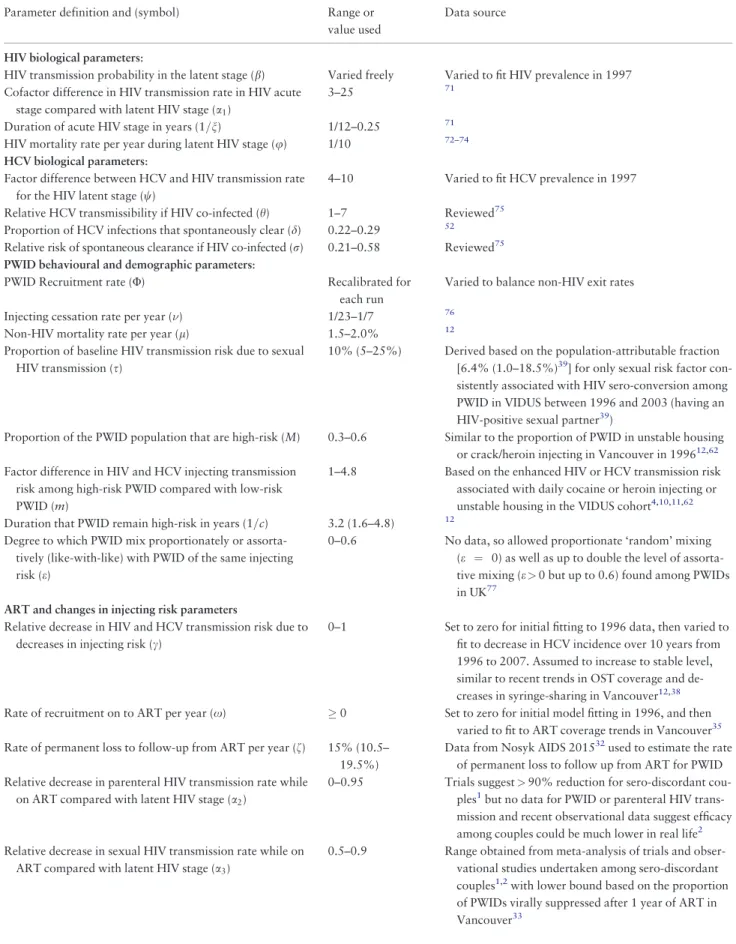
Hepatitis C (HCV) is a blood-borne virus transmitted primarily through parenteral exposure, and much less ef-fectively by sexual exposure.9In the Vancouver study,4 de-clines in HCV incidence10–12 occurred concurrently with
observed decreases in HIV incidence (Figure 1). These de-creases in HCV incidence are likely to indicate reductions in injecting risk, which would also impact on HIV trans-mission. We use a joint HIV and HCV transmission model among PWID to estimate the degree to which HIV
treatment contributed to the observed decline in HIV inci-dence in Vancouver between 1996 and 2007, as considered by Woodet al.,4or alternatively how much was due to re-ductions in injecting risk. We do not consider more recent years because our primary aim was to consider possible reasons for the large decrease in HIV incidence previously suggested to be due to ART scale-up.
Methods
Model description
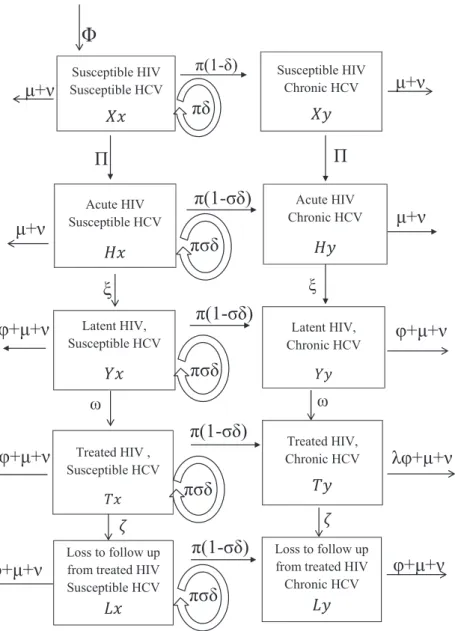
We developed a deterministic mathematical model to simu-late the transmission of HIV and HCV among PWID. The model incorporates the transmission of HIV and HCV due to injecting drug use and HIV transmission due to sexual risk behaviour (Figure 2; further details insupplementary material, available as Supplementary dataat IJEonline). HCV transmission was not assumed to be sexually trans-mitted because sexual HCV transmission is rare9,13 unless linked to riskier sex acts among MSM.14The PWID
popu-lation is divided into 10 classes depending on HIV (suscep-tible, acute, latent, ART, lost to follow-up from ART) and HCV (susceptible, chronic infection) infection status, and by whether the PWID have low or high injecting risk. The model is open, with new PWID entering through initiation of injecting drug use, and leaving due to HIV death, non-HIV death or cessation of injection. Although HCV infec-tion causes excess mortality,15,16which is elevated by HIV co-infection17,18 and partially reversed by ART,17 HCV-related mortality was not included because data from Vancouver19 suggest that it contributes little to mortality (6.0% of deaths among HCV-infected PWID: seesupple mentary materials, available asSupplementary dataatIJE
online). Lastly, data are conflicting on whether HCV affects HIV disease progression20or response to ART,20–25 and so this was not included in our model.
The model assumes that the rate at which PWID be-come infected with HIV or HCV is proportional to the prevalence of that infection, which can change over time
Key Messages
• Existing evidence for the prevention benefit of ART among people who inject drugs (PWID) is based on observed
temporal associations between community measures of decreasing HIV viral load and decreasing HIV incidence in
Vancouver and Baltimore.
• Through examination of concurrent declines in HCV incidence in Vancouver, our modelling suggests that reductions
in injecting risk may have been the main reason for the observed declines in HIV incidence among PWID, with ART
playing a smaller role.
through the effect of interventions. Because of a lack of strong evidence, ART is not assumed to reduce HCV in-fectivity26 or the susceptibility of HIV-infected PWID to
acquiring HCV infection.14,27–31A proportion of the base-line HIV transmission risk is assumed to be sexually trans-mitted, which is unaffected by decreases in injecting risk and so increases in importance as injecting risk decreases. Individuals in the HIV latent state can be recruited onto ART and experience reduced HIV-related mortality unless they are lost to follow-up.32For PWID on ART, the rela-tive reduction in the injecting and sexual HIV infectivity for the period 1996–2007 is denoted by factorsa2anda3,
respectively, compared with the HIV latent phase-defined as the efficacy of ART for reducing sexual and injecting HIV infectivity. The relative decrease in the overall HIV and HCV injecting transmission risk over the period 1996– 2007 is denoted byc, withc ¼ 0 denoting no change in baseline (1996) levels of injecting risk andc ¼ 1 denoting a 100% reduction in injecting risk.
Model parameterization
All model parameters were obtained from the literature, with most being specific to Vancouver (Table 1). Uniform uncertainty bounds were assigned to all model parameters except for: (i) the baseline HIV transmission rate during the latent stage of HIV (b) and the factor difference be-tween the baseline HIV (during HIV latent stage) and HCV transmission rate (w); and (ii) the efficacy of ART in reducing a PWID’s injection-related HIV infectivity (a2),
and the factor decrease in HIV and HCV injecting trans-mission risk (c), which were all varied widely in the model fitting process. More details are included in the model cali-bration section.
To be conservative, ART was assumed to decrease sex-ual HIV transmission (a3) by 50–90%,2 with the lower
bound based on the proportion of PWIDs on ART who were virally suppressed in Vancouver at this time.33 This variable was varied more widely in the initial exploratory analysis. The ART recruitment rate (x) was calibrated such that the proportion of HIV-infected PWID on highly effective ART (HAART) was negligible in 1996,34,35 then increased up to 40% by 2000 and remained stable at that level till 2007,35 roughly similar to the real trends which increased rapidly to about 34% coverage by 1999, and then slowly increased to 40% by 2006.36,37 Coinciding with increases in Opioid substitution therapy coverage12
and decreases in syringe sharing,12,38 injecting risk was assumed to decrease exponentially over this period to a calibrated stable level (seesupplementary materials, avail-able asSupplementary dataatIJEonline).
More details on the model parameters are included in thesupplementary materialsandTable 1. The proportion of the baseline HIV transmission rate due to sexual risk (s¼10% (5–25%)) was based on the population-attributable fraction (6.4%, minimum to maximum range 1.0–18.5%39– seesupplementary materials, available as Supplementary dataatIJEonline) for the only sexual risk factor shown to be associated with incident HIV sero-conversion among Vancouver PWID (having a HIV-positive sexual partner39) over this time period. The range
was widened to allow for unobserved sexual risk factors that may have been important for HIV transmission in this setting, and to ensure that the importance of sexual HIV transmission was not underestimated. Importantly, no other ‘high-risk’ sexual behaviours, such as a man hav-ing sex with another man,40 commercial sex,39–46
having>20 lifetime sexual partners46,47or unprotected/
0 5 10 15 20 25 30 35 40 45 50
1996 1997 1998 1999 2000 2001 2002 2003 2004 2005 2006 2007
HIV or HCV incidence (per 100 person years)
Year
HCV incidence
HIV incidence
Figure 1. HIV incidence and HCV incidence data among at risk susceptible PWID in Vancouver from 1996 to 2007. Data from Woodet al.(2009)4 and Grebelyet al.(2014)10
unsafe sex,4,38–46,48,49were related to incident HIV sero-conversion in adjusted analyses over this time in Vancouver; whereas many injection-related risk factors were consistently and strongly related, such as daily co-caine/speedball injecting,4,38–44,47–51 requiring help in-jecting,39,40,42,44,49,51 binge drug use39,41,44,50 and
borrowing needles.40,43,48,50,51 This gives a highly con-sistent picture that injecting risk behaviours were the main drivers of HIV transmission over this time period,
with sexual HIV transmission probably playing a small role, and so our assumption is unlikely to underestimate the importance of sexual HIV transmission.
Baseline (1996) HIV and HCV prevalence11 and
inci-dence4,12 estimates were obtained from the Vancouver Injection Drug Users Study (VIDUS). HCV and HIV anti-body prevalence (82% and 21%,11 respectively) came from PWID recruited between 1996 and 1999. As approxi-mately 26% of individuals spontaneously clear acute
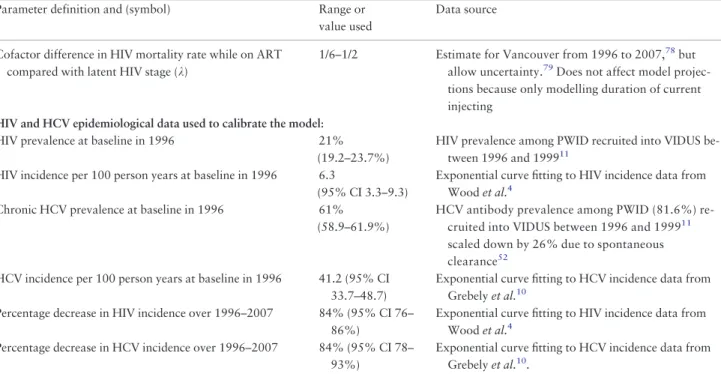
Table 1. Parameter values and uncertainty ranges (all uniformly sampled) used in numerical simulations
Parameter definition and (symbol) Range or
value used
Data source
HIV biological parameters:
HIV transmission probability in the latent stage (b) Varied freely Varied to fit HIV prevalence in 1997 Cofactor difference in HIV transmission rate in HIV acute
stage compared with latent HIV stage (a1)
3–25 71
Duration of acute HIV stage in years (1=n) 1/12–0.25 71
HIV mortality rate per year during latent HIV stage (u) 1/10 72–74 HCV biological parameters:
Factor difference between HCV and HIV transmission rate for the HIV latent stage (w)
4–10 Varied to fit HCV prevalence in 1997
Relative HCV transmissibility if HIV co-infected (h) 1–7 Reviewed75 Proportion of HCV infections that spontaneously clear (d) 0.22–0.29 52 Relative risk of spontaneous clearance if HIV co-infected (r) 0.21–0.58 Reviewed75 PWID behavioural and demographic parameters:
PWID Recruitment rate (U) Recalibrated for
each run
Varied to balance non-HIV exit rates
Injecting cessation rate per year () 1/23–1/7 76
Non-HIV mortality rate per year (l) 1.5–2.0% 12
Proportion of baseline HIV transmission risk due to sexual HIV transmission (s)
10% (5–25%) Derived based on the population-attributable fraction [6.4% (1.0–18.5%)39] for only sexual risk factor con-sistently associated with HIV sero-conversion among PWID in VIDUS between 1996 and 2003 (having an HIV-positive sexual partner39)
Proportion of the PWID population that are high-risk (M) 0.3–0.6 Similar to the proportion of PWID in unstable housing or crack/heroin injecting in Vancouver in 199612,62 Factor difference in HIV and HCV injecting transmission
risk among high-risk PWID compared with low-risk PWID (m)
1–4.8 Based on the enhanced HIV or HCV transmission risk associated with daily cocaine or heroin injecting or unstable housing in the VIDUS cohort4,10,11,62 Duration that PWID remain high-risk in years (1=c) 3.2 (1.6–4.8) 12
Degree to which PWID mix proportionately or assorta-tively (like-with-like) with PWID of the same injecting risk (e)
0–0.6 No data, so allowed proportionate ‘random’ mixing (e ¼ 0) as well as up to double the level of assorta-tive mixing (e>0 but up to 0.6) found among PWIDs in UK77
ART and changes in injecting risk parameters
Relative decrease in HIV and HCV transmission risk due to decreases in injecting risk (c)
0–1 Set to zero for initial fitting to 1996 data, then varied to fit to decrease in HCV incidence over 10 years from 1996 to 2007. Assumed to increase to stable level, similar to recent trends in OST coverage and de-creases in syringe-sharing in Vancouver12,38 Rate of recruitment on to ART per year (x) 0 Set to zero for initial model fitting in 1996, and then
varied to fit to ART coverage trends in Vancouver35 Rate of permanent loss to follow-up from ART per year (f) 15% (10.5–
19.5%)
Data from Nosyk AIDS 201532used to estimate the rate of permanent loss to follow up from ART for PWID Relative decrease in parenteral HIV transmission rate while
on ART compared with latent HIV stage (a2)
0–0.95 Trials suggest>90% reduction for sero-discordant cou-ples1but no data for PWID or parenteral HIV trans-mission and recent observational data suggest efficacy among couples could be much lower in real life2 Relative decrease in sexual HIV transmission rate while on
ART compared with latent HIV stage (a3)
0.5–0.9 Range obtained from meta-analysis of trials and obser-vational studies undertaken among sero-discordant couples1,2with lower bound based on the proportion of PWIDs virally suppressed after 1 year of ART in Vancouver33
HCV infection,52 a baseline HCV chronic prevalence of 61% was assumed. Because of uncertainty and yearly fluc-tuations in incidence estimates (measured among those at risk), negative exponential curves (with non-zero asymp-totes) were fit to the incidence data for 1996–20074,10 using the nonlinear least squares method. This suggested that HIV and HCV incidence decreased by 84% (95% con-fidence interval (CI) 76–86%) and 84% (95% CI 78– 93%), respectively, over the decade (Figure 3).
Model calibration
The HIV and HCV prevalence at baseline and HIV and HCV incidence in 2007 (estimated from the curve fits), and all model parameters with uncertainty distributions in
Table 1, were randomly sampled to give 5000 model par-ameter sets. For each parpar-ameter set, the HIV transmission rate (b) and factor difference between the HIV and HCV transmission probabilities (w) were first varied to fit the model’s endemic HIV and HCV prevalence to the sampled baseline HIV and HCV prevalence among PWID in 1996. This was done using the Matlab function lsqnonlin to min-imize the squared error. A parameter set was accepted as a ‘baseline model fit’ if it also gave an HIV and HCV inci-dence within the uncertainty range of the baseline HIV and HCV incidence data for 1996.
These baseline model fits were then used to determine what combinations of ART efficacy for reducing injection-related HIV infectivity (a2) and decreases in injecting
risk (c) could result in the sampled HIV and HCV inci-dence after 10 years in 2007 (using the same Matlab nu-merical routine), with runs being rejected if the decrease in injecting risk needed to achieve the sampled decrease in HCV incidence resulted in a decrease in HIV incidence larger than observed. This produced 902 ‘full model fits’. Further details of the model calibration are in thesupple mentary material, available asSupplementary data atIJE
online.
Model analyses
To understand the contribution of ART and changes in in-jecting risk to decreasing HIV and HCV incidence, the 902 full model fits were used to project the decrease in HIV and HCV incidence that would occur over 10 years with varying efficacies of ART for reducing sexual and injection-related HIV infectivity (a2anda3¼0, 30%, 60%
and 90%) and/or different relative decreases in injecting risk (c¼0, 30%, 60% and 90%).
The 902 full model fits were then used to estimate the likely contribution that ART or changes in injecting risk made to the observed reduction in HIV incidence among PWID for 1996–2007. The proportion of the modelled de-crease in HIV incidence that would have occurred with just the effect of ART on HIV transmission being included (c
set to zero across all full model fits), or without the preven-tion effect of ART being included (a2 and a3 set to zero
across all full model fits) was estimated.
Table 1.Continued
Parameter definition and (symbol) Range or
value used
Data source
Cofactor difference in HIV mortality rate while on ART compared with latent HIV stage (k)
1/6–1/2 Estimate for Vancouver from 1996 to 2007,78but allow uncertainty.79Does not affect model projec-tions because only modelling duration of current injecting
HIV and HCV epidemiological data used to calibrate the model:
HIV prevalence at baseline in 1996 21%
(19.2–23.7%)
HIV prevalence among PWID recruited into VIDUS be-tween 1996 and 199911
HIV incidence per 100 person years at baseline in 1996 6.3
(95% CI 3.3–9.3)
Exponential curve fitting to HIV incidence data from Woodet al.4
Chronic HCV prevalence at baseline in 1996 61% (58.9–61.9%)
HCV antibody prevalence among PWID (81.6%) re-cruited into VIDUS between 1996 and 199911 scaled down by 26% due to spontaneous clearance52
HCV incidence per 100 person years at baseline in 1996 41.2 (95% CI 33.7–48.7)
Exponential curve fitting to HCV incidence data from Grebelyet al.10
Percentage decrease in HIV incidence over 1996–2007 84% (95% CI 76– 86%)
Exponential curve fitting to HIV incidence data from Woodet al.4
Percentage decrease in HCV incidence over 1996–2007 84% (95% CI 78– 93%)
Last, a linear regression analysis of covariance (ANCOVA) was undertaken53on the range of model pro-jections for the contribution of ART to decreasing HIV in-cidence for all 902 full model fits. This analysis estimated the proportion of the variability in the model projections (proportion of the sum of squares) that could be attributed to uncertainty in different model parameters or inputs. A linear regression model was then developed; including the most important parameters from the ANCOVA analysis, to determine across what parameter region the model-predicted ART made a noticeable contribution ( 20% decrease in HIV incidence).
Ethics
Patient consent was not needed because no patients were involved in the study. Ethics committee approval was not
needed because the study used previously published sec-ondary data
Results
Impact of injecting risk and ART on HIV and HCV
incidence
Figure 4shows, for different reductions in injecting riskðcÞ
and ART efficacy for decreasing HIV infectivityða2 anda3Þ,
the projected decrease in HIV and HCV incidence for 1996– 2007 among PWID in Vancouver. Both high ART efficacy (90%) or moderate decreases in injecting risk (30%) could have resulted in noticeable decreases in HIV inci-dence, whereas only reductions in injecting risk would have decreased HCV incidence. However, increases in HIV inci-dence could have occurred with just ART if there had been low to moderate ART efficacy (a2 and a3<50%), due to
improvements in HIV survival with ART. Also ART is un-likely to have decreased HIV incidence by over 40% even with high ART efficacy (90%) due to the moderate coverage of ART over this period (40%).
Contribution of ART and reductions in injecting
risk to reducing HIV incidence in Vancouver
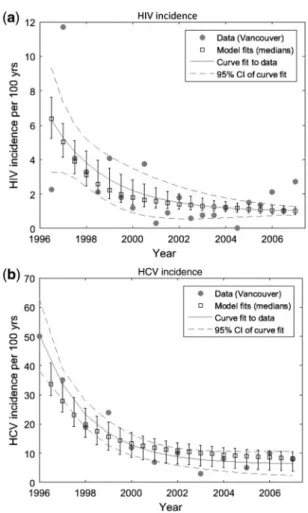
The model closely fitted the HCV and HIV incidence trends (Figure 3) except for the high HIV incidence in 1997. This high HIV incidence should be considered an outlier, probably due to an HIV outbreak,11because it is 3-fold higher than any other time period.
To achieve the observed decrease in HCV incidence for 1996–2007, a large decrease in injecting risk (median of 59%, 2.5 to 97.5 percentile range 49–76%) must have occurred. This resulted in a median 76% (63–85%) decrease in HIV incidence among PWID (Figure 5), contri-buting nine-tenths (90%, 77–98%) of the overall reduction in HIV incidence achieved from 1996 to 2007.38Once this reduction in injecting risk had been accounted for, the full observed reduction in HIV incidence was achieved with a moderate efficacy of ART for reducing sexual HIV infect-ivity (70%, 51–89%) and an uncertain efficacy for reduc-ing injection-related HIV infectivity (44%, 0–96%). Model projections suggest that the scale-up of ART alone (Figure 5) would have at best resulted in a 37% (3%, -34–37%) decrease in HIV incidence, with an 86% chance that the decrease was<25%, whereas its incremental im-pact on top of what was achieved through decreasing in-jecting risk was a median 8% (2–19%) decrease in HIV incidence. Uncertainty in the beneficial impact of ART alone results partly from HIV incidence increasing between 1996 and 2007 if ART has low efficacy (as shown in
Figure 4), with the ART efficacy needing to be>50% to result in HIV incidence decreasing.
Sensitivity analyses
In ANCOVA analyses, most (<95%) of the variability in the projected overall contribution of ART for decreas-ing HIV incidence in Vancouver was due to uncertainty in both the level of sexual HIV transmission (s– contrib-utes 19% to the variability) and the assumed decrease in HIV and HCV incidence between 1996 and 2007 (con-tributes 28% and 51%, respectively). The effect of all other model parameters was small (Supplementary Figure 1, available asSupplementary dataatIJEonline). Linear regression analyses also suggested that ART alone would only have achieved moderate impact (20% de-crease in HIV incidence) if the observed dede-creases in
HIV and HCV incidence were towards the upper (86%) and lower (78%) bounds, respectively, of what data sug-gested and there had been considerable sexual HIV transmission (s¼25%).
Discussion
HIV treatment to prevent heterosexual HIV transmission is well accepted at the individual level,1,2 and community randomized trials are under way to assess its impact at the population level.54 Although HIV treatment is also likely to reduce parenteral HIV transmission, current evidence for its effectiveness is limited4.
Although both modelling and observational data will suffer from weaknesses, specifically in terms of evidence for causation, our analyses are still useful for raising alter-native hypotheses for why HIV incidence declined in
Vancouver. In contrast to earlier studies, our evaluation suggests large decreases in injecting risk dramatically reduced HIV incidence in Vancouver between 1996 and 2007, with the scale-up of HIV treatment over that period playing a smaller role.4The current analysis addresses
con-cerns voiced by other researchers.5,6 Without question, scale-up of ART occurred35 and this scale-up probably
contributed to a decline in ‘community viral load’.4,55 However, the concurrent decline in HCV incidence10,12
observed during the scale-up of ART indicates that inject-ing risks also decreased,10,38 and contributed to the
de-crease in HIV incidence. Indeed, our model projections suggest that the reductions in injecting risk required to re-produce the observed declines in HCV incidence probably accounted for most ( 90%) of the observed decline in HIV incidence. These projections are consistent with ART only contributing an additional 8% (2–19%) decrease in HIV incidence on top of reduced injecting risk. Although uncertain, possible reasons for this small contribution of ART could be the moderate ART coverage ( 40% of HIV-infected PWID) and low proportion of HIV-infected PWID that were virally suppressed (less than 28%) over this period.4,36,55
Limitations
As with all modelling studies, this analysis has limitations. First, we cannot reject the possibility that the decreases in HIV and HCV incidence were partly due to a closed cohort
effect, where the observed HIV and HCV incidence in a co-hort tends to decrease over time because the highest-risk PWIDs become infected first with high HIV/HCV inci-dence risk, followed by successively lower-risk PWID with decreasing HIV/HCV incidence risk.56 However, this should not be a concern because the Vancouver PWID co-hort was an open coco-hort,11 and data from other more
re-cent cohorts in Vancouver (ARYS) suggest similar HCV incidence rates among PWID (6.5 per 100 person-years) and very little HIV transmission.57 Also, one could hy-pothesize that HCV incidence decreased due to the epi-demic saturating or peaking at high prevalence, rather than due to decreases in injecting risk. However, this was not considered the main effect in a recent analysis evaluating the decreases in HCV incidence in Vancouver since 1996.10This is supported by data showing HCV incidence remained high till 2000 (>15 per 100 person-years) des-pite there being high HCV sero-prevalence (82%),10,11and as Figure 1 shows, the decreases in HCV incidence fol-lowed HIV incidence trends suggesting that common fac-tors affected both infections, which coincided with large reductions in injecting risk and increases in intervention coverage.10,12,38
Second, uncertainty in the HIV and HCV incidence data made it hard to determine the precise reductions in in-cidence. Uncertainty in many model parameters also ham-pered the analysis. To counter these uncertainties, smooth curves were fit to the incidence trends, and our modelling incorporated the uncertainty in these incidence trends as well as the model parameters, and were consistent despite this.
Third, we modelled sexual HIV transmission simply, which we feel is warranted because evidence suggests that it played a small role over this period (see Methods). Further, we assumed the observed decrease in HIV inci-dence was solely due to decreases in injecting risk and the prevention effect of ART, whereas decreases in sexual HIV risk behaviour may have also contributed. If decreases in sexual risk occurred, our ART impact projections would be optimistic and so should not affect our conclusion of a limited effect of ART. We also assumed there was negli-gible sexual HCV transmission, which is rare9,13 unless associated with anal sex,14,27This behaviour was reported
by less than 10% of PWID in Vancouver,58,59 and even among MSM much lower HCV incidence rates normally occur than among PWID.27,60
Fourth, our modelling did not attempt to explicitly at-tribute the decline in injecting risk to specific interventions, although our modelled decline (60%) was consistent with observed reductions in syringe sharing.38However, a num-ber of important determinants of injecting risk changed concurrently with the declines in HIV/HCV incidence, and
so could account for our predicted decrease in injecting risk. These include OST scaling-up from about 12% to 40% of PWID,12changes in syringe exchange programme policy,38 recent incarceration decreasing from 35% to 15% of PWID in the past 6 months and unstable housing12 decreasing from 63% to 50% of PWID, all of which have been shown to be associated with decreased individual HIV and HCV acquisition risk in Vancouver,10,38,43,61–63 Subsequent analyses should evaluate the potential popula-tion impact of these intervenpopula-tion and structural changes.
Fifth, because of a lack of evidence we assumed that ART does not affect HCV infectivity. This could be a con-servative assumption as some studies suggest HCV viral loads are elevated among individuals on ART.26Last, we did not consider the impact of ART in Vancouver for more recent years8,36,37because this was not the primary aim of our analysis. It is likely that ART has had more impact since 2007, as has been considered in other recent model-ling,64 because the coverage of ART, retention and viral suppression are now much higher.8,36,37
Other evidence
The impact of HIV treatment as prevention among PWIDs has been considered in other modelling analyses,65–69
including Vancouver64. Despite limited evidence, these analyses a priori assumed that ART had moderate to high efficacy for preventing parenteral HIV transmission.64 Through modelling competing hypotheses for why HIV in-cidence decreased in Vancouver, we estimate the potential effectiveness of treatment as prevention among PWID in a specific setting, and test the robustness of findings from earlier analyses.
Conclusions
Reducing HIV and HCV transmission among PWID re-mains a critical goal. The considerable (>75%) reductions in HCV and HIV incidence that occurred among PWID in Vancouver represents a remarkable success for intensive harm reduction interventions. Although ART is undoubt-edly important for reducing HIV morbidity and mortal-ity,70 our analyses suggest that it may not have substantially reduced HIV transmission among PWID in Vancouver over this period. As with all modelling, our analysis cannot replace empirical evidence, but the insights obtained do give alternative hypotheses for why HIV inci-dence declined. This does not diminish the potential for HIV treatment as prevention among PWID, but rather sug-gests that further studies are needed to determine its benefits.54
Supplementary Data
Supplementary dataare available atIJEonline.
Funding
Authors acknowledge support from the NIHR Health Protection Research Unit on Intervention Evaluation, the National Institute for Drug Abuse [grant number R01 DA037773-01A1] and the University of California San Diego Center for AIDS Research(CFAR), a National Institute of Health (NIH)-funded pro-gramme [grant number P30 AI036214]. P.V. also acknowledges support from the Bill and Melinda Gates-funded HIV Modelling Consortium. Role of funding body: none.
Author contributions
P.V. developed the initial research question. P.V. and N.K.M. developed the initial analysis plan. C.M. de-veloped the model and undertook initial modelling ana-lyses, which were then adapted and finalized by H.F. P.V. wrote the initial draft manuscript with C.M. and N.K.M. All authors contributed to the analysis concept and gave in-depth comments on the analyses undertaken and the manuscript. All authors have full access to all data from the study.
Conflict of interest: N.K.M. has received unrestricted re-search grants from Gilead unrelated to this work, and hono-raria from Gilead, AbbVie and Merck. All authors declare: no further support from any organization for the submitted work; no financial relationships with any organizations that might have an interest in the submitted work in the previous 3 years;and no other relationships or activities that could appear to have influenced the submitted work.
References
1. Cohen MS, Chen YQ, McCauley Met al. Prevention of HIV-1 infection with early antiretroviral therapy. N Engl J Med 2011;365:493–505.
2. Anglemyer A, Horvath T, Rutherford G. Antiretroviral therapy for prevention of HIV transmission in HIV-discordant couples. JAMA2013;310:1619–20.
3. Rodger A, Cambiano V, Bruun Tet al.HIV Transmission Risk Through Condomless Sex if the HIV Positive Partner Is on Suppressive ART: PARTNER Study. Abstract 153LB. Boston, MA: Conference on Retroviruses and Opportunistic Infections (CROI), 2014.
4. Wood E, Kerr T, Marshall BDet al. Longitudinal community plasma HIV-1 RNA concentrations and incidence of HIV-1 among injecting drug users:prospective cohort study. BMJ 2009;338:b1649.
5. Grulich AE, Wilson DP. Is antiretroviral therapy modifying the HIV epidemic?.Lancet2010;376:1824; author reply: 1825. 6. Shelton JD, Cohen M, Barnhart M, Hallett T. Is antiretroviral
7. Smith MK, Powers KA, Muessig KE, Miller WC, Cohen MS. HIV treatment as prevention: the utility and limitations of ecolo-gical observation.PLoS Med2012;9:e1001260.
8. Nosyk B, Montaner JS, Colley Get al. The cascade of HIV care in British Columbia, Canada, 1996–2011: a population-based retrospective cohort study.Lancet Infect Dis2014;14:40–49. 9. Terrault NA, Dodge JL, Murphy ELet al. Sexual transmission of
hepatitis C virus among monogamous heterosexual couples: the HCV partners study.Hepatology2013;57:881–89.
10. Grebely J, Lima VD, Marshall BDet al. Declining incidence of hepatitis C virus infection among people who inject drugs in a Canadian setting, 1996–2012.PLoS One2014;9:e97726. 11. Patrick DM, Tyndall MW, Cornelisse PGet al. Incidence of
hepatitis C virus infection among injection drug users during an outbreak of HIV infection.CMAJ2001;165:889–95.
12. Urban Health Research Initiative of the British Columbia Centre for Excellence in HIV/AIDS. Drug Situation in Vancouver. Vancouver: UHRI, 2009.
13. Tohme RA, Holmberg SD. Is sexual contact a major mode of hepatitis C virus transmission?.Hepatology2010;52:1497–505. 14. Vanhommerig JW, Lambers FA, Schinkel Jet al. Risk factors for
sexual transmission of hepatitis C virus among human immuno-deficiency virus-infected men who have sex with men: a case-control study.Open Forum Infect Dis2015;2:ofv115.
15. Smith DJ, Combellick J, Jordan AE, Hagan H. Hepatitis C virus (HCV) disease progression in people who inject drugs (PWID): A systematic review and meta-analysis. Int J Drug Policy 2015;26:911–21.
16. Thein HH, Yi Q, Dore GJ, Krahn MD. Estimation of stage-specific fibrosis progression rates in chronic hepatitis C virus in-fection: a meta-analysis and meta-regression. Hepatology 2008;48:418–31.
17. Thein HH, Yi Q, Dore GJ, Krahn MD. Natural history of hepa-titis C virus infection in HIV-infected individuals and the impact of HIV in the era of highly active antiretroviral therapy: a meta-analysis.AIDS2008;22:1979–91.
18. Pineda JA, Romero-Gomez M, Diaz-Garcia Fet al. HIV coinfec-tion shortens the survival of patients with hepatitis C virus-related decompensated cirrhosis.Hepatology2005;41:779–89. 19. Hayashi K, Milloy MJ, Wood E, Dong H, Montaner JS, Kerr T.
Predictors of liver-related death among people who inject drugs in Vancouver, Canada: a 15-year prospective cohort study.J Int AIDS Soc2014;17:19296.
20. Chen TY, Ding EL, Seage Iii GR, Kim AY. Meta-analysis: increased mortality associated with hepatitis C in HIV-infected persons is unrelated to HIV disease progression.Clin Infect Dis 2009;49:1605–15.
21. Klein MB, Lalonde RG, Suissa S. The impact of hepatitis C virus coinfection on HIV progression before and after highly active antiretroviral therapy. J Acquir Immune Defic Syndr 2003; 33:365–72.
22. Chung RT, Evans SR, Yang Yet al. Immune recovery is associ-ated with persistent rise in hepatitis C virus RNA, infrequent liver test flares, and is not impaired by hepatitis C virus in co-infected subjects.AIDS2002;16:1915–23.
23. Law WP, Duncombe CJ, Mahanontharit Aet al. Impact of viral hepatitis co-infection on response to antiretroviral therapy and HIV disease progression in the HIV-NAT cohort. AIDS 2004;18:1169–77.
24. Melvin DC, Lee JK, Belsey E, Arnold J, Murphy RL. The impact of co-infection with hepatitis C virus and HIV on the tolerability of antiretroviral therapy.AIDS2000;14:463–65.
25. Sulkowski MS, Moore RD, Mehta SH, Chaisson RE, Thomas DL. Hepatitis C and progression of HIV disease. JAMA 2002;288:199–206.
26. Gadalla SM, Preiss LR, Eyster ME, Goedert JJ. Correlates of high hepatitis C virus RNA load in a cohort of HIV-negative and HIV-positive individuals with haemophilia. J Viral Hepat 2011;18:161–69.
27. Witt MD, Seaberg EC, Darilay A et al. Incident hepatitis C virus infection in men who have sex with men: a prospective cohort analysis, 1984–2011.Clin Infect Dis2013; 57:77–84.
28. Wandeler G, Gsponer T, Bregenzer Aet al. Hepatitis C virus in-fections in the Swiss HIV Cohort Study: a rapidly evolving epi-demic.Clin Infect Dis2012;55:1408–16.
29. Clausen LN, Weis N, Schonning Ket al. Correlates of spontan-eous clearance of hepatitis C virus in a Danish human immuno-deficiency virus type 1 cohort. Scand J Infect Dis 2011; 43:798–803.
30. Seaberg EC, Witt MD, Jacobson LPet al. Spontaneous clearance of the hepatitis C virus among men who have sex with men.Clin Infect Dis2015;61:1381–88.
31. Thomson EC, Fleming VM, Main Jet al. Predicting spontaneous clearance of acute hepatitis C virus in a large cohort of HIV-1-infected men.Gut2011;60:837–45.
32. Nosyk B, Lourenco L, Min JEet al. Characterizing retention in HAART as a recurrent event process: insights into ‘cascade churn’.AIDS2015;29:1681–89.
33. Kerr T, Marshall BD, Milloy MJet al. Patterns of heroin and co-caine injection and plasma HIV-1 RNA suppression among a long-term cohort of injection drug users.Drug Alcohol Depend 2012;124:108–12.
34. Strathdee SA, Palepu A, Cornelisse PGet al. Barriers to use of free antiretroviral therapy in injection drug users. JAMA 1998;280:547–49.
35. Hogg RS, Heath K, Lima VDet al. Disparities in the burden of HIV/AIDS in Canada.PLoS One2012;7:e47260.
36. Milloy MJ, Wood E, Kerr Tet al. Increased prevalence of con-trolled viremia and decreased rates of HIV drug resistance among HIV-positive people who use illicit drugs during a community-wide treatment-as-prevention initiative.Clin Infect Dis2016;62:640–47.
37. Montaner JS, Lima VD, Harrigan PR et al. Expansion of HAART coverage is associated with sustained decreases in HIV/ AIDS morbidity, mortality and HIV transmission: the ‘HIV Treatment as Prevention’ experience in a Canadian setting.PLoS One2014;9:e87872.
38. Kerr T, Small W, Buchner Cet al. Syringe sharing and HIV inci-dence among injection drug users and increased access to sterile syringes.Am J Public Health2010;100:1449–53.
39. Kerr T, Stoltz J, Strathdee Set al. The impact of sex partners’ HIV status on HIV seroconversion in a prospective cohort of in-jection drug users. J Acquir Immune Defic Syndr 2006; 41:119–23.
41. Craib KJ, Spittal PM, Wood Eet al. Risk factors for elevated HIV incidence among Aboriginal injection drug users in Vancouver.CMAJ2003;168:19–24.
42. O’Connell JM, Kerr T, Li Ket al. Requiring help injecting inde-pendently predicts incident HIV infection among injection drug users.J Acquir Immune Defic Syndr2005;40:83–88.
43. Corneil TA, Kuyper LM, Shoveller Jet al. Unstable housing, associated risk behaviour, and increased risk for HIV infection among injection drug users.Health Place2006;12:79–85. 44. Wood E, Li K, Miller CLet al. Baseline self-perceived risk of
HIV infection independently predicts the rate of HIV seroconver-sion in a prospective cohort of injection drug users. Int J Epidemiol2005;34:152–58.
45. Miller CL, Strathdee SA, Spittal PMet al. Elevated rates of HIV infection among young Aboriginal injection drug users in a Canadian setting.Harm Red J2006;3:9.
46. Miller CL, Tyndall M, Spittal P, Li K, LaLiberte N, Schechter MT. HIV incidence and associated risk factors among young in-jection drug users.AIDS2002;16:491–93.
47. Tyndall MW, Currie S, Spittal Pet al. Intensive injection cocaine use as the primary risk factor in the Vancouver HIV-1 epidemic. AIDS2003;17:887–93.
48. DeBeck K, Kerr T, Li Ket al. Smoking of crack cocaine as a risk factor for HIV infection among people who use injection drugs. CMAJ2009;181:585–89.
49. Wood E, Lloyd-Smith E, Li Ket al. Frequent needle exchange use and HIV incidence in Vancouver, Canada. Am J Med 2007;120:172–79.
50. Miller CL, Strathdee SA, Spittal PMet al. Elevated rates of HIV infection among young Aboriginal injection drug users in a Canadian setting.Harm Red J2006;3:9.
51. Wood E, Montaner JS, Li K et al. Burden of HIV infection among aboriginal injection drug users in Vancouver, British Columbia.Am J Public Health2008;98:515–19.
52. Micallef JM, Kaldor J, Dore GJ. Spontaneous viral clearance fol-lowing acute hepatitis C infection: a systematic review of longi-tudinal studies.J Viral Hepat2006;13:34–41.
53. Briggs A, Claxton K, Sculpher M.Decision Modelling for Health Economic Evaluation. Oxford, UK: Oxford University Press, 2006. 54. Cohen MS, Smith MK, Muessig KE, Hallett TB, Powers KA, Kashuba AD. Antiretroviral treatment of HIV-1 prevents trans-mission of HIV-1: where do we go from here?Lancet 2013; 382:1515–24.
55. Montaner JS, Lima VD, Barrios Ret al. Association of highly ac-tive antiretroviral therapy coverage, population viral load, and yearly new HIV diagnoses in British Columbia, Canada: a population-based study.Lancet2010;376:532–39.
56. de Vos AS, van der Helm JJ, Matser A, Prins M, Kretzschmar ME. Decline in incidence of HIV and hepatitis C virus infection among injecting drug users in Amsterdam; evidence for harm re-duction?.Addiction2013;108:1070–81.
57. Hadland SE, DeBeck K, Kerr T, Feng C, Montaner JS, Wood E. Prescription opioid injection and risk of hepatitis C in relation to traditional drugs of misuse in a prospective cohort of street youth.BMJ Open2014;4:e005419.
58. Braitstein P, Asselin JJ, Schilder Aet al. Sexual violence among two populations of men at high risk of HIV infection.AIDS Care 2006;18:681–89.
59. Tyndall MW, Patrick D, Spittal P, Li K, O’Shaughnessy MV, Schechter MT. Risky sexual behaviours among injection drugs users with high HIV prevalence: implications for STD control. Sex Transm Infect2002;78(Suppl 1):i170–75.
60. Vanhommerig JW, Stolte IG, Lambers FAet al. Stabilizing inci-dence of hepatitis C virus infection among men who have sex with men in Amsterdam. J Acquir Immune Defic Syndr 2014;66:e111–15.
61. Nolan S, Dias Lima V, Fairbairn Net al. The impact of metha-done maintenance therapy on hepatitis C incidence among illicit drug users.Addiction2014;109:2053–59.
62. Kim C, Kerr T, Li Ket al. Unstable housing and hepatitis C inci-dence among injection drug users in a Canadian setting.BMC Public Health2009;9:270.
63. Ahamad K, Hayashi K, Nguyen Pet al. Effect of low-threshold methadone maintenance therapy for people who inject drugs on HIV incidence in Vancouver, BC, Canada: an observational co-hort study.Lancet HIV2015;2:e445–50.
64. Nosyk B, Min JE, Lima VD, Hogg RS, Montaner JS; group SHAs. Cost-effectiveness of population-level expansion of highly active antiretroviral treatment for HIV in British Columbia, Canada: a modelling study. Lancet HIV 2015;2: e393–400.
65. Alistar SS, Owens DK, Brandeau ML. Effectiveness and cost ef-fectiveness of expanding harm reduction and antiretroviral ther-apy in a mixed HIV epidemic: a modeling analysis for Ukraine. PLoS Med2011;8:e1000423.
66. Degenhardt L, Mathers B, Vickerman P, Rhodes T, Latkin C, Hickman M. Prevention of HIV infection for people who inject drugs: why individual, structural, and combination approaches are needed.Lancet2010;376:285–301.
67. Long EF, Brandeau ML, Galvin CMet al. Effectiveness and cost-effectiveness of strategies to expand antiretroviral therapy in St. Petersburg, Russia.AIDS2006;20:2207–15.
68. Strathdee SA, Hallett TB, Bobrova Net al. HIV and risk environ-ment for injecting drug users: the past, present, and future. Lancet2010;376:268–84.
69. Vickerman P, Platt L, Jolley E, Rhodes T, Kazatchkine MD, Latypov A. Controlling HIV among people who inject drugs in Eastern Europe and Central Asia: insights from modeling.Int J Drug Policy2014;25:1163–73.
70. Muga R, Langohr K, Tor Jet al. Survival of HIV-infected injec-tion drug users (IDUs) in the highly active antiretroviral therapy era, relative to sex- and age-specific survival of HIV-uninfected IDUs.Clin Infect Dis2007;45:370–76.
71. Cohen MS, Dye C, Fraser C, Miller WC, Powers KA, Williams BG. HIV treatment as prevention: debate and commentary – will early infection compromise treatment-as-prevention strategies? PLoS Med2012;9:e1001232.
72. Prins M, Hernandez Aguado IH, Brettle RPet al. Pre-AIDS mor-tality from natural causes associated with HIV disease progres-sion: evidence from the European Seroconverter Study among injecting drug users.AIDS1997;11:1747–56.
74. Krentz HB, Kliewer G, Gill MJ. Changing mortality rates and causes of death for HIV-infected individuals living in Southern Alberta, Canada from 1984 to 2003.HIV Med2005;6:99–106. 75. Vickerman P, Platt L, Hawkes S. Modelling the transmission of HIV
and HCV among injecting drug users in Rawalpindi, a low HCV prevalence setting in Pakistan.Sex Transm Infect2009;85:ii23–ii30. 76. Martin NK, Vickerman P, Grebely Jet al. HCV treatment for prevention among people who inject drugs: Modeling treatment scale-up in the age of direct-acting antivirals. Hepatology 2013;58:1593–609.
77. Mills HL, Colijn C, Vickerman P, Leslie D, Hope V, Hickman M. Respondent driven sampling and community structure in a population of injecting drug users, Bristol, UK.Drug Alcohol Depend2012;126:324–32.
78. Wood E, Hogg RS, Lima VDet al. Highly active antiretroviral therapy and survival in HIV-infected injection drug users.JAMA 2008;300:550–54.