RECEIVED2 October 2015 REVISED2 December 2015 ACCEPTED8 December 2015 PUBLISHED ONLINE FIRST23 April 2016
An efficient approach for surveillance of
childhood diabetes by type derived from
electronic health record data: the SEARCH
for Diabetes in Youth Study
Victor W Zhong,1Jihad S Obeid,2Jean B Craig,2Emily R Pfaff,3Joan Thomas,1Lindsay M Jaacks,4Daniel P Beavers,5 Timothy S Carey,6Jean M Lawrence,7Dana Dabelea,8Richard F Hamman,8Deborah A Bowlby,9Catherine Pihoker,10 Sharon H Saydah,11and Elizabeth J Mayer-Davis1,12
ABSTRACT
...
ObjectiveTo develop an efficient surveillance approach for childhood diabetes by type across 2 large US health care systems, using phenotyping algorithms derived from electronic health record (EHR) data.
Materials and MethodsPresumptive diabetes cases<20 years of age from 2 large independent health care systems were identified as those having1 of the 5 indicators in the past 3.5 years, including elevated HbA1c, elevated blood glucose, diabetes-related billing codes, patient prob-lem list, and outpatient anti-diabetic medications. EHRs of all the presumptive cases were manually reviewed, and true diabetes status and diabe-tes type were determined. Algorithms for identifying diabediabe-tes cases overall and classifying diabediabe-tes type were either prespecified or derived from classification and regression tree analysis. Surveillance approach was developed based on the best algorithms identified.
ResultsWe developed a stepwise surveillance approach using billing code–based prespecified algorithms and targeted manual EHR review, which efficiently and accurately ascertained and classified diabetes cases by type, in both health care systems. The sensitivity and positive predictive val-ues in both systems were approximately90% for ascertaining diabetes cases overall and classifying cases with type 1 or type 2 diabetes. About 80% of the cases with “other” type were also correctly classified. This stepwise surveillance approach resulted in a>70% reduction in the num-ber of cases requiring manual validation compared to traditional surveillance methods.
ConclusionEHR data may be used to establish an efficient approach for large-scale surveillance for childhood diabetes by type, although some manual effort is still needed.
...
Keywords: automated algorithm, ascertainment and classification, childhood diabetes, electronic health records, surveillance
BACKGROUND AND SIGNIFICANCE
Large population-based registries, including the SEARCH for Diabetes in Youth (SEARCH) study1and others,2,3have provided critical data for surveillance of diabetes among US children and adolescents. Increasing trends in the prevalence of both type 1 and type 2 diabetes and in the incidence of type 1 diabetes have been documented.1,2,4–6 However, such surveillance systems are resource intensive and are associated with considerable delays in reporting results.7A more effi-cient surveillance system is needed for sustained monitoring of the incidence and prevalence of childhood diabetes, so as to inform health care needs for this growing population.
Many US healthcare systems have transitioned to the use of elec-tronic health records (EHRs).8An EHR-based surveillance system has the potential to substantially increase the quantity, breadth, and timeliness of data available to health care systems and health departments, and could be more efficient than traditional surveillance methods.9However, few US studies have reported EHR-derived algorithms and their performance in youth with diabetes.10,11No validation study has been done to assess the generalizability of these algorithms. Little is known about the utility of automated algorithms derived from EHR data for surveillance of childhood diabetes within or across health care systems.
Previously, automated algorithms for surveillance were prespeci-fied by manually manipulating the available EHR data elements.10,11
This approach does not maximize the potential of EHR data, and may be the reason that algorithms to ascertain type 2 diabetes in youth with reasonable sensitivity, specificity, and positive predictive value (PPV) have yet to be found.10,11The value of classification and regres-sion tree (CART) analysis in public health research has been recog-nized and emphasized, but infrequently used.12 The CART method makes no assumptions about the variable distributions or relationships and generates a graphical prediction tree of classification that is easy to visualize.13Therefore, CART analysis may be a useful tool for elec-tronically deriving algorithms for surveillance of diabetes in youth, in particular a type 2 diabetes algorithm.
OBJECTIVES
The objectives of this study were to: (i) determine if CART analysis yields EHR algorithms with reasonable sensitivity, specificity, and PPV for surveillance of childhood diabetes overall and by diabetes type compared to the prespecified simple algorithms; (ii) determine whether algorithms derived from one health care system have compa-rable performance in another independent health care system; (iii) as-sess whether algorithm performance differs by age or race; and (iv) develop an efficient approach for sustainable surveillance of childhood diabetes incorporating use of the derived EHR algorithms that would substantially reduce the need for review of individual medical records.
Correspondence to Elizabeth J Mayer-Davis, Department of Nutrition, School of Public Health, 245C Rosenau Hall, CB 7461, University of North Carolina at Chapel Hill, Chapel Hill, NC 27599-7461, USA; [email protected]; Tel: 919-966-7218; Fax: 919-966-7216. For numbered affiliations see end of article. Published by Oxford University Press on behalf of the American Medical Informatics Association 2016. This work is written by US Government employees and is in the public domain in the United States.
RESEARCH
AND
MATERIALS AND METHODS
We used EHR data from the Medical University of South Carolina (MUSC) and the University of North Carolina Health Care System (UNC). The cur-rent study was designed to specifically address surveillance of prevalent diabetes cases in youth receiving care within the healthcare systems. Preliminary results related to EHR data from UNC have been published.10
Description of 2 health care systems and data sources
MUSC and UNC are large not-for-profit integrated academic health care systems located in Charleston, South Carolina, and central North Carolina, respectively. They both provide health care for a broad range of patients, including those without insurance. MUSC is a 700-bed re-ferral and teaching facility, providing care for over 250 000 patients annually. With a central 800-bed tertiary care center, and through its network of primary care and specialty physician practices located in 5 counties, UNC cares for over 800 000 patients annually. This study was approved by the Institutional Review Boards at MUSC and UNC.
During the data collection period, MUSC used the Epic EHR system and UNC used a locally developed EHR system. EHR data in both health care systems included demographics, outpatient medication lists for prescriptions, a variety of notes entered by health care professionals, and laboratory test results. International Classification of Diseases, Ninth Revision, Clinical Modification (ICD-9-CM) codes were used at both locations for health services billing (ie, billing data). At MUSC, bill-ing data were incorporated into the EHRs, patient problem lists were not available, and medication data were not available until May 2012. At UNC, billing data were maintained and updated separately from the EHRs. “Full data” in this study were the data elements available in both health care systems, including billing data, outpatient anti-diabetes medication data, laboratory test results, and demographics.
Case identification and validation
The study population at MUSC included all children<20 years of age as of December 31, 2012, who were seen by a health care provider at least once for any reason between July 1, 2012, and December 31, 2012. At UNC, we included all children <20 years of age as of December 31, 2011, who were seen by a health care provider at least once for any reason in 2011.
The initial criteria used to identify presumptive diabetes cases from the study population at both health care systems were: (i)1 HbA1c
6.0% (42 mmol/mol); or (ii)2 random blood glucose200 mg/dL on different days or1 fasting blood glucose126 mg/dL; or (iii)1 patient problem list diabetes-related ICD-9-CM codes; or (iv)1 billing data diabetes-related ICD-9-CM codes; or (v)1 outpatient anti-diabetes medications, including insulin, glucagon, metformin, sulfonylurea, gluca-gon-like peptide-1 receptor agonists, thiazolidinediones, and other hypo-glycemic agents.10The following diabetes-related ICD-9-CM codes were used: 250.xx (diabetes mellitus), 775.1 (neonatal diabetes), 648.0x (diabetes in pregnancy, non-gestational), 357.2 (diabetic neuropathy), 362.0x (diabetic retinopathy), and 366.41 (diabetic cataract). We searched EHR data from July 1, 2009, to December 31, 2012, at MUSC, and from July 1, 2008, to December 31, 2011, at UNC for these 5 diabetes criteria. Patients meeting any of the 5 criteria were identified as presumptive dia-betes cases. The definition of presumptive diadia-betes cases was designed to be highly sensitive and thus children not identified as presumptive cases were assumed to not have diabetes (ie, true negatives).
True diabetes status and type were determined by the presence of a diabetes diagnosis in the EHR in 1 or more notes written by health care providers (gold standard), which is consistent with the SEARCH case validation protocol.14Reviewers at each of the 2 health care sys-tems were trained using the SEARCH standardized protocol by a
member of the SEARCH team (J.T.), who has over 10 years of experi-ence with the SEARCH case ascertainment protocol. More details of the case validation processes can be found elsewhere.10
Criteria for evaluating algorithms’ performance
Attributes critical for a disease surveillance system recommended by the Centers for Disease Control and Prevention include simplicity, time-liness, high sensitivity, and high PPV.15High sensitivity is crucial for identifying most of the diabetes cases. High PPV is preferred in order to reduce the number of false positives. For surveillance of childhood dia-betes, high specificity is important for differentiating between diabetes types and also critical to yield high PPV. A promising algorithm for sur-veillance should yield a sensitivity, specificity, and PPV90%.10In this report, specificity was only shown in the results when evaluating the type 1 and type 2 algorithms in true diabetes cases, because we aimed to conduct population surveillance so specificity would be consistently
>90% due to the low prevalence of diabetes in children.
Statistical Analysis
The characteristics of the study population, presumptive cases and true cases, were described. We evaluated the performance of the pre-specified algorithms for identifying diabetes cases regardless of type, then by type 1 or type 2 diabetes cases in both health care systems. Those pre-specified algorithms were created based on clinical knowl-edge and were previously published.10Next, we assessed the perfor-mance of CART algorithms within and between health care systems. Specifically, we performed CART analysis on the data from MUSC (training dataset) and then applied the derived algorithms from the training dataset to UNC data (validation dataset) and vice versa. The CART analysis recursively identified classifiers that efficiently seg-mented the sample into mutually exclusive subgroups (eg, diabetes and not diabetes, or type 1 and type 2 diabetes).13There was a com-plexity parameter tuned by a 10-fold cross-validation procedure to control the depth of the generated tree (ie, to avoid over-fitting). We searched over a prespecified finite set of complexity levels to select the best complexity parameter that minimized the cross-validation er-ror. This parameter was used to replicate the same prediction tree (ie, derived algorithm) from the training dataset in the validation data-set. The variables used for CART analysis were coded and processed identically between the 2 health care systems (Appendix, Table 1).
The performance of the algorithms for identifying diabetes cases regardless of type was evaluated within the total study population. The performance of type 1 or type 2 algorithms was evaluated within the true cases.10,11We also evaluated whether algorithm performance dif-fered by age (<10 years versus 10–19 years) or race (white versus non-white). Only 2.3% of the total type 2 cases were<10 years of age, so the performance was not calculated for this younger group.
Finally, a stepwise surveillance approach was developed with the goal of improving efficiency of the process by employing the top-performing algorithms in order to minimize the manual validation efforts and maintain accuracy. The top-performing diabetes type– specific algorithms used for this approach should have90% sensi-tivity, specificity, and PPV.10In practice, our approach would assume that the individuals ascertained by the best top-performing type 1 or type 2 algorithm were true type 1 or type 2 cases, respectively, with-out manual validation of each case against medical records. For the remaining cases who were not selected by the best algorithms, man-ual medical record review would be conducted. To evaluate this approach, we considered sensitivity and PPV based on the gold stan-dard. Also, the number and percentage of medical records that required manual review were calculated as a marker of efficiency.
RESEARCH
AND
CART analysis was performed using therpartpackage and R sta-tistical software package, version 3.0.2.16Other analyses were per-formed using SAS version 9.3 (SAS Institute, Cary, NC, USA).
RESULTS
At MUSC, we identified 1055 presumptive cases from 43 511 children
<20 years of age with at least 1 health care visit between July 1 and December 31, 2012 (Table 1). Based on the manual medical record review of presumptive cases (gold standard), 660 (62.6%) true cases (483 type 1, 129 type 2, and 48 other types) were ascertained. At UNC, the initial algorithm identified 1289 presumptive diabetes cases from 57 767 children<20 years of age with at least 1 health care visit in 2011.10Of those, 537 (41.7%) were true cases (405 type 1, 86 type 2, and 46 other diabetes types).
Performance of the prespecified algorithms in 2 health care systems
Identifying diabetes cases regardless of diabetes type
Billing data had similar performance overall and within age or racial sub-groups between the 2 health care systems (Appendix, Tables 2and3). The sensitivity and PPV of billing data were 97.9% and 81.6%, respec-tively, in MUSC and were 97.0% and 82.2%, respecrespec-tively, in UNC.10 Outpatient medications at MUSC had a low sensitivity of 12.7%, com-pared to a sensitivity of 88.5% at UNC. The algorithm in which2 crite-ria were met approximately satisfied our prespecified 90% critecrite-ria in both health care systems. The algorithm in which1 criteria were met had poor PPV in both systems (62.6% and 41.7% at MUSC and UNC, re-spectively). Among age and racial subgroups, in both systems, the PPV of the glucose criterion or billing data was much lower in youth<10
Table 1: Demographic and clinical characteristics of the total study population, presumptive diabetes cases, and true diabetes cases at MUSC in 2012 and at UNC in 2011
Characteristics Study population Presumptive casesa True diabetes cases Type 1 cases Type 2 cases Other casesb
MUSC UNCc MUSC UNCc MUSC UNCc MUSC UNCc MUSC UNCc MUSC UNCc
All, n 43 511 57 767 1055 1289 660 537 483 405 129 86 48 46
Female, % 51.5 48.1 52.3 52.7 52.7 55.7 48.0 54.8 72.9 60.5 45.8 54.3
Age (years)d, %
0–4.9 35.3 36.3 11.4 26.9 2.3 2.8 2.9 3.2 0 0 2.1 4.3
5.0–9.9 24.8 22.2 13.7 12.1 13.5 12.5 16.6 15.6 2.3 2.3 12.5 4.3
10.0–14.9 20.8 19.8 34.1 24.0 37.3 32.6 39.5 34.6 32.6 34.9 27.1 10.9
15.0–17.9 12.1 12.7 26.1 22.0 31.2 30.2 27.7 26.4 41.1 37.2 39.6 50.0
18.0–19.9 7.1 9.0 14.7 15.0 15.8 22.0 13.3 20.3 24.0 25.6 18.8 30.4
Mean age, years (SD)
8.0 (5.9) 8.6 (6.2) 12.3 (5.1) 11.0 (6.5) 13.6 (3.9) 14.4 (4.1) 13.1 (4.0) 13.9 (4.3) 15.2 (2.7) 15.8 (2.6) 14.1 (3.8) 16.0 (3.7)
Age at diagnosis, years (SD)
9.3 (4.3) 8.8 (4.6) 8.0 (4.0) 7.9 (4.3) 13.0 (2.7) 12.9 (2.3) 12.2 (3.9) 12.8 (5.3)
Racee, %
White 49.3 48.5 51.7 53.0 59.6 61.6 72.7 67.9 13.2 32.6 52.1 60.9
Black 37.0 21.0 42.7 29.0 35.8 25.5 22.2 19.8 83.7 50.0 43.8 30.4
Other/unknown/ missing
13.7 30.5 5.7 18.0 4.7 12.9 5.2 12.3 3.1 17.4 4.2 8.7
Health insurance type, %
Private 39.2 43.2 40.0 40.1 48.2 50.8 57.8 55.3 21.7 27.9 22.9 54.3
Government 52.5 42.4 48.0 47.6 38.8 34.1 29.4 29.1 66.7 57.0 58.3 34.8
Tricaref 5.0 8.3 4.1 9.1 4.9 11.0 5.4 12.1 1.6 5.8 8.3 10.9
Not insured/ missing/other
3.4 6.2 8.0 3.3 8.2 4.1 7.5 3.5 10.1 9.3 10.4 0
Abbreviations: MUSC: Medical University of South Carolina; SD: standard deviation; UNC: University of North Carolina.
a
Presumptive cases were individuals with1 of these criteria:1 HbA1c6.0% (42 mmol/mol); or2 random blood glucose200 mg/dL on different days; or1 fasting blood glucose126 mg/dL; or1 patient problem list diabetes-related ICD-9-CM codes; or1 billing data diabe-tes-related ICD-9-CM codes; or1 diabetes-related outpatient medications, including insulin, glucagon, metformin, sulfonylurea, glucagon-like peptide-1 receptor agonists, thiazolidinediones, and other hypoglycemic agents.
b
At MUSC: “Other” cases included 6 cases of maturity onset diabetes of the young (MODY) and 42 secondary diabetes cases, mostly steroid in-duced or CF-related. At UNC: “Other” cases included 25 secondary diabetes cases, 2 MODY cases, and 19 diabetes type-unspecified cases.
c
The UNC data were previously published,10but the presumptive cases here did not include those captured by inpatient medications.
d
At MUSC: Age was calculated as of December 31, 2012. At UNC: Age was calculated as of December 31, 2011.j
eEthnicity data were missing for about 98% of the patients at MUSC, so we were only able to categorize race. f
Military health insurance plan.
RESEARCH
AND
years of age than in the older youth. HbA1c had higher PPV among white youth than youth with non-white racial backgrounds.
Type 1 algorithms
All type 1 algorithms performed very similarly between the 2 health care systems (Table 2). The 2 best type 1 algorithms were the ratio of type 1 codes to the sum of type 1 and type 2 codes 0.5 or 0.6. When the ratio was0.6, the sensitivity, specificity, and PPV were 97.7%, 94.9%, and 98.1%, respectively, at MUSC, and 93.3%, 96.2%, and 98.7%, respectively, at UNC. Age and racial differences were small, except that the specificity of these best 2 algorithms was
<90% in youth<10 years of age and in white youth (Table 3).
Type 2 algorithms
For both health care systems, none of the type 2 algorithms evaluated had a sensitivity, specificity, and PPV approaching 90%; the highest PPV was 75.5% (Table 2). The ratio of type 2 codes to the sum of type 1 and type 2 codes0.4 or 0.5 or 0.6 had similar performance within the health care systems, although the PPV was higher at MUSC than at UNC. The PPV was considerably higher among youth with non-white racial backgrounds in both health care systems (Table 3). Among the non-white subgroup, the sensitivity, specificity, and PPV of the ratio of type 2 codes to the sum of type 1 and type 2 codes 0.6 were 89.3%, 87.7%, and 84.0%, respectively, at MUSC, and 89.7%, 91.2%, and 80.0%, respectively, at UNC.
Performance of CART algorithms in 2 health care systems
Using billing data only
For algorithms used for identifying diabetes cases regardless of type, most CART algorithms were close to the prespecified 90% criteria and the algorithms had similar performance between health care systems. Only small differences were observed between age and racial sub-groups (Appendix, Table 4). Type 1 algorithms derived from CART analysis were not superior to the prespecified type 1 algorithms. The performance of type 2 algorithms was also not improved by using the CART method relative to the prespecified method.
Using full data
The billing data only based algorithms for identifying diabetes cases without regard to type, and type 1 algorithms were not improved upon by adding additional data elements. For type 2 algorithms, use of full data compared to use of billing data alone improved PPV from 58.3% to 80.6% and decreased sensitivity from 93.1% to 80.1% at UNC; use of full data improved PPV from 70.3% to 81.9% and decreased sensi-tivity from 96.0% to 91.4% at MUSC. The type 2 algorithm had a sen-sitivity of 91.4%, specificity of 95.1%, and PPV of 81.9% at MUSC (Appendix, Figure 1; results inAppendix, Table 4) and had a sensitivity of 80.1%, specificity of 96.3%, and PPV of 80.6% at UNC (Appendix, Figure 2; results inAppendix, Table 4).
A stepwise surveillance approach
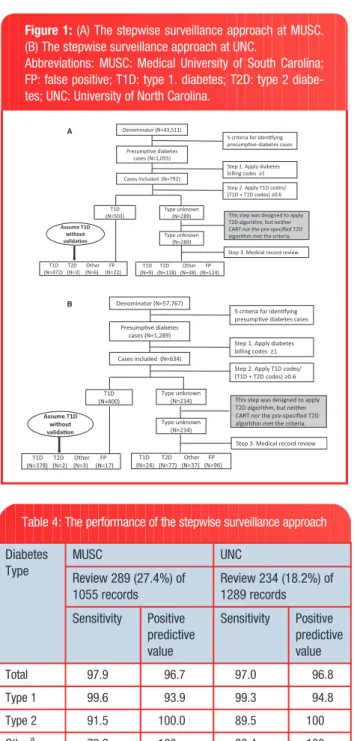
An identical stepwise surveillance approach was used in both health care systems, which began with identifying presumptive cases (Figures 1A and1B). The steps were: (i) applying1 billing codes; (ii) applying the best prespecified type 1 algorithm (ie, the ratio of type 1 codes to the sum of type 1 and type 2 codes0.6); the following step was orig-inally designed to apply the best type 2 algorithm with90% sensitiv-ity, specificsensitiv-ity, and PPV, but neither CART nor the prespecified type 2 algorithm met the 90% criterion; (iii) reviewing the medical records of the remaining cases that were not classified by the previous steps; and (iv) evaluating the performance of the stepwise surveillance approach.
Using this approach, 289 (27.4%) of the 1055 medical records at MUSC (Table 4) and 234 (18.2%) of the 1289 records at UNC required manual review. The sensitivity and PPV were close to or greater than 95% for identifying total diabetes cases and type 1 cases in both health care systems. For type 2 diabetes, the sensitivity was approxi-mately 90% in both systems and PPV was 100.0%. This approach also classified cases of other diabetes types with a sensitivity of nearly 80% and PPV of 100%.
DISCUSSION
In both health care systems, we found that using billing data alone in the prespecified algorithms was the most efficient for diabetes case identification overall and for type 1 case classification. Billing data– based prespecified type 1 algorithms met our criteria for surveillance, and additional data including medication and laboratory data did not improve the prespecified type 1 algorithms. CART type 1 algorithms were not superior to the prespecified type 1 algorithms. For type 2 dia-betes identification, the additional EHR data provided only a small im-provement. However, neither CART nor the prespecified type 2 algorithms reached our 90% criteria for surveillance. We developed a stepwise surveillance approach using a combination of billing data– based prespecified algorithms and targeted manual review of EHRs that ascertained and classified diabetes cases efficiently and accu-rately in both health care systems. This stepwise approach required much less manual effort (>70% reduction in EHR review) compared to traditional methods. The performance of the stepwise surveillance approach, billing data, and prespecified type 1 algorithms was similar between the 2 health care systems.
The stepwise surveillance approach proposed in this study ascer-tained and classified diabetes cases in youth accurately, with approxi-mately 90% or higher sensitivity and PPV for total diabetes cases, type 1 and type 2 cases; and efficiently, with a reduction of>70% in the number of cases requiring manual medical record review. Recent re-ports suggest that other types of diabetes, including drug-induced dia-betes and monogenic diadia-betes, are important components of childhood diabetes.17,18 Together with the increasing prevalence of type 2 diabetes,1they have altered the pediatric diabetes landscape. The stepwise surveillance approach also correctly classified most cases with other diabetes types (80%) in both health care systems.
Billing data was the most important source of data for surveillance with little gain from using additional EHR data. The sensitivity of billing data for ascertaining diabetes overall was97%. Also, billing data– based prespecified type 1 algorithms performed very well in both health care systems. For type 2 case classification, we previously found that adding medication data improved the PPV of the prespeci-fied type 2 algorithm, but the overall performance was not greatly im-proved.10Dart et al.19also reported that the addition of medication data did not substantially improve diabetes case identification, but their study was unable to differentiate diabetes types. In the current study, we employed CART analysis in an attempt to improve type 2 case classification. Within the health care systems, among total true cases, the type 2 algorithm was improved slightly, but it was still not sufficient for surveillance purposes.
Previous studies have identified the greater difficulty in classifying type 2 cases in youth.10,11,20,21At the current state of EHR develop-ment and use of the ICD-9-CM coding system, together with the very low prevalence of type 2 diabetes in youth,1relying solely on an auto-mated algorithm for type 2 case classification may not be possible. First, ICD-9-CM type 2 codes include “unspecified” diabetes (250.X0 or 250.X2 with X¼0–9), which has very poor accuracy (<20%) for classifying type 2 cases in children.21 A study found that few
RESEARCH
AND
“unspecified” diabetes codes were assigned by use of ICD-10-CM.22 However, more investigation is needed to determine the utility of ICD-10-CM codes for surveillance. Second, patients without diabetes may still be incorrectly assigned a type 2 code if they have cystic fibrosis– related diabetes, diabetes insipidus, or diabetes risk factors including insulin resistance, obesity, impaired glucose tolerance, etc.21 Third, type 2 codes may be misused for other forms of diabetes with less fa-miliar codes, for example, steroid-induced diabetes (251.8 and E932.0). In our study, the type 2 algorithms which identified most type 2 cases also identified most cases with drug-induced diabetes cases (data not shown). Fourth, in some patients, a clinical differentiation be-tween type 1 and type 2 diabetes is difficult at presentation with dia-betes in children,23if auto-antibodies and/or insulin sensitivity are not
measured.24Fifth, insulin is commonly used in children with type 2 di-abetes,25which limits the use of medication as an efficient type clas-sifier, though we did see small improvement with the inclusion of medication data for type 2 algorithms in CART analysis. Finally, coders at hospitals or practices may use “unspecified” type 2 codes if diag-noses are indicated as “diabetes” on the billing form.21Consequently, manual review of medical records may be necessary to classify type 2 cases accurately.It is critical to establish generalizability before a sur-veillance approach can be reliably implemented across health care systems. Our analyses indicated quite good agreement between 2 large independent health care systems. First, the proposed surveil-lance approach resulted in similar performance for estimating the number of total diabetes cases, type 1, type 2, and other types of
Table 2: Performance of the prespecified type 1 and type 2 algorithms by age applied to all true cases at MUSC and UNCa
Non-CART Diabetes Algorithms System Met Criteria (N) Sensitivity (%) Specificity (%) PPV (%)
Total <10 y 10 y Total <10 y 10 y Total <10 y 10 y Total <10 y 10 y
Type 1 Algorithms
1 type 1 codes MUSC 570 97 473 99.0 100.0 98.7 48.0 70.0 46.7 83.9 96.9 81.2
UNC 443 76 367 97.0 98.7 96.7 62.1 83.3 61.1 88.7 98.7 86.6
2 type 1 codes MUSC 537 94 443 96.7 97.9 96.4 60.5 80.0 59.3 87.0 97.9 84.7
UNC 415 76 339 93.6 98.7 92.4 72.7 83.3 72.2 91.3 98.7 89.7
0 type 2 codes and1 type 1 codes
MUSC 195 50 145 39.8 53.2 36.5 98.3 100.0 98.2 98.5 100.0 97.9
UNC 141 18 123 34.6 23.7 37.1 99.2 100.0 99.2 99.3 100.0 99.2
Ratio of type 1 codes to the sum of type 1 and type 2 codes0.3
MUSC 510 96 414 98.8 98.9 98.7 81.4 70.0 82.0 93.5 96.9 92.8
UNC 413 76 337 96.8 98.7 96.4 84.1 83.3 84.1 94.9 98.7 94.1
Ratio of type 1 codes to the sum of type 1 and type 2 codes0.4
MUSC 496 95 401 98.6 98.9 98.5 88.7 80.0 89.2 96.0 97.9 95.5
UNC 402 76 326 96.3 98.7 95.7 90.9 83.3 91.3 97.0 98.7 96.6
Ratio of type 1 codes to the sum of type 1 and type 2 codes0.5
MUSC 490 95 395 98.6 98.9 98.5 92.1 80.0 92.8 97.1 97.9 97.0
UNC 397 76 321 95.6 98.7 94.8 92.4 83.3 92.9 97.5 98.7 97.2
Ratio of type 1 codes to the sum of type 1 and type 2 codes0.6
MUSC 481 95 386 97.7 98.9 97.4 94.9 80.0 95.8 98.1 97.9 98.2
UNC 383 75 308 93.3 97.4 92.4 96.2 83.3 96.8 98.7 98.7 98.7
Type 2 Algorithms
1 type 2 codes MUSC 451 50 401 93.0 N/A 94.4 37.7 N/A 34.4 26.6 N/A 29.7
UNC 375 62 313 91.9 N/A 92.9 34.4 N/A 36.7 21.1 N/A 24.9
2 type 2 codes MUSC 316 33 283 83.7 N/A 85.7 60.8 N/A 59.3 34.2 N/A 38.2
UNC 256 31 225 82.6 N/A 83.3 59.0 N/A 58.2 27.7 N/A 31.0
1 type 2 codes and 0 type 1 codes MUSC 76 3 73 41.9 N/A 42.1 95.9 N/A 95.3 71.1 N/A 72.6
UNC 73 4 69 54.7 N/A 54.8 94.2 N/A 93.8 64.4 N/A 66.7
Ratio of type 2 codes to the sum of type 1 and type 2 codes0.3
MUSC 181 8 173 93.0 N/A 94.4 88.5 N/A 87.4 66.3 N/A 68.8
UNC 151 10 141 91.9 N/A 92.9 84.0 N/A 83.0 52.3 N/A 55.3
Ratio of type 2 codes to the sum of type 1 and type 2 codes0.4
MUSC 168 7 161 91.5 N/A 92.9 90.6 N/A 89.8 70.2 N/A 72.7
UNC 138 6 132 91.9 N/A 92.9 86.9 N/A 85.4 57.2 N/A 59.1
Ratio of type 2 codes to the sum of type 1 and type 2 codes0.5
MUSC 164 5 159 91.5 N/A 92.9 91.3 N/A 90.2 72.0 N/A 73.6
UNC 128 4 124 88.4 N/A 89.3 88.5 N/A 86.8 59.4 N/A 60.5
Ratio of type 2 codes to the sum of type 1 and type 2 codes0.6
MUSC 151 5 146 88.4 N/A 89.7 93.0 N/A 92.3 75.5 N/A 77.4
UNC 116 4 112 84.9 N/A 85.7 90.5 N/A 89.2 62.9 N/A 64.3
True diabetes cases (N¼660 at MUSC and N¼537 at UNC) confirmed by medical record review established our “gold standard” for evaluation of the algorithms’ performance.
Abbreviations:MUSC: Medical University of South Carolina; PPV: positive predictive value; UNC: University of North Carolina; y, years.
aResults from UNC were previously published.10
RESEARCH
AND
diabetes cases, in both health care systems using identical prespeci-fied algorithms in each step. Second, billing data had comparable per-formance in both health care systems and billing data alone may help to establish an efficient surveillance system. Additionally, billing data are commonly available in health care systems. However, the 2 health care systems compared here covered similar youth populations in terms of age, gender, and insurance status, and were also similar in terms of type and amount of data captured and organization of health care delivery. It is not clear whether our stepwise approach will per-form similarly in different types of health care systems, such as inte-grated managed health care systems or the Indian Health Service.
Algorithms derived from CART analysis did not outperform the pre-specified algorithms. This does not imply that CART analysis is not a
useful tool. CART analysis has value in classifying other health prob-lems.26–28In the context of childhood diabetes, limitations were en-countered in the application of CART analysis, including limitations of the ICD-9-CM coding system, miscoding issues, overlap in treatment as described above, and incomplete data in the EHRs. Of note, CART analysis yielded more complicated algorithms and captured interac-tions that were hard to explain, leading to poor generalizability.
Limitations of this study should be noted. First, both health care systems are public academic health care delivery systems. In both systems, the EHR systems are evolving and imperfect. This character-istic is, in a sense, also a strength of our study in that we sought to evaluate our approach in the real world. Second, we assumed that in-dividuals who were not captured by the initial 5 criteria for identifying
Table 3: Performance of the prespecified type 1 and type 2 algorithms by race applied to all true cases at MUSC and UNCa
Non-CART Diabetes Algorithms System Met Criteria (N) Sensitivity (%) Specificity (%) PPV (%)
Total white Other Total White Other Total white Other Total white Other
Type 1 Algorithms
1 type 1 codes MUSC 570 366 204 99.0 99.4 97.7 48.0 59.5 44.4 83.9 95.4 63.2
UNC 443 288 155 97.0 97.1 96.9 62.1 62.5 61.8 88.7 92.7 81.3
2 type 1 codes MUSC 537 355 182 96.7 96.6 97.0 60.5 61.9 60.0 87.0 95.5 70.3
UNC 415 276 139 93.6 94.2 92.3 72.7 69.6 75.0 91.3 93.8 86.3
0 type 2 codes and1 type 1 codes MUSC 195 152 4 39.8 43.0 31.1 98.3 97.6 98.5 98.5 99.3 95.3
UNC 141 103 38 34.6 37.1 29.2 99.2 98.2 100.0 99.3 99.0 100.0
Ratio of type 1 codes to the sum of type 1 and type 2 codes0.3
MUSC 510 358 152 98.8 99.1 97.7 81.4 76.2 83.0 93.5 97.2 84.9
UNC 413 277 136 96.8 96.7 96.9 84.1 80.4 86.8 94.9 96.0 92.6
Ratio of type 1 codes to the sum of type 1 and type 2 codes0.4
MUSC 496 357 139 98.6 99.1 97.0 88.7 78.6 91.9 96.0 97.5 92.1
UNC 402 273 129 96.3 96.7 95.4 90.9 87.5 93.4 97.0 97.4 96.1
Ratio of type 1 codes to the sum of type 1 and type 2 codes0.5
MUSC 490 355 135 98.6 99.1 97.0 92.1 83.3 94.8 97.1 98.0 94.8
UNC 397 269 128 95.6 96.0 94.6 92.4 91.1 93.4 97.5 98.1 96.1
Ratio of type 1 codes to the sum of type 1 and type 2 codes0.6
MUSC 481 350 131 97.7 98.3 96.2 94.9 88.1 97.0 98.1 98.6 96.9
UNC 383 262 121 93.3 93.8 92.3 96.2 92.9 98.7 98.7 98.5 99.2
Type 2 Algorithms
1 type 2 codes MUSC 451 237 214 93.0 94.1 92.9 37.7 41.2 29.0 26.6 6.8 48.6
UNC 375 219 156 91.9 89.3 93.1 34.4 36.0 31.1 21.1 11.4 34.6
2 type 2 codes MUSC 316 140 176 83.7 64.7 86.6 60.8 65.7 49.0 34.2 7.9 55.1
UNC 256 133 123 82.6 82.1 82.8 59.0 63.7 49.3 27.7 17.3 39.0
1 type 2 codes and 0 type 1 codes MUSC 76 23 53 41.9 58.8 39.3 95.9 96.5 94.2 71.1 43.5 83.0
UNC 73 34 39 54.7 46.4 58.6 94.2 93.1 96.6 64.4 38.2 87.2
Ratio of type 2 codes to the sum of type 1 and type 2 codes0.3
MUSC 181 50 131 93.0 94.1 92.9 88.5 91.0 82.6 66.3 32.0 79.4
UNC 151 75 76 91.9 89.3 93.1 84.0 83.5 85.1 52.3 33.3 71.1
Ratio of type 2 codes to the sum of type 1 and type 2 codes0.4
MUSC 168 42 126 91.5 94.1 91.1 90.6 93.1 84.5 70.2 38.1 81.0
UNC 138 65 73 91.9 89.3 93.1 86.9 86.8 87.2 57.2 38.5 74.0
Ratio of type 2 codes to the sum of type 1 and type 2 codes0.5
MUSC 164 39 125 91.5 94.1 91.1 91.3 93.9 85.2 72.0 41.0 81.6
UNC 128 58 70 88.4 82.1 91.4 88.5 88.4 88.5 59.4 39.7 75.7
Ratio of type 2 codes to the sum of type 1 and type 2 codes0.6
MUSC 151 32 119 88.4 82.4 89.3 93.0 95.2 87.7 75.5 43.8 84.0
UNC 116 51 65 84.9 75.0 89.7 90.5 90.1 91.2 62.9 41.2 80.0
True diabetes cases (N¼660 at MUSC and N¼537 at UNC) confirmed by medical record review established our “gold standard” for evaluation of the algorithms’ performance. Abbreviations: MUSC: Medical University of South Carolina; PPV: positive predictive value; UNC: University of North Carolina.
aResults from UNC were previously published.10
RESEARCH
AND
presumptive cases were true negatives, which may have missed a small number of true cases. However, among those presumptive cases that had only 1 indicator of diabetes, the false positive rate was about 90% or higher; the false positive rate was further increased to 95% or higher among those who had 1 indicator other than billing codes (data not shown). Therefore, it is highly unlikely that our findings would be biased by the false negatives that we failed to find, given the low prevalence of diabetes in children. Finally, we ascertained and classified prevalent cases, not incident cases. In SEARCH, natural lan-guage processing is being evaluated to extract diagnosis dates from medical records with the aim of identifying incident cases, which was not in the scope of this analysis.
CONCLUSION
We used billing data and targeted manual medical record review to de-velop a stepwise surveillance approach which efficiently and accurately ascertained and classified prevalent diabetes cases in 2 large, indepen-dent US public health care delivery systems. This approach relied largely on automated algorithms and required only a small amount (<30%) of manual validation efforts compared to traditional surveillance methods. Further validation of the stepwise surveillance approach in other health care systems or in the same health care system at different time points may provide additional information before it can be widely implemented across the United States for surveillance of childhood diabetes.
FUNDING
Grant Support: SEARCH for Diabetes in Youth Study is funded by the Centers for Disease Control and Prevention (PA numbers 00097, DP-05-069, and DP-10-001) and supported by the National Institute of Diabetes and Digestive and Kidney Diseases. Contract numbers: Kaiser Permanente Southern California (U48/ CCU919219, U01-DP-000246, and U18-DP-002714), University of Colorado Denver (U48/CCU819241-3, U01-DP-000247, and U18-DP-000247-06A1), Children’s Hospital Medical Center (Cincinnati) (U48/CCU519239, U01-DP-000248, and 1U18-DP-002709), University of North Carolina at Chapel Hill (U48/ CCU419249, U01-DP-000254, and U18-DP-002708-01), University of Washington School of Medicine (U58/CCU019235-4, U01-DP-000244, and U18-DP-002710-01), and Wake Forest School of Medicine (U48/CCU919219, U01-DP-000250, and 200-2010-35171). The authors wish to acknowledge the in-volvement of Seattle Children’s Hospital (National Institutes of Health Clinical and Translational Science Awards grant UL1 TR00423 of the University of Washington); University of Colorado Pediatric Clinical and Translational Research Center (grant number UL1 TR000154); the Barbara Davis Center at the University of Colorado Denver (DERC NIH P30 DK57516); the National Center for Research Resources and the National Center for Advancing Translational Sciences, National Institutes of Health, through grant 8 UL1 TR000077; and the Children with Medical Handicaps program managed by the Ohio Department of Health. The MUSC effort was supported by the NIH – National Center for Advancing Translational Sciences: Grant Number UL1 TR000062.
COMPETING INTERESTS
V.W.Z. received financial support from the Sanofi Global Scholars Program. Other authors have no competing interests to declare.
CONTRIBUTORS
V.W.Z. participated in study design and coordination, reviewed medical records, analyzed data. and wrote the manuscript. E.J.M.-D. and J.S.O. conceived the study, participated in study design, reviewed and edited the manuscript, and con-tributed to discussion. J.B.C. and E.R.P. extracted and formatted the raw data from the data warehouse, reviewed and edited the manuscript, and contributed to discussion. J.T. participated in study design and coordination, trained medical record reviewers, validated the record review work, and reviewed and edited the manuscript. L.M.J. participated in study design and coordination, reviewed medi-cal records, reviewed and edited the manuscript, and contributed to discussion. D.P.B., T.S.C., J.M.L., D.D., R.F.H., D.A.B., C.P., and S.H.S. reviewed and edited the manuscript and contributed to discussion. E.J.M.-D. is the guarantor of this work and, as such, had full access to all the data in the study and takes responsi-bility for the integrity of the data and the accuracy of the data analysis.
ACKNOWLEDGEMENTS
The SEARCH for Diabetes in Youth study is indebted to the many youth and their families and their health care providers, whose participation made this study Figure 1:(A) The stepwise surveillance approach at MUSC.
(B) The stepwise surveillance approach at UNC.
Abbreviations: MUSC: Medical University of South Carolina; FP: false positive; T1D: type 1. diabetes; T2D: type 2 diabe-tes; UNC: University of North Carolina.
Denominator (N=57,767)
Presumpve diabetes cases (N=1,289)
Cases included (N=634)
T1D (N=400)
Type unknown (N=234)
Type unknown (N=234)
T1D T2D Other FP (N=24) (N=77) (N=37) (N=96) Assume T1D
without validaon
T1D T2D Other FP (N=378) (N=2) (N=3) (N=17)
5 criteria for idenfying presumpve diabetes cases
Step 1. Apply diabetes billing codes ≥1
Step 2. Apply T1D codes/ (T1D + T2D codes) ≥0.6
Step 3. Medical record review This step was designed to apply T2D algorithm, but neither CART nor the pre-specified T2D algorithm met the criteria. Denominator (N=43,511)
Presumpve diabetes cases (N=1,055)
Cases included (N=792)
T1D (N=503)
Type unknown (N=289)
Type unknown (N=289)
T1D T2D Other FP (N=9) (N=118) (N=38) (N=124)
Assume T1D without validaon
T1D T2D Other FP (N=472) (N=3) (N=6) (N=22)
5 criteria for idenfying presumpve diabetes cases
Step 1. Apply diabetes billing codes ≥1 Step 2. Apply T1D codes/ (T1D + T2D codes) ≥0.6
This step was designed to apply T2D algorithm, but neither CART nor the pre-specified T2D algorithm met the criteria.
Step 3. Medical record review
A
B
Table 4: The performance of the stepwise surveillance approach
Diabetes Type
MUSC UNC
Review 289 (27.4%) of 1055 records
Review 234 (18.2%) of 1289 records
Sensitivity Positive predictive value
Sensitivity Positive predictive value
Total 97.9 96.7 97.0 96.8
Type 1 99.6 93.9 99.3 94.8
Type 2 91.5 100.0 89.5 100
Othera 79.2 100 80.4 100 Abbreviations: MUSC: Medical University of South Carolina; UNC: University of North Carolina.
a
Included cases with diabetes other than type 1 or type 2.
RESEARCH
AND
possible. We sincerely thank Xin Zhou for providing us with R codes to perform CART analysis.
SUPPLEMENTARY MATERIAL
Supplementary materialis available online athttp://jamia.oxfordjournals.org/.
REFERENCES
1. Dabelea D, Mayer-Davis EJ, Saydah S,et al. Prevalence of type 1 and type 2 diabetes among children and adolescents from 2001 to 2009. JAMA.
2014;311:1778–1786.
2. Lipman TH, Levitt Katz LE, Ratcliffe SJ,et al. Increasing incidence of type 1 diabetes in youth: twenty years of the Philadelphia Pediatric Diabetes Registry.Diabetes Care.2013;36:1597–1603.
3. Smith TL, Drum ML, Lipton RB. Incidence of childhood type I and non-type 1 diabetes mellitus in a diverse population: the Chicago Childhood Diabetes Registry, 1994 to 2003.J Pediatr Endocrinol Metab.2007;20:1093–1107. 4. Bobo N, Evert A, Gallivan J,et al. An update on type 2 diabetes in youth
from the National Diabetes Education Program. Pediatrics. 2004;114: 259–263.
5. Writing Group for the SEARCH for Diabetes in Youth Study Group, Dabelea D, Bell RA,et al. Incidence of diabetes in youth in the United States.JAMA.
2007;297:2716–2724.
6. Lawrence JM, Imperatore G, Dabelea D,et al. Trends in incidence of type 1 diabetes among non-Hispanic white youth in the U.S., 2002-2009.
Diabetes.2014;63:3938–3945.
7. Crume TL, Hamman RF, Isom S,et al. Factors influencing time to case as-certainment in youth with type 1 and type 2 diabetes in the SEARCH for Diabetes in Youth Study [Abstract].Diabetes.2013;62(Suppl 1): A412. 8. DesRoches CM, Charles D, Furukawa MF,et al. Adoption of electronic health
records grows rapidly, but fewer than half of US hospitals had at least a ba-sic system in 2012.Health.Aff. (Millwood)2013;32:1478–1485.
9. Klompas M, McVetta J, Lazarus R,et al. Integrating clinical practice and public health surveillance using electronic medical record systems.Am J Prev Med.2012;42:S154–S162.
10. Zhong VW, Pfaff ER, Beavers DP,et al. Use of administrative and electronic health record data for development of automated algorithms for childhood diabetes case ascertainment and type classification: the SEARCH for Diabetes in Youth Study.Pediatr Diabetes.2014;15:573–584.
11. Lawrence JM, Black MH, Zhang JL,et al. Validation of pediatric diabetes case identification approaches for diagnosed cases by using information in the electronic health records of a large integrated managed health care or-ganization.Am J Epidemiol.2014;179:27–38.
12. Lemon SC, Roy J, Clark MA,et al. Classification and regression tree analysis in public health: methodological review and comparison with logistic regres-sion.Ann Behav Med.2003;26:172–181.
13. Therneau T, Atkinson E, Foundation M. An Introduction to Recursive Partitioning Using the RPART Routines. http://cran.r-project.org/web/pack-ages/rpart/vignettes/longintro.pdf. Accessed June 26, 2015.
14. SEARCH Study Group. SEARCH for Diabetes in Youth: a multicenter study of the prevalence, incidence and classification of diabetes mellitus in youth.
Control Clin Trials.2004;25:458–471.
15. German RR, Lee LM, Horan JM,et al. Updated guidelines for evaluating pub-lic health surveillance systems: recommendations from the Guidelines Working Group.MMWR Recomm Rep.2001;50:1–35; quiz CE1-7. 16. R Development Core Team. R: A language and environment for statistical
computing. Vienna, Austria: R Foundation for Statistical Computing.http:// www.r-project.org.libproxy.lib.unc.edu/. Accessed June 26, 2015. 17. Pettitt DJ, Talton J, Dabelea D,et al. Prevalence of diabetes in U.S.youth in
2009: the SEARCH for diabetes in youth study. Diabetes Care.2014;37: 402–408.
18. Amed S, Dean HJ, Panagiotopoulos C,et al. Type 2 diabetes, medication-in-duced diabetes, and monogenic diabetes in Canadian children: a prospec-tive national surveillance study.Diabetes Care.2010;33:786–791. 19. Dart AB, Martens PJ, Sellers EA,et al. Validation of a pediatric diabetes case
definition using administrative health data in Manitoba, Canada.Diabetes Care.2011;34:898–903.
20. Vanderloo SE, Johnson JA, Reimer K,et al. Validation of classification algo-rithms for childhood diabetes identified from administrative data.
Pediatr.Diabetes2012;13:229–234.
21. Rhodes ET, Laffel LM, Gonzalez TV,et al. Accuracy of administrative coding for type 2 diabetes in children, adolescents, and young adults.Diabetes Care.2007;30:141–143.
22. Moczygemba J, Fenton SH. Lessons learned from an ICD-10-CM clinical documentation pilot study.Perspect Health Inf Manag.2012;9:1c. 23. Reinehr T, Schober E, Wiegand S,et al. Beta-cell autoantibodies in children
with type 2 diabetes mellitus: subgroup or misclassification?Arch Dis Child. 2006;91:473–477.
24. Dabelea D, Pihoker C, Talton JW,et al. Etiological approach to characteriza-tion of diabetes type: the SEARCH for Diabetes in Youth Study.Diabetes Care.2011;34:1628–1633.
25. Bell RA, Mayer-Davis EJ, Beyer JW,et al. Diabetes in non-Hispanic white youth: prevalence, incidence, and clinical characteristics: the SEARCH for Diabetes in Youth Study.Diabetes Care.2009;32(Suppl 2):S102–S111. 26. Fonarow GC, Adams KF Jr, Abraham WT,et al. Risk stratification for
in-hos-pital mortality in acutely decompensated heart failure: classification and re-gression tree analysis.JAMA.2005;293:572–580.
27. Schneider DF, Dobrowolsky A, Shakir IA,et al. Predicting acute kidney injury among burn patients in the 21st century: a classification and regression tree analysis.J Burn Care Res.2012;33:242–251.
28. Hess KR, Abbruzzese MC, Lenzi R,et al. Classification and regression tree analysis of 1000 consecutive patients with unknown primary carcinoma.
Clin Cancer Res.1999;5:3403–3410.
AUTHOR AFFILIATIONS
...
1Department of Nutrition, Gillings School of Global Public Health, University of
North Carolina, Chapel Hill, NC, USA
2Biomedical Informatics Center, Medical University of South Carolina,
Charleston, SC, USA 3
North Carolina TraCS Institute, University of North Carolina, Chapel Hill, NC, USA 4Hubert Department of Global Health, Rollins School of Public Health, Emory
University, Atlanta, GA, USA 5
Department of Biostatistical Sciences, School of Medicine, Wake Forest University, Winston-Salem, NC, USA
6Cecil G. Sheps Center for Health Services Research, University of North
Carolina, Chapel Hill, NC, USA
7Department of Research and Evaluation, Kaiser Permanente Southern
California, Pasadena, CA, USA
8Department of Epidemiology, Colorado School of Public Health, University of
Colorado, Aurora, CO, USA 9
Division of Pediatric Endocrinology, Medical University of South Carolina, Charleston, SC, USA
10Department of Washington, University of Washington, Seattle, WA, USA
11
Centers for Disease Control and Prevention, Division of Diabetes Translation, Atlanta, GA, USA
12Department of Medicine, School of Medicine, University of North Carolina,
Chapel Hill, NC, USA