CRM & Cloud Solutions
CRM Benefits
f
or 3PLs
Cloud Benefits
for 3PLs
Increased productivity
Systematic way to track business activity
Measurability of marketing and sales activity
Individual customer service
Automated information updates
Ensured safety of shipments
CRM
CRM
Reduction of the total cost of services
(including cost for installations, upgrades,
maintenance fees, etc.)
Pay-per-use model offers more agility,
flexibility and elasticity of business, as well
quick and cost-effective reaction to
less-predictable events
Customized, personalized logistics services
becomes affordable for end customer
Pricing issues Preparation/ data collection for customer Internal management & team meetings Responses to RFPs Face-to-face meetings Phone meetings/ conversations
Inputting & updating data
8%
22%
13%
23%
12%
13%
9%
What do 3PL sales executives do with their
available time?
3PL Users
3PL Providers
Potential Benefits of CRM
(1 least helpful, 5 most helpful)
Availability of real-time information relating to customer shipments
(e.g., tracking, etc.)
Easy access to cost and shipment pricing information
Increased ability of 3PL sales executives to respond to customer requests
Greater visibility of global operations
More professional and productive sales calls and customer presentations
by 3PL sales executives
4.2
3.9
3.7
3.7
3.0
4.0
3.6
3.4
4.0
3.7
With more free-trade agreements than any other country, a growing manufacturing base DQGDVWUDWHJLFJHRJUDSKLFORFDWLRQ0H[LFR is emerging as an economic powerhouse. A number of companies are moving manufacturing to the country, which creates strong growth opportunities for 3PLs on both freight movement and ancillary services. 0H[LFR LV WKH WK ODUJHVW HFRQRP\ LQ WKH world and the second largest economy in Latin America, as shown in Figure 27. American trade ZLWK0H[LFRKDVJURZQE\QHDUO\VLQFH 2010 to $507 billion annually, according to the 2IÀFHRIWKH8QLWHG6WDWHV7UDGH5HSUHVHQWDWLYH DQG*ROGPDQ6DFKVUHSRUWVWKDW0H[LFRLV RQWUDFN WR EHFRPH WKH ÀIWK ODUJHVW JOREDO economy by 2050.
0H[LFR·V)UHH7UDGH$JUHHPHQWVDORQJZLWK an Economic Partnership Agreement that grants it preferential access to 44 countries and over one billion consumers guarantees access WRLQWHUQDWLRQDOPDUNHWV7KHFRXQWU\KDVDOVR signed 28 Investment Promotion and Protection $JUHHPHQWVDQG'RXEOH7D[DWLRQ7UHDWLHVZLWK more than 40 countries, presenting additional incentives for companies to move operations there.
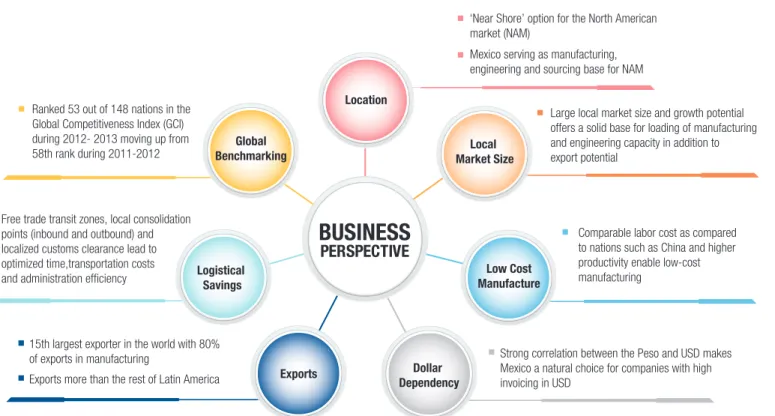
)URP D EXVLQHVV SHUVSHFWLYH 0H[LFR LV renowned as a low-cost manufacturing and H[SRUWGHVWLQDWLRQ,WSURYLGHVDQHDUVKRUH option for the North American market, and study respondents said businesses are SULPDULO\PRYLQJRSHUDWLRQVWR0H[LFRIURP WKH 86 DQG &KLQD VKRZQ LQ Figure 28.
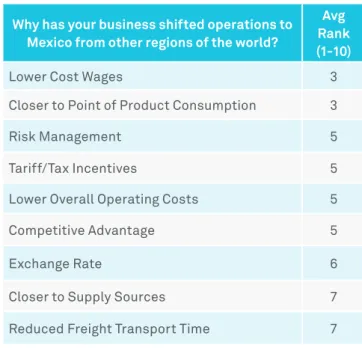
Figure 29 highlights respondents reasons for VKLIWLQJRSHUDWLRQVWR0H[LFRZLWKWKHPRVW important reasons being lower cost wages and moving operations closer to the point RI FRQVXPSWLRQ 0H[LFR DOVR RIIHUV ORZHU RYHUDOORSHUDWLQJFRVWVDVZHOODVWDULIIDQGWD[ LQFHQWLYHV7KHVWURQJFRUUHODWLRQEHWZHHQWKH SHVRDQGWKH86GROODULVFUHDWLQJDGGLWLRQDO RSSRUWXQLWLHVLQ0H[LFR
Figure 30 shows that just under half of study respondents40%said they have already PRYHGVRPHRIWKHLURSHUDWLRQVWR0H[LFR Workshop participants said concerns over contaminated products being imported from &KLQD ZKLFK LQ UHFHQW \HDUV KDYH FDXVHG recalls on goods ranging from pet food to toys, FRXOGGULYHHYHQPRUHSHRSOHWR0H[LFR
Figure 27: An Open Economy Backed by Sound Fundamentals and Alliances Offers Lucrative Opportunities Within Mexico
Source: 2015 19th Annual Third-Party Logistics Study.
ECONOMIC
PERSPECTIVE
Economy Size Sound Fundamentals FTAs Agreements & Treaties Open Economy Product Demand Economic Outlook14th largest economy in the world 2nd largest economy in Latin America To become the 5th largest global
economy by 2050 as per Goldman Sachs Average growth rate during 2019 expected at 4%
Strong demand for luxury products within the economy
Top 10% of households hold around 40% of income and 80% of assets
Open economy that guarantees access to international markets through a network of FTAs and strategic geographic location
Signed 28 Investment Promotion and Protection Agreements (IPPA) and Double Taxation Treaties with more than 40 countries
Mexico has a network of 12 Free Trade Agreements (FTAs) and an Economic Partnership Agreement granting it preferential access to 44 countries and over one billion consumers
Low country risk (EMBi* +157)
S&P’s long-term foreign currency rating = BBB S&P’s local currency rating =
5HVSRQGHQWVLQWKH86DQG&KLQDDUHWKH largest percentage of those that are moving RSHUDWLRQV WR 0H[LFR -XVW RYHU RI 0H[LFDQH[SRUWVVKLSWRWKH8QLWHG6WDWHV GHPRQVWUDWLQJ WKDW 0H[LFR LV SURYLGLQJ D near-shoring alternative option for the North $PHULFDQPDUNHW0RYLQJSURGXFWLRQFORVHU to the point of consumption of goods shortens the supply chain, which minimizes potential disruptions and cuts costs. It also enables companies to carry less inventories.
Labor costs are also creating an advantage IRU0H[LFRSDUWLFXODUO\DVZDJHVLQ&KLQD KDYHVWDUWHGLQFUHDVLQJ0H[LFR·VODERUFRVWV are comparable with other nations, and it has higher productivity, which enables low-cost manufacturing. Whats more, free-trade transit zones, local consolidation points on both inbound and outbound loads and localized customs clearance lead to optimized
55% 36% 9% 3% 3% 3% 3% 3% 3% 3% 3% 3% 0% 15% 30% 45% 60% USA China Canada Antigua & Barbuda Bangladesh Brazil Europa Island Hungary Pakistan Singapore Thailand United Kingdom
% of Respondents Moving Operations to Mexico
Respondents also moving operations from: Afghanistan, Algeria, American Samoa, Angola, Antarctica, Armenia, Bahrain, British Indian Ocean Territory, Burma, France, Germany, Hong Kong, India, Japan, Lebanon, Maldives, Peru, Pitcairn
Islands, Poland, Puerto Rico, Saint Helena, SriLanka, Sweden, Switzerland, Taiwan, Thailand, UAE, Venezuela, Vietnam, Virgin Islands, Zimbabwe
Figure 28: Percentage of Respondents Moving Operations to Mexico
Figure 29: Primary Reasons Businesses are Moving to Mexico
Just under half of respondents have already moved
some of their operations to Mexico…
1-3 years 6.39% 3-5 years 5.28% 5-10 years 7.32% 10+ years 23.06% Not currently operating in Mexico 58.33%
Figure 30: Respondents Currently Operating in Mexico
Source: 2015 19th Annual Third-Party Logistics Study. Source: 2015 19th Annual Third-Party Logistics Study.
Why has your business shifted operations to
Mexico from other regions of the world?
Avg
Rank
(1-10)
Lower Cost Wages
3
Closer to Point of Product Consumption
3
Risk Management
5
Tariff/Tax Incentives
5
Lower Overall Operating Costs
5
Competitive Advantage
5
Exchange Rate
6
Closer to Supply Sources
7
Reduced Freight Transport Time
7
Opportunities for 3PLs
7KH JURZWK RI ORJLVWLFV VHUYLFHV SOD\V D FUXFLDOUROHLQUHQGHULQJ0H[LFR·VEXVLQHVVHV cost competitive as compared with similar ventures globally. For years shippers have been UHSRUWLQJVLJQLÀFDQWORJLVWLFVFRVWUHGXFWLRQV IURPPRYLQJRSHUDWLRQVWR0H[LFR$VHDUO\DV 2012, shippers reported an average logistics cost reduction of 21% compared with other parts RIWKHZRUOG7KH\DOVRVDZLQYHQWRU\FRVW reductions of 12% compared to 9% globally and RUGHUÀOOUDWHVPRYHWRIURP
Remaining Challenges
$OWKRXJK UHVSRQGHQWV KDYH VHHQ D EHQHÀW from lower costs, of those that have moved RSHUDWLRQVWR0H[LFRWKHPDMRULW\VDLGWKH\ have yet to see large revenue growth from WKHJURZLQJ0H[LFDQHFRQRP\SURYLQJWKDW both opportunities and challenges remain. Respondents said they are most concerned
Manufacturing Within Mexico
7KHPDMRULW\RI0H[LFR·VH[SRUWV³³DUHLQ PDQXIDFWXULQJ0H[LFRH[SRUWVPRUHWKDQWKH rest of Latin America and is the 15th largest H[SRUWHULQWKHZRUOGFigure 32 shows the top three manufacturing industries included food, transportation equipment and chemicals. I n 2013, computer a nd ele c t ron ics manufacturing saw the highest year-over-year production growth14.3%as a result of DVXUJHLQH[SRUWV,WZDVIROORZHGE\D growth in food and a 1.2% increase in beverages and tobacco, shown in Figure 33.
:KLOHWKHUHLVJURZWKLQH[SRUWVWKHDPRXQW of goods produced for domestic consumption, particularly in the food and beverage sector, is also increasing. As employment rates within 0H[LFRULVHFRQVXPHUVKDYHPRUHGLVSRVDEOH income and purchase more.
BUSINESS
PERSPECTIVE
Location Local Market Size Low Cost Manufacture Dollar Dependency Exports Logistical Savings Global Benchmarking‘Near Shore’ option for the North American market (NAM)
Mexico serving as manufacturing, engineering and sourcing base for NAM Ranked 53 out of 148 nations in the
Global Competitiveness Index (GCI) during 2012- 2013 moving up from 58th rank during 2011-2012
Free trade transit zones, local consolidation points (inbound and outbound) and localized customs clearance lead to optimized time,transportation costs and administration efficiency
Strong correlation between the Peso and USD makes Mexico a natural choice for companies with high invoicing in USD
Comparable labor cost as compared to nations such as China and higher productivity enable low-cost manufacturing
Large local market size and growth potential offers a solid base for loading of manufacturing and engineering capacity in addition to export potential
15th largest exporter in the world with 80% of exports in manufacturing
Exports more than the rest of Latin America
Figure 31: Mexico is Renowned as a Low-Cost Manufacturing and Export Destination
with security, crime and corruption along with workforce readiness and infrastructure (Figure 34).