www.ijtes.net
Developing
and
Validating
a
Comprehensive
Scale
to
Measure
Perceived
Barriers
to
Technology
Integration
Ugur Basarmak, Nazire Burcin Hamutoglu Kirsehir Ahi Evran University
To cite this article:
Basarmak, U. & Hamutoglu, N.B. (2020). Developing and validating a comprehensive scale
to measure perceived barriers to technology integration.
International Journal of Technology
in Education and Science (IJTES), 4
(1), 53-71.
Volume 4, Issue 1, Winter 2020
ISSN: 2651-5369
Developing and Validating a Comprehensive Scale to Measure Perceived
Barriers to Technology Integration
Ugur Basarmak, Nazire Burcin Hamutoglu
Article Info
Abstract
Article History
Received: 15 March 2019
The purpose of this study was to develop a comprehensive and a generic scale to measure perceived barriers to technology integration. To this end, 511 pre-service teachers for the factor structure of the scale were performed. Findings showed that the scale has 51 items and 14 factors explained 63.17% of total variance. CFA results confirmed the structure of the scale. Furthermore, convergent and divergent validity were examined, and results show that the scale has construct validity. The reliability of the scale was calculated by Cronbach’s alpha co-efficiency and composite coefficient of fourteen factors show that the scale is reliable. It is thought that this instrument will be a practical guide for all pre-service teachers, teachers, teacher educators, instructors in “Supporting Technology Integration” from the field of instruction, learning, teaching, curriculum development, learning environments, teacher education, educational technology, educational developments, measurement and evaluation, and educational statistics which are appropriate to the scope of the journal, and may help to get a contribution and high quality studies.
Accepted: 16 October 2019
Keywords
Barriers
Technology integration Validity- reliability Pre-service teachers Scale
Introduction
In the field of education, the concepts of technology and integration are now widely used together. In our age, the presence of technology advancing at an unbelievable pace in educational environments has brought about the collective use of these two concepts. Including new elements to the system and ensuring their coherent operation and coordination by bringing pieces together as a whole (Cornu, 1995), the concept of integration is understood as “Information and Communication Technology Integration (ICTI, henceforth) when used in conjunction with technology in educational environments. While ICTI serves a more functional and effective instructional-educational process, it undoubtedly brings along being selective as we take the advancing technologies into educational environments. Because when it comes to technology integration in learning processes, technology is a sine qua non in these learning processes. Otherwise, that technology will not be more than just a tool used in the learning process. So much so that ICTI, which match each other pretty much and involve several applications when used side by side, covers many variables that should be focused on.
In this paper, barriers that teachers are mostly faced while integrating a new technology into the classroom setting are generalized and incorporated. In addition to this, it is thought that the developed scale will be helped to explore and measure the main problems in barriers within the technology integration. It should be noted that the present article is not limited with a validity study; it is also an exploring study in terms of understanding the core and generic structure of barriers in technology.
Taking these into consideration, this study aimed to compile the barriers encountered in technology integration via a comprehensive literature review and to develop a valid and reliable instrument in identifying teacher perceptions of the barriers to technology integration. The achieved results will provide the literature with a comprehensive and generic instrument. Consequently, it is considered that this instrument will be a guide for all teacher educators in “Supporting Technology Integration of Pre-service Teachers” with its generic and comprehensive structure.
Literature Review
education constitutes the basic components that aim to provide manpower dominating science and technology and to train technology experts for technological development and innovations.
Reserachers state that the reflection of these developments in technology brings three basic interaction types such as technology education, technical education and the use of technology in education globally (Alkan, 2011; Boh, 1994). Accordingly, while technology education aims to increase the technology literacy of societies; technical education constitutes the basic components that aim to provide scientifically and technologically competent manpower and technology experts, and to train technology experts (Alkan, 2011). In short, technological and technical education aims at developing individuals who are competent in the use of technology to enable the use of the technology by the society. On the other hand, when the use of technology in education is considered, it becomes evident that technology plays a role in supporting education and aims at increasing the productivity of education (Alkan, 2011). Although Alkan, Deryakulu, and Şimşek (1995) state that the use of instruments supported education until 1960s while the use of such supportive instruments were left to the discrete on of teachers, they also emphasize that since then, the use of such instruments in education manifested itself as a must. This reminds us “The Big Debate” brought up by Clark (1983; 1994) and Kozma (1991; 1994). In 1980s Clark metaphorically argued that computers did not support learning as a teaching technology, but acted as a “mere vehicle” in this process. He summarized his ideas as, “based on this consistent evidence, it seems reasonable to advise strongly against future media comparison research. Five decades of research suggest that there are no learning benefits to be gained from employing different media in instruction, regardless of their obviously attractive features or advertised superiority. All existing surveys of this research indicate that confounding has contributed to the studies attributing learning benefits to one medium over another and that the great majority of these comparison studies clearly indicate no significant difference” (Clark, 1983, p. 450) insisting that “media will never influence learning”. In contrary to this, Kozma in his work entitled “Will Media Influence Learning? Reframing the Debate” (1994) stated that “media must be designed to give us powerful new methods, and our methods must take appropriate advantage of a medium’s capabilities.” This discussion may bring up the notion of technological integration in education. Simon (1981) and Glaser (1976) emphasize that “educational technology is a design science, not a natural science”. Based on the idea of designing the use of technology in education and learning environments should be handled together with deterministic and interventionist instructional methods (Jonassen, Campbell, & Davidson, 1994), as well as the subject which is discussed by Clark and Kozma that learning environments are restructured as learning centre, in this study it is aimed to develop a comprehensive pedagogical assessment tool that takes into account the perceived barriers to the use of technology in the learning environment. It is thought that the tool developed for this purpose is very important in terms of technology integration.
As in explained in Groves and Zemels (2000) study that overhead projector was once considered a cutting-edge tool in the classrooms, and needs to be facilitate teaching and learning activities in an effective way. In fact, not only projector, within the developing technologies each of these technologies should be designed considering the dynamics of classroom settings and integrated into educational environment via integration studies for its effective usage. For example, the projection devices, which are now commonly used in classrooms (Groves & Zemels, 2000), were produced to meet the needs of the trained manpower in the military during the World War II (Yakar, 2013) and to train high number of people in a short time. According to Seels and Richey (1994), the field of instructional technology has a broad framework which also addresses fields such as military education, higher education, and adult education (Seels and Richey, 1994). Accordingly, it is seen that the use of instructional technologies in educational settings is not something new and that this situation dates back to the years of World War II (Ata and Atik, 2017). Indeed, it is even stated that Skinner developed a new teaching method and used the teaching machine with James Holland in his classes in those years (1930-1940) (Sharp, 2002). Although Skinner, who is a behavioral scientist, has developed a method that is suitable for teaching machine technology, it is necessary to apply the technologies which developed later on together with the new methods. Çetin, Çakıroğlu, Bayılmış, and Ekiz (2004) state that there have been problems since the introduction of technologies (e.g., projection device, computer, blackboard, etc.) used in each stage of education into the classrooms, in other words into the education life.
In a study Rabah (2015), which investigated educators' perceptions of technology integration in English schools in Québec, the participants pointed out several challenges such as inconsistent investments in ICT equipment, infrastructure and resources, flexibility of funding, additional professional development, additional support, the inclusion of technology into assessment and curriculum plans.
In the literature, when the theories, practices, and models regarding ICTI are examined, the main purpose of almost all of them is the effective and functional use of innovation (technology) in educational-instructional environments; that is, its integration to the process. In this case, it is observed that some of the models address integration studies at the individual-level whereas some others address these studies at the school and at the teacher-level. In the theories at individual-level concerning the diffusion of innovation (Rogers, 1962; 2003) and technology acceptance (Davis, 1986; 1989), it is stated that the individual’s belief in and attitude toward a given innovation to be integrated is related to his/her future behavior of using that technology. Similarly, the TPACK model is one of the integration models examined at the teacher level by taking the utilization of technology (Mishra and Koehler, 2006). Maddux and Johnson (2006) also refer to the idea that technology integration models are addressed at the teacher-level as “impossibility of instructing the course without that technology.” It can be said that addressing these integration models at the individual, at the teacher and at the school levels brings along some barriers at the same time. It is observed that the barriers discussed in the literature are mostly related to online learning environments. For example, the “Student Barriers to Online Learning” scale (Muilenburg and Berger, 2005) identified the barriers to online learning as barriers related to administrators and educators, lack of social interaction, academic skills such as language, reading, writing, technical tools and their use, motivation and willingness, time and support, Internet access and financial barriers and technical problems. Moore (1993) indirectly mentioned barriers through the elements of structure, interaction and autonomy in the Transactional Distance Theory addressing the distance perceived by students in the environment of distance education. However, it is possible to argue that the barriers encountered in either online learning or traditional face-to-face learning environments may affect technology integration closely.
Barriers to technology integration are classified at school and teacher levels in the literature (Çakıroğlu, 2013). On the other hand, as for the studies on barriers at the teacher level, Ertmer (1999) describes external barriers as access to technology, institutional and technical support, time and financial issues and internal obstacles as teacher computer beliefs and attitudes, classroom practices and unwillingness to change and emphasizes that external barriers precede internal barriers. Reinforcing this case, Rogers (2003) states that internal barriers stem from teacher attitudes and perceptions of a new technology but it is also fed by external barriers (accessibility and usability, institutional and technical support, stakeholder development). In another study, Hendren (2000) addresses barriers related to teachers, administrators, and individuals as internal barriers and barriers caused by the organization as external barriers. Inan (2007) states that barriers at the teacher level are also about variables such as age, experience, belief and attitude, and preparedness. As for the studies addressing barriers at the school level, Mazman and Usluel (2011) emphasize that cultural and social impact, institutional support and technological infrastructure are important in integration.
It is seen in the aforementioned studies that the barriers encountered in technology integration are handled from different perspectives. Kilinc, Tarman, and Aydın (2018) focuses on internal and external factors in their study called ”Barriers in Technology and Education”. The instruments developed by Schoepp (2005), Butler and Sellbom (2002), and Brush, Glazewski, and Hew (2008) address the barriers to technology integration under a general heading. Jacobsen (1998) examined technology integration under the headings of change, encouragement, assistant, and barriers. Previous studies seem to adopt a qualitative approach mostly, and there are limited quantitative studies, especially those which measure barriers to technology integration are very limited. Considering this gap, in this study it is aimed to develop a valid and reliable scale which has a comprehensive and generic structure within the scope of technology integration background.
Method
This study is a scale development study, and the research was planned and carried out in accordance with the relational survey model which is a quantitative research method. Based on this, literature was searched comprehensively and theoretical framework was determined. In addition to this, an item pool was created, and expert opinions were taken into account for the initial survey form to serve the aim of scale development.
Participants
511 pre-service teachers studying at 4th grade level and already had their teacher training course in Kırşehir Ahi Evran University in the academic year of 2018-2019 participated in the study on a voluntary basis. In the purposive sampling method, the criterion was that the participants took the School Experience and Teaching Practice courses, and already had experience in schools, and the participants were senior students at the Faculty of Education, and 70.3% (n = 359) are female and 29.7% (n = 152) are male students.
Instrument: Perceived Barriers to Technology Integration (PBTI) Scale
Procedures of Scale Development
The scale development procedures were as follow: First of all, an 80-item pool was created following an extensive review of the literature for the development of PBTI scale (Brush et al., 2008; Butler and Sellbom, 2002; Ertmer, 1999; Ertmer et al., 2012; Franklin et al., 2001; Kopcha, 2012; Muhametjanova, 2014; Muilenburg and Berger, 2005; Schoepp, 2005). After the literature review a comprehensive item pool includes beliefs, self-efficacy, lack of vision, leadership, training, and money, and content, time, infrastructure, assessment and resistance dimensions was generated, and the items were subjected to a critical analysis by an expert group included five field experts. The experts are comprised from 1 linguistic expert, 1 assessment-evaluation expert and 1 psychological counseling and guidance expert), who were specialized in their fields. The panel reviewed the items regarding their content and face validity, and necessary revisions were made in the light of experts’ comments and suggestions. At the end of these processes, and a draft of the 69-item scale was prepared.
This scale was then subjected to validity and reliability analyses for determining its construct within the Turkish context. More specifically, EFA and CFA were carried out to test the scale’s structure validity. KMO and Bartlett's Sphericity test values were calculated for the EFA. The shared factor variance and the factor load values were calculated. The factor structure achieved with the EFA was confirmed with the CFA, and the fit indices were reported. The findings obtained on scale’s construct validity were also examined with the convergent and divergent validity values. Finally, Cronbach's Alpha internal consistency and composite reliability coefficients were used to determine the reliability of the scale.
Introduction of the Scale
were taken part under the factors, Kline’s (1998) principles were considered. This 5-point Likert scale is graded as follows: 1= Strongly Disagree, 2= Disagree, 3= Neutral, 4=Agree, and 5= Strongly Agree. The detailed information about the factors is below:
The factor of beliefs in learning-teaching activities (BILTA): There are 4 items in the beliefs in
learning-teaching activities-BILTA factor, and scores obtained from this factor vary between 4 and 20. The statement “I believe that the use of technology in learning-teaching activities increases learning” is an exemplary item of this factor.
The factor of beliefs in the expert support (BIES): There are 9 items in the beliefs in the expert support-BIES
factor. Scores obtained from this factor vary between 9 and 45, and an exemplary item defining this factor is “I believe that referring to expert support when using technology makes it easier for me.”
The factor of technological self-efficacy beliefs (TSEB): There are 4 items in the technological self-efficacy
beliefs-TSEB factor. Scores obtained from this factor vary between 4 and 20, and an exemplary item defining this factor is “I feel myself lacking in the use of technology in courses.”
The factor of pedagogical self-efficacy beliefs (PSEB): There are 5 items in the pedagogical self-efficacy
beliefs-PSEB factor. Scores obtained from this factor vary between 5 and 25, and an exemplary item defining this factor is “I pay regard to the characteristics of the target group when using technology in courses.”
The factor of beliefs in change (BIC): There are 2 items in the beliefs in change-BIC factor. Scores obtained
from this factor vary between 2 and 10, and an exemplary item that defines this factor is “I believe that use of technology will not bring success right away.”
The factor of lack of vision (LV): There are 3 items in the lack of vision-LV factor. Scores obtained from this
factor vary between 3 and 15, and an exemplary item defining this factor is “My institution expects me to use technology in my classes effectively.”
The factor of lack of leadership (LL): There are 2 items in the lack of leadership-LL factor. Scores obtained
from this factor vary between 2 and 10, and an exemplary item defining this factor is “Administrators of the institution do not insist us to use technology in courses.”
The factor of lack of money (LM): There are 2 items in the lack of money-LM factor. Scores obtained from this
factor vary between 2 and 10, and an exemplary item defining this factor is “If it is important to use a new technology in the course, administrators of the institution procure that technology.”
The factor of family resistance (FR): There are 5 items in the family resistance-FR factor of, and scores obtained
from this factor vary between 5 and 25. The statement “Families do not insist on the use of new technologies.” is an exemplary item of this factor.
The factor of lack of training (LT): There are 2 items in the lack of training-LT factor. Scores obtained from this
factor vary between 2 and 10, and an exemplary item defining this factor is “I think that the training I took in the use of technology is easily applicable in the classroom.”
The factor of infrastructure (INF): There are 4 items in the infrastructure-INF factor. Scores obtained from this
factor vary between 4 and 20, and an exemplary item defining this factor is “Our schools do not have sufficient infrastructure including hardware, software, Internet access, etc.”
The factor of content (CONT): There are 3 items in the content-CONT factor. Scores obtained from this factor
vary between 3 and 15, and an exemplary item defining this factor is “I have the content of curriculum suitable for the technology I use in the course.”
The factor of time (TIME): There are 3 items in the time-TIME factor. Scores obtained from this factor vary
between 3 and 15, and an exemplary item that defines this factor is “Technology integration takes much less time I think.”
The factor of assessment (ASSES): There are 3 items in the assessment-ASSES factor. Scores obtained from this
Data Analysis
Reliability analysis and EFA of the 51-item scale were performed by using SPSS 20.0 and CFA in AMOS 21. The findings regarding the construct validity were processed in the Microsoft Office Excel.
Findings
The findings in relation to the scale are given below. Accordingly, before analyzing the data the prerequisites for the analysis were controlled to meet the assumptions. The data showed at moderate level multi-collinearity and singularity based on correlation results (Akbulut, 210, p.158). Normality distribution was tested via skewness - kurtosis values are ranging between -2.5 and +2.5 (Mertler & Vannatta, 2005), and finally extreme values were controlled by Mahalanobis Distance in the dataset (p<0.01) (Büyüköztürk, 2011). The results showed that the dataset is met the assumptions and ready to carry out the analysis.
Findings Achieved in the Scale Development Process
Content and Face Validity
As mentioned earlier, a panel of experts reviewed the initial version of the item pool for the PBTI scale’s content and face validity.
Structure Validity
As also discussed earlier, structure validity of the scale was investigated with EFA and CFA. Normality, outlier, multi-collinearity and linearity assumptions that are the prerequisites of analyses were examined. There were no outliers in any and all of the items in the scale (Hair, Black, Babin, Anderson, & Tahtam, 2006).
Exploratory Factor Analysis (EFA)
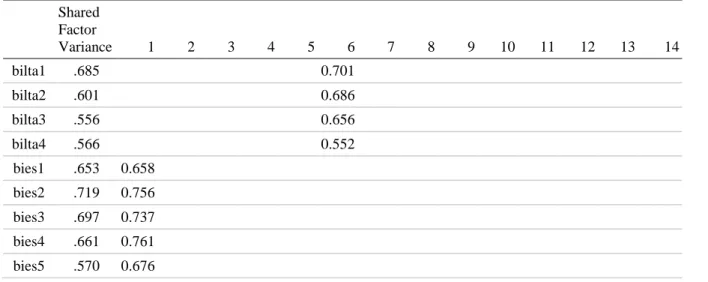
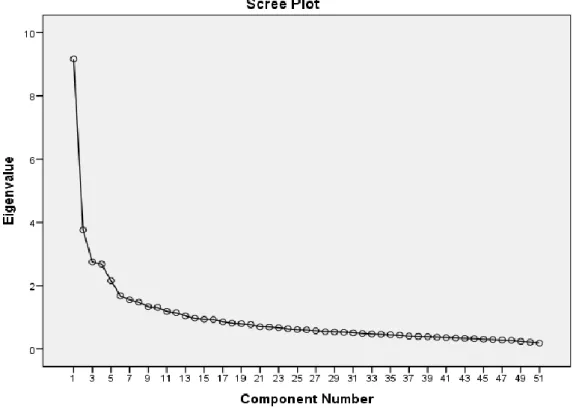
EFA findings seem to fall within the ranges of normal distribution (-2.5<Skewness, Kurtosis<+2.5; Mertler & Vannatta, 2005). The KMO value testing the sample size in EFA, which was performed to test scale’s structure validity, was 0.86. Next, Bartlett’s Sphericity test results showed that the data differed significantly and were fit for factor analysis (Chi-square = 9632.856; df =1275; p= 0.000) (Büyüköztürk, 2011; Hutcheson and Sofroniou, 1999). Thus, according to the EFA results, the number of items in the scale was reduced from 69 to 51 in consideration that it impairs scale’s fourteen-factor construct with an eigenvalue higher than 1. The four-factor construct composed of 51 items with an eigenvalue greater than 1 explains 63.17% of total variance with a rotation of 25%. Explained variance being above 30% is considered sufficient in test development studies in behavioral sciences (Büyüköztürk, 2011). Values obtained in the EFA are reported in Table 1.
Table 1. Exploratory Factor Analysis Results Shared
Factor
Variance 1 2 3 4 5 6 7 8 9 10 11 12 13 14
bilta1 .685 0.701
bilta2 .601 0.686
bilta3 .556 0.656
bilta4 .566 0.552
bies6 .609 0.714 bies7 .640 0.767 bies8 .419 0.44 bies9 .541 0.682
tseb1 .665 0.763
tseb2 .627 0.761
tseb3 .658 0.742
tseb5 .469 0.603
pseb1 .721 0.752
pseb2 .710 0.767
pseb3 .682 0.735
pseb4 .630 0.702
pseb5 .570 0.644
bic1 .728 0.814
bic3 .650 0.728
lv1 .716 0.789
lv2 .708 0.779
lv3 .625 0.657
ll2 .649 0.743
ll3 .552 0.645
lm1 .721 0.816
lm3 .689 0.771
fr2 .518 0.477
fr3 .546 0.681
fr4 .743 0.838
fr5 .704 0.795
fr6 .450 0.603
lt1 .675 0.714
lt2 .745 0.794
inf3 .592 0.714
inf4 .716 0.829
inf5 .698 0.809
inf6 .634 0.758
cont9 .486 0.569
cont11 .707 0.772
cont12 .670 0.756
time15 .496 0.601
time16 .552 0.700
time17 .628 0.745
asses1 .743 0.829
asses2 .748 0.844
As seen in Table 1, factor loads of 51 scale items vary between 0.44 and 0.84. Factor loads of items in the BILTA factor vary between 0.55 and 0.70 and explain 4.66% of total variance. Factor loads of items in the BIES factor vary between 0.44 and 0.77. The items of this factor explain 10.27% of total variance.
Factor loads of items in the TSEB factor vary between 0.60 and 0.76 and explain 4.82% of total variance. Factor loads of items in the PSEB factor vary between 0.64 and 0.77. The items of this factor explain 6.64% of total variance. Factor loads of items in the LV factor vary between 0.66 and 0.79. The items of this factor explain 3.92% of total variance.
Factor loads of items in the BIC, LL, LM, and LT factors vary between 0.73 and 0.81, 0.64 and 0.74, 0.77 and 0.82, and 0.71 and 0.79 respectively. The items of these factors explain 2.82%, 2.79%, 3.03% and 3.13% of total variance respectively. Factor loads of items in the FR factor vary between 0.48 and 0.84. The items of this factor explain 5.16% of total variance.
Factor loads of items in the INF factor vary between 0.71 and 0.83. The items of this factor explain 5.09% of total variance. Factor loads of items in the CONT factor vary between 0.57 and 0.77. The items of this factor explain 3.49% of total variance. Factor loads of items in the TIME factor vary between 0.60 and 0.74. The items of this factor explain 3.63% of total variance. Finally, factor loads of items in the ASSES factor vary between 0.331 and 0.705 and explain 3.73% of total variance. Figure 1 shows the scale’s 14-factor construct.
Figure 1. Eigenvalue-factor Number Chart of PBTI Scale
The results indicate that the scale has 14 factors. These factors are BILTA (items 1-4 ), BIES (items 5-13), TSEB (items 14-17), PSEB (items 18-22), BIC (items 23-24), LV (items 25-27), LL (items 28-29), LM (items 30-31), FR (items 32-36), LT (items 37-38), INF (items 39-42), CONT (items 43-45), TIME (items 46-48), and ASSES (items 49-51). Accordingly, the values achieved in the EFA results (factor load values and explained total variance) explain “Barriers to Technology Integration” which is the construct measured by the scale well.
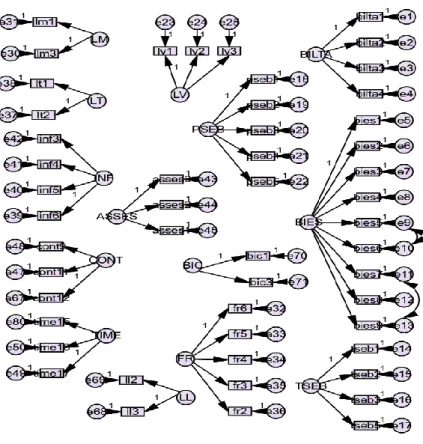
Confirmatory Factor Analysis (CFA)
Figure 2. PBTI Scale Tested with CFA
Table 2. Confirmatory Factor Analysis Results
Load Error Load Error Load Error Load Error
bilta1 0.769 0.025 ll2 0.338 0.051 tseb1 0.694 0.039 lv1 0.753 0.036
bilta2 0.672 0.027 ll3 0.78 0.144 tseb2 0.683 0.044 lv2 0.696 0.037
bilta3 0.612 0.036 lm1 0.579 0.054 tseb3 0.752 0.041 lv3 0.636 0.029
bilta4 0.702 0.03 lm3 0.77 0.084 tseb5 0.498 0.062 bic1 0.502 0.072
bies1 0.759 0.022 lt1 0.79 0.052 pseb1 0.803 0.015 bic3 0.746 0.087
bies2 0.845 0.015 lt2 0.696 0.048 pseb2 0.802 0.013 fr2 0.381 0.045
bies3 0.82 0.016 inf3 0.639 0.047 pseb3 0.786 0.015 fr3 0.543 0.045
bies4 0.765 0.019 inf4 0.805 0.041 pseb4 0.713 0.019 fr4 0.833 0.041
bies5 0.608 0.033 inf5 0.754 0.041 pseb5 0.641 0.023 fr5 0.804 0.046
bies6 0.659 0.029 inf6 0.649 0.043 time15 0.528 0.05 fr6 0.481 0.053
bies7 0.662 0.029 cont9 0.522 0.045 time16 0.627 0.042 asses1 0.793 0.053
bies8 0.328 0.061 cont11 0.684 0.039 time17 0.673 0.043 asses2 0.782 0.06
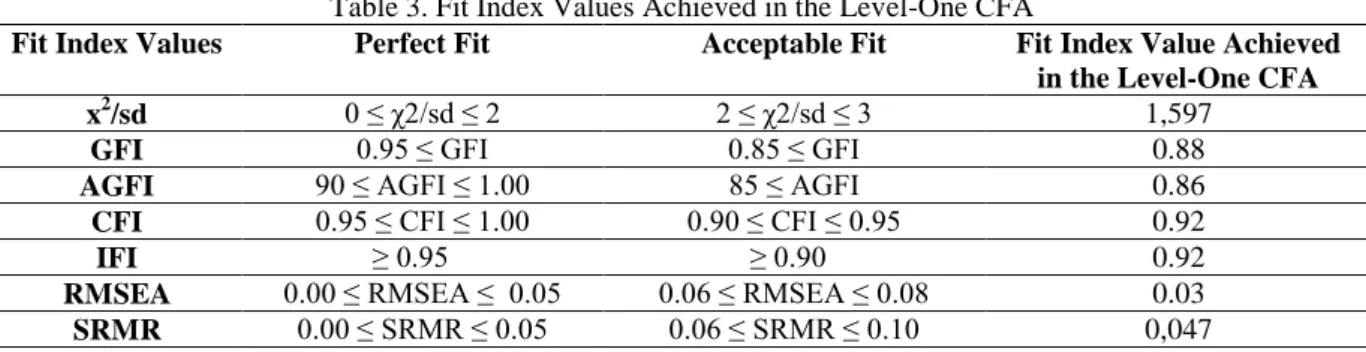
As seen in Table 2, standard regression weights of items in their factors vary between 0.33 and 0.84. It shows that the standard values are significant in terms of their factors (p < 0.001) (Büyüköztürk, 2011). Fit index values of the scale achieved in the level-one CFA are presented in Table 3.
Table 3. Fit Index Values Achieved in the Level-One CFA
Fit Index Values Perfect Fit Acceptable Fit Fit Index Value Achieved
in the Level-One CFA
x2/sd 0 ≤ χ2/sd ≤ 2 2 ≤ χ2/sd ≤ 3 1,597
GFI 0.95 ≤ GFI 0.85 ≤ GFI 0.88
AGFI 90 ≤ AGFI ≤ 1.00 85 ≤ AGFI 0.86
CFI 0.95 ≤ CFI ≤ 1.00 0.90 ≤ CFI ≤ 0.95 0.92
IFI ≥ 0.95 ≥ 0.90 0.92
RMSEA 0.00 ≤ RMSEA ≤ 0.05 0.06 ≤ RMSEA ≤ 0.08 0.03
SRMR 0.00 ≤ SRMR ≤ 0.05 0.06 ≤ SRMR ≤ 0.10 0,047
Regarding the fit indices in Table 3, the model seems to have perfect and acceptable fit indexes (χ2/sd =1806.387/1131) =1.597; CFI = 0.92; IFI = 0.92; GFI = 0.88; AGFI = 0.86; RMSEA = 0.03; SRMR = 0.04) (Bentler & Bonett, 1980; Browne & Cudeck, 1993; Byrne, 2006; Hu & Bentler, 1999; Kline, 2011; Steiger, 2007; Tanaka & Huba, 1985; Schermelleh-Engel & Moosbrugger, 2003).
Construct Validity:Convergent and Divergent Validities
Convergent and divergent validities were investigated for the construct validity regarding whether the PBTI scale measures its four-factor construct, and AOVs were examined for each factor. AOVs of each factor were 0.94 for BILTA, 0.94 for BIES, 0.90 for TSEB, 0.97 for PSEB, 0.83 for BIC, 0.93 for LV, 0.79 for LL, 0.87 for LM, 0.90 for FR, 0.92 for LT, 0.92 for INF, 0.90 for CONT, 0.89 for TIME, and 0.88 for ASSES, respectively. The fact that all these values are higher than .50 confirms convergent validity (Bagozzi and Yi, 1988).For the divergent validity, whether AOV square roots of the scale was both above the correlation between constructs and 0.70 (Fornell and Larcker, 1981) were investigated, and the scale had divergent validity.
Table 4. Divergent Validity Values
B IL T A B IE S T S E B
PSEB LV B IC LL
LM LT INF
C ON T T IM E A S S E S FR
BILTA 0.97 BIES 0.53
**
0.97
TSEB 0.36 **
0.15 **
0.95
PSEB 0.46 ** 0.53 ** 0.30 ** 0.98
LV 0.28 ** 0.35 ** 0.16 ** 0.39 ** 0.97
BIC 0.015 0.16 **
-0.16 **
0.14 **
0.05 0.91
LL -0.100 *
-0.14 **
0.02 -0.13 **
-0.07 -0.11 *
0.89
LM 0.19 **
0.13 **
-0.00 0.19 **
0.22 **
-0.05 -0.09 *
0.93
LT 0.37 ** 0.32 ** 0.24 ** 0.31 ** 0.31 **
-0.04 -0.15 **
0.26 **
0.96
INF -0.10 *
-0.12 **
0.01 -0.21 ** -0.13 ** -0.20 ** 0.10 *
0.03 -0.00 0.96
CONT 0.25 ** 0.23 ** 0.16 ** 0.33 ** 0.28 **
0.01 -0.15 **
0.26 **
0.30 **
-0.05 0.95
TIME 0.21 **
0.23 **
0.08 0.22 **
0.26 **
-0.06 -0.23 **
0.19 **
0.27 **
-0.05 0.36 **
0.94
ASSES -0.016 -0.05 0.18 **
-0.00 -0.01 -0.09 * 0.14 ** -0.11 * -0.09 * 0.16 **
-0.07 -0.21 **
0.94
FR -0.02 -0.05 0.18 **
0.11 *
0.03 -0.14 **
0.16 **
-0.01 0.04 0.12 **
-0.06 -0.09 *
0.23 **
0.95
Reliability
Cronbach's Alpha internal consistency and composite coefficients of the 51-item and 14-factor scale were 0.78 and 0.98 for BILTA, 0.80 and 0.99 BIES, 0.75 and 0.97 for TSEB, 0.86 and 0.99 PSEB; 0.55 and 0.90 for BIC, 0.73 and 0.98 for LV, 0.62 and 0.86 for LL, 0.62 and 0.93 for LM, 0.75 and 0.97 for FR, 0.71 and 0.96 for LT, 0.80 and 0.98 for INF, 0.64 and 0.96 for CONT, 0.63 and 0.96 for TIME, and 0.66 and 0.95 for ASSES, respectively. Research states that reliability coefficient lower than 0.60 refers to very poor reliability while a coefficient between 0.60 and 0.70 means within acceptable limits, and a coefficient higher than 0.80 refers to good reliability (Fraenkel and Wallen, 2006). In short, reliability increases as the coefficient gets closer to 1. It can be accordingly said that the BILTA, BIES, TSEB, PSEB, BIC, LV, LL, LM, FR, LT, INF, CONT, TIME, and ASSES factors have acceptable and good reliability based on composite reliability results. These findings indicate that the scale has a consistent structure in itself.
Evaluation of Scores Obtained in PBTI Scale
Following the analyses regarding the scale’s validity and reliability, the revised version of the PBTI scale composed of 51 items and had a 14-factor construct. The 5-point Likert scale is graded from 1= Strongly Disagree to 5= Strongly Agree. Calculations are made with mean score both in factors and the whole scale, and a higher mean score refers to a higher perceived barrier to technology integration.
Discussion and Conclusion
The reflection of rapid developments in technology on educational environments has brought about integration problems. Using a new technology in educational environments without any integration studies suggests that pedagogical approaches, which are very important steps of education, are ignored. In this case, the technologies available in educational environments are neither integrated into the subject content nor take characteristics of the target audience into consideration, and they are just used plainly. However, as Maddux and Johnson (2006) put it, “Technology integration means such use of existing technology that it is not possible to instruct a given course without that technology.” Otherwise, investments in technology in educational environments without adaptation studies become no longer functional and might remain idle in the classrooms by disabling its effective and efficient use.
Considering these possible situations, there are many studies on barriers encountered in technology integration in the literature. These studies address the technology barriers at school and teacher level (Çakıroğlu, 2015), at teacher level (Mishra & Koehler, 2006; Ertmer, 1999; Hendren, 2000; İnan, 2007), at school level (Mazman and Usluel, 2011). It is also stated in the literature that technology barriers are affected by teachers, administrators, personal and institutional factors (Henren, 2000), and these factors are described as internal and external barriers (Hendren, 2000; Ertmer, 1999; Rogers, 2003; Kilinc et al., 2018). It is observed in these studies that barriers at teacher level (age, experience, belief and attitude, preparedness) (İnan, 2007) and at school level (cultural and social impact, institutional support and technological infrastructure) (Mazman and Usluel, 2011) are investigated with different variables. It is accordingly possible to argue that technology integration, which is seen to be so effective in the learning-teaching process, has a complex structure.
observed that they limit the technology integration. According to the studies, it is seen that barriers are generally limited to qualitative approaches and the factors handled with quantitative approaches are limited in putting forth the perceived barriers to technology integration. It was found in the validity and reliability studies that the instrument called “Perceived Barriers to Technology Integration” has a 14-factor construct.
The scale explains an important percentage of the total variance with the factors beliefs in learning-teaching activities-BILTA, beliefs in the expert support-BIES, technological self-efficacy beliefs-TSEB, pedagogical self-efficacy beliefs-PSEB, beliefs in change-BIC, lack of vision-LV, lack of leadership-LL, lack of money-LM, family resistance-FR, lack of training-LT, infrastructure-INF, content-CONT, time-TIME and assessment-ASSES. Moreover, the fit indexes of the “Perceived Barriers to Technology Integration - PBTI” are acceptable and perfect level. The results achieved in regard to the construct validity shows that the scale has convergent and divergent validities. Cronbach’s Alpha and composite internal consistency values of the scale are also acceptable. Finally, it is possible to say that each factor of the scale can be used separately, and how scores obtained in each factor increase is an indicator of the increasing perception of a barrier in that factor.
It is anticipated that the PBTI scale developed by the researchers contributes to the literature for addressing the barriers encountered in technology integration within a broad framework and for being comprehensive and generic. The fact that barriers considered important in technology integration can be handled with a multi-factor instrument is likely to shed light on several studies in the future. Especially in this era of technology, it is important to determine the possible barriers that may arise in the integration of the technologies which are used in educational environments and developing rapidly.
Furthermore, improvement studies both for the institution and its employees can be conducted in parallel with the results to be achieved with this instrument. Consequently, it can be argued that this instrument is considered to have an important role in the theories of technology acceptation and in the diffusion of innovation through many variables and to pave the way for achieving effective results. Future studies and researchers could also be tested the factor structure of the developed scale with in-service teachers in terms of whether to link the differences between candidate and in-service teachers’ perceptions in barriers to technology integration.
Recommendations
Technological barriers are encountered from different perspectives in technology integration Mostly, the studies are conducted with qualitative, and very limited to quantitative studies. Actually, the quantitative studies are parsimony to explain the technology integration into classroom settings. The developed scale contributed to the literature a valid and reliable instrument which measure technological barriers in technology integration with a large perspective, holistically. It is thought that this instrument will be a practical guide for all pre-service teachers, teachers, teacher educators, instructors in “Supporting Technology Integration” from the field of instruction, learning, teaching, curriculum development, learning environments, teacher education, educational technology, educational developments, measurement and evaluation, and educational statistics which are appropriate to the scope of the journal, and may help to get a contribution and high quality studies.
Actually the present paper will help to future research(er)s to investigate the impacts of latest technology on education, and necessary dimensions on the technology integration within the classroom or in a virtual learning environment. The effective and successful technology integration may be reached by minimizing the barriers handled with developed scale structure. Future research(s) could link with the effects on technological barriers on external variables (i.g. motivation, acceptance, satisfaction etc.) could conduct with developed scale, and the success on technology integration could be provided in an effective way.
References
Akbulut, Y. (2010). Sosyal Bilimlerde SPSS Uygulamaları (1. Baskı). İdeal Kültür Yayıncılık: İstanbul. Alkan, C. (2011). Eğitim Teknolojisi. Ankara: Anı Yayıncılık
Alkan, C., Deryakulu, D., & Şimşek, N. (1995). Eğitim teknolojisine giriş. Ankara: Önder Matbaacılık.
Ata, A. & Atik, A. (2017). Eğitsel bir araç ve ortam olarak videonun tarihsel gelişimi. Atatürk İletişim Dergisi, (13), 27-52.
Belland, B. R. (2009). Using the theory of habitus to move beyond the study of barriers to technology integration. Computers & Education, 52(2), 353-364.
Bentler, P.M., & Bonett, D.G. (1980). Significance tests and goodness of fit in the analysis of covariance structures. Psychological Bulletin, 88, 588-606.
Boh, B. (1994). Interactive Educational Technologies in Higher Education. ESP Discussion Paper Series. Washington DC: The World Bank Advisory Service.
Browne, M. W., & Cudeck, R. (1993). Alternative ways of assessing model fit. In: Bollen, K.A., & Long, J.S. (Eds.), Testing structural equation models (pp. 136-162). Beverly Hills, CA: Sage
Brush, T., Glazewski, K. D. & Hew, K. F. (2008). Development of an Instrument to Measure Preservice Teachers' Technology Skills, Technology Beliefs, and Technology Barriers. Computers in the Schools, 25(1), 2, 112-125, DOI: 10.1080/07380560802157972.
Buabeng-Andoh, C. (2012). Factors influencing teachersâ adoption and integration of information and communication technology into teaching: A review of the literature. International Journal of Education
and Development using ICT, 8(1).
Butler, D. L., & Sellbom, M. (2002). Barriers to Adopting Technology for Teaching and Learning. Educase
Quarterly, 2, 22-28.
Büyüköztürk, Ş. (2011). Sosyal Bilimler İçin Veri Analizi El Kitabı. (14. Baskı). Ankara: Pegem Yayınevi. Byrne, B. M. (2006). Structural equation modeling with EQS: Basic concepts, application, and programming
(2nd ed.). Mahwah, NJ: Lawrence Erlbaum.
Çakıroğlu, Ü. (2013). Öğretim teknolojilerinin öğrenme ortamlarına entegrasyonu,(Ed: Çağıltay, K. ve Göktaş, Y.), Öğretim teknolojilerinin temelleri: teorilker, araştırmalar, eğilimler. Ankara: Pegem Akademi, 413-430.
Clark, R. E. (1983). Reconsidering Research on Learning from Media. Review of Educational Research, 53(4), 445-459.
Clark, R. E. (1994). Media will never influence learning. Educational Technology Research and Development, 42(1), 21-29.
Cornu, B. (1995). New technologies: integration into education. In Integrating information technology into education (pp. 3-11). Springer, Boston, MA.
Çetin, Ö., Cakiroglu, M., Bayılmış, C., & Ekiz, H. (2004). Teknolojik Gelisme için Egitimin Önemi ve Internet Destekli Ögretimin Egitimdeki Yeri. TOJET: The Turkish Online Journal of Educational Technology,
3(3).
Davis, F. D. (1986). Technology acceptance model for empirically testing new end-user information systems: Theory and results. MA, USA: Massachussetts Institute of Technology.
Davis, F. D. (1989). Perceived usefulness, perceived ease of use, and user acceptance of information technology. MIS Quarterly, 13, 319–339.
Davis, F. D., Bagozzi, R. P., & Warshaw, P. R. (1992). Extrinsic and intrinsic motivation to use computers in the workplace. Journal of applied social psychology, 22(14), 1111-1132.
Ertmer, P. A. (1999). Addressing first-and second-order barriers to change: Strategies for technology integration. Educational technology research and development, 47(4), 47-61.
Ertmer, P. A., Ottenbreit-Leftwich, A. T., Sadik, O., Sendurur, E., & Sendurur, P. (2012). Teacher beliefs and technology integration practices: A critical relationship. Computers & Education, 59(2), 423-435. Ertmer, P.A. (2005). Teacher pedagogical beliefs: The final frontier in our quest for technology integration?
Educational Technology Research and Development, 53(4), 25–39.
Fornell, C., & Larcker, D. F. (1981). Structural equation models with unobservable variables and measurement error: Algebra and statistics. Journal of marketing research, 18(3), 382-388.
Fraenkel, J. R., & Wallen, N. E. (2006). How to design and evaluate research in education (6th ed.). New York, NY: McGraw-Hill.
Franklin, T., Turner, S., Kariuki, M., & Duran, M. (2001). Mentoring overcomes barriers to technology integration. Journal of Computing in Teacher Education, 18(1), 26-31.
Glaser, R. (1976). Components of a psychology of instruction: Toward a science of design. Review of
Educational Research, 46(1), 29-39.
Groves, M. M., & Zemel, P. C. (2000). Instructional technology adoption in higher education: An action research case study. International Journal of Instructional Media, 27(1), 57.
Hair, J. F. Black, B., Babin, B., Anderson, R. E. & Tahtam, R. L. (2006). Multivariate data analysis. Upper Saddle River: Prentice Hall.
Hendren, K. L. (2000). The effect of first and second order barriers on the ideal and actual integration of computer technology into the high school science classroom.
Hutcheson, G. D., & Sofroniou, N. (1999). The multivariate social scientist: Introductory statistics using
generalized linear models. London: Sage Publications Ltd.
Irvin, R. (2007). Information and communication technology (ICT) literacy: Integration and assessment in higher education. Journal of Systemics, Cybernetics and informatics, 5(4), 50-55.
Jacobsen, D. M. (1998). Adoption Patterns of Faculty who Integrate Computer Technology for Teaching and Learning in higher Education. Retrieved from https://eric.ed.gov/?id=ED428675 on 19.12.2018.
Johnson, L., & Maddux, C. D. (2006). Information technology: Four conditions critical to integration in education. Educational Technology, 46(5), 14-19.
Jonassen, D. H., Campbell, J. P., & Davidson, M. E. (1994). Learning with media: Restructuring the debate.
Educational technology research and development, 42(2), 31-39.
Kilinc, E., Tarman, B., & Aydin, H. (2018). Examining Turkish Social Studies Teachers’ Beliefs About Barriers to Technology Integration. TechTrends, 1-3.
Kline, R. B. (1998). Methodology in the social sciences. Principles and practice of structural equation
modeling. New York, NY, US: Guilford Press.
Kline, R. B. (2011). Principles and practice of structural equation modeling. New York: The Guilford Press. Kopcha, T. J. (2012). Teachers' perceptions of the barriers to technology integration and practices with
technology under situated professional development. Computers & Education, 59(4), 1109-1121. Kozma, R. B. (1991). Learning with Media. Review of Educational Research, 61(2), 179-211.
Kozma, R. B. (1994). The Influence of Media on Learning: The Debate Continues. School Library Media
Research SLMQ 22(4).
Mazman, S. G., & Usluel, Y. K. (2011). Bilgi ve iletişim teknolojilerinin öğrenme-öğretme süreçlerine entegrasyonu: Modeller ve göstergeler. Eğitim Teknolojisi Kuram ve Uygulama, 1(1), 62-79.
Mertler, C. A., & Vanatta, R. A. (2005). Advanced and multivariate statistical methods (3rd Ed.). Glendale, CA: Pyrzcak Publishing.
Mishra, P., & Koehler, M. J. (2006). Technological pedagogical content knowledge: A framework for teacher knowledge. Teachers college record, 108(6), 1017.
Moore, M. (1993). Theory of transactional distance. Retrieved from
<http://www.c3l.unioldenburg.de/cde/support/readings/moore93.pdf> on 19th December, 2018.
Muhametjanova, G. (2014). Barriers and Enablers of Technology Integration into Instruction in the
Kyrgyzstan-Turkey Manas University (Published Doctoral Thesis), The Graduate School of Natural and Applied
Sciences of Middle East Technical University.
Muilenburg, L. Y., & Berge, Z. L. (2005). Student barriers to online learning: A factor analytic study. Distance
education, 26(1), 29-48.
Pierson, M. E. (2001). Technology integration practice as a function of pedagogical expertise. Journal of
research on computing in education, 33(4), 413-430.
Rabah, J. (2015). Benefits and Challenges of Information and Communication Technologies (ICT) Integration in Québec English Schools. Turkish Online Journal of Educational Technology-TOJET, 14(2), 24-31. Rogers, E. M. (1962). Diffusion of innovations (1st ed.). New York: Free Press.
Rogers, E. M. (2003). Diffusion of Innovations (5th ed.). New York, NY: Free Press.
Schermelleh-Engel, K., & Moosbrugger, H. (2003). Evaluating the fit of structural equation models: Tests of significance and descriptive goodness-of-fit measures. Methods of Psychological Research Online, 8(2), 23-74.
Schoepp, K. (2005). Barriers to technology integration in a technology-rich environment. Learning and teaching in higher education: Gulf perspectives, 2(1), 1-24.
Seels, B. & Richey, R. (1994). Instructional Technology: The Definition and Domains of the Field. AECT. Sharp, V. F. (2002). Computer Education for Teachers :Integrating Technology Into Classroom, Boston:
McGraw-Hill
Simon, H. (1981). The sciences of the artificial (2nd ed.). Cambridge, MA: MIT Press.
Steiger, J. H. (2007). Understanding the limitations of global fit assessment in structural equation modeling.
Personality and Individual Differences, 42(5), 893-98.
Tanaka, J. S. & Huba, G. J. (1985). A fit index for covariance structure models under arbitrary GLS estimation.
British Journal of Mathematical and Statistical Psychology, 38, 197–201.
Yakar, H. G. İ. (2013). Sinema Filmlerinin Eğitim Amaçli Kullanimi: Tarihsel Bir Değerlendirme. Journal of
Hasan Ali Yücel Faculty of Education/Hasan Ali Yücel Egitim Fakültesi Dergisi (HAYEF), 10(1).
Yalin, H. I., Karadeniz, S., & Sahin, S. (2007). Barriers to information and communication technologies integration into elementary schools in Turkey. Journal of Applied Sciences, 7(24), 4036-4039.
Wang, Q. (2008). A generic model for guiding the integration of ICT into teaching and learning. Innovations in
education and teaching international, 45(4), 411-419.
Wozney, L., Venkatesh, V., & Abrami, P. (2006). Implementing computer technologies: Teachers’ perceptions and practices. Journal of Technology and Teacher Education, 14(1), 173–207.
Author Information
Ugur BasarmakKirsehir Ahi Evran University Faculty of Education
Department of Computer and Instructional Technology Bagbasi Yerleskesi, Kırsehir, Centre, 40100
Kirsehir Turkey
Nazire Burcin Hamutoglu
Kirsehir Ahi Evran University Faculty of Education
Department of Computer and Instructional Technology Bagbasi Yerleskesi, Kırsehir, Centre, 40100
Kirsehir
Contact e-mail: [email protected] or
Appendix. Perceived Barriers to Technology Integration (PBTI) Scale
Beliefs towards Learning-Teaching Activities
Str o ng ly dis a g re e (1 ) Dis a g re e (2 ) Neut ra l (3 ) Ag re e (4 ) Str o ng ly Ag re e (5 )
1. I believe that the use of technology in learning-teaching activities enhances learning.
( ) ( ) ( ) ( ) ( )
2. I believe that it is easy to design learning activities by using technology.
( ) ( ) ( ) ( ) ( )
3. I believe that technology facilitates my work just like a teacher.
( ) ( ) ( ) ( ) ( )
4. I believe that use of technology in learning-teaching activities supports students’ advanced thinking skills (creative thinking, problem-solving skills, critical thinking, etc.).
( ) ( ) ( ) ( ) ( )
Beliefs towards Expert Support
Str o ng ly dis a g re e (1 ) Dis a g re e (2 ) Neut ra l (3 ) Ag re e (4 ) Str o ng ly Ag re e (5 )
1. I believe that it makes my job easier to ask for expert support when using technology.
( ) ( ) ( ) ( ) ( )
2. I believe that expert support is important in selecting technology appropriate for content.
( ) ( ) ( ) ( ) ( )
3. I believe that expert support is important in planning technology appropriate for content.
( ) ( ) ( ) ( ) ( )
4. I believe that expert support is important in using instructional technology.
( ) ( ) ( ) ( ) ( )
5. I believe that I will get rid of my concerns about the use of technology in my courses by taking expert support.
( ) ( ) ( ) ( ) ( )
6. I believe that expert support is important in demonstrating my competence in technology.
( ) ( ) ( ) ( ) ( )
7. Having expert support makes me feel safe about using technology.
( ) ( ) ( ) ( ) ( )
8. I do not think that resources are reliable without expert support.
( ) ( ) ( ) ( ) ( )
9. I believe that expert support is important in the emergence of new ideas about the use of technology.
Technological Self-Efficacy Beliefs S tr o n g ly d isa g re e (1 ) Disa g re e (2 ) Ne u tr a l (3 ) Ag re e (4 ) S tr o n g ly Ag re e (5 )
1. I do not know how technology is used in courses. ( ) ( ) ( ) ( ) ( ) 2. I feel lacking in using technology in courses. ( ) ( ) ( ) ( ) ( ) 3. I worry about using technology in my courses. ( ) ( ) ( ) ( ) ( ) 5. When I need to use technology in my courses, I feel afraid of
doing it wrong.
( ) ( ) ( ) ( ) ( )
Pedagogical Self-Efficacy Beliefs
S tr o n g ly d isa g re e (1 ) Disa g re e (2 ) Ne u tr a l (3 ) Ag re e (4 ) S tr o n g ly Ag re e (5 )
1. When using technology, I consider the characteristics of the target group.
( ) ( ) ( ) ( ) ( )
2. I care about the attainments of the subject while using technology in the course.
( ) ( ) ( ) ( ) ( )
3. The features of the classroom environment are important to me when using technology in the course.
( ) ( ) ( ) ( ) ( )
4. Teaching methods appropriate for the course objectives are effective in my choice of technology.
( ) ( ) ( ) ( ) ( )
5. The assessment-evaluation approach in accordance with the course objectives is effective in my choice of technology.
( ) ( ) ( ) ( ) ( )
Belief towards Change
Str o ng ly dis a g re e (1 ) Dis a g re e (2 ) Neut ra l (3 ) Ag re e (4 ) Str o ng ly Ag re e (5 )
1. I believe that the use of technology will not bring success right away.
( ) ( ) ( ) ( ) ( )
3. Although I use technology in the courses, I believe that change takes time.
( ) ( ) ( ) ( ) ( )
Lack of Vision
S tr o n g ly d isa g re e (1 ) Disa g re e (2 ) Ne u tr a l (3 ) Ag re e (4 ) S tr o n g ly Ag re e (5 )
1. The institution I work for expects me to use technology effectively.
( ) ( ) ( ) ( ) ( )
2. The administrators in my institution support me to use technology.
( ) ( ) ( ) ( ) ( )
3. I find it logical to use technology in my courses in the institution I work for.
Lack of Leadership Str o ng ly dis a g re e (1 ) Dis a g re e (2 ) Neut ra l (3 ) Ag re e (4 ) Str o ng ly Ag re e (5 )
2. The managers/administrators of the institution do not insist on us using technology in the courses.
( ) ( ) ( ) ( ) ( )
3. Using technology in courses is optional. ( ) ( ) ( ) ( ) ( ) Lack of Money
Str o ng ly dis a g re e (1 ) Dis a g re e (2 ) Neut ra l (3 ) Ag re e (4 ) Str o ng ly Ag re e (5 )
1. If it is important to use a new technology in the course, institution managers/administrators procure that technology.
( ) ( ) ( ) ( ) ( )
3. Even if the budget is limited, the use of technology in the courses is in the forefront.
( ) ( ) ( ) ( ) ( ) Family Resistance Str o ng ly dis a g re e (1 ) Dis a g re e (2 ) Neut ra l (3 ) Ag re e (4 ) Str o ng ly Ag re e (5 )
2. Families do not insist on using new technologies. ( ) ( ) ( ) ( ) ( ) 3. Families resist children’s desire to use a new technology. ( ) ( ) ( ) ( ) ( )
4. Families do not tolerate the use of a new technology by their children.
( ) ( ) ( ) ( ) ( )
5. Families see technology as something new and unnecessary. ( ) ( ) ( ) ( ) ( ) 6. The idea that children can learn without the technology is
dominant in families.
( ) ( ) ( ) ( ) ( )
Lack of Training
Str o ng ly dis a g re e (1 ) Dis a g re e (2 ) Neut ra l (3 ) Ag re e (4 ) Str o ng ly Ag re e (5 )
1. I think that the training I received in the use of technology is easily applicable in the classroom.
( ) ( ) ( ) ( ) ( )
2. I think that I have been sufficiently trained in the skills required to use technology.
Infrastructure Str o ng ly dis a g re e (1 ) Dis a g re e (2 ) Neut ra l (3 ) Ag re e (4 ) Str o ng ly Ag re e (5 )
3. Our schools do not have enough infrastructure such as hardware, software, Internet access, etc.
( ) ( ) ( ) ( ) ( )
4. Access to computer laboratories in schools is insufficient. ( ) ( ) ( ) ( ) ( ) 5. Software on computers in laboratories is not up to date. ( ) ( ) ( ) ( ) ( ) 6. Laboratories do not have a fast Internet infrastructure. ( ) ( ) ( ) ( ) ( )
Content Str o ng ly dis a g re e (1 ) Dis a g re e (2 ) Neut ra l (3 ) Ag re e (4 ) Str o ng ly Ag re e (5 )
9. I have the appropriate curriculum content for the technology I use in the course.
( ) ( ) ( ) ( ) ( )
11. I think that the technology to be used in the course and the content to be taught complement each other.
( ) ( ) ( ) ( ) ( )
12. I think that the current technology is useful for teaching. ( ) ( ) ( ) ( ) ( )
Time Str o ng ly dis a g re e (1 ) Dis a g re e (2 ) Neut ra l (3 ) Ag re e (4 ) Str o ng ly Ag re e (5 )
15. Technology integration takes less time than I thought. ( ) ( ) ( ) ( ) ( ) 16. I have time to learn how to integrate technology into my
courses.
( ) ( ) ( ) ( ) ( )
17. I have time to plan/prepare the courses in which I use technology. ( ) ( ) ( ) ( ) ( ) Assessment Str o ng ly dis a g re e (1 ) Dis a g re e (2 ) Neut ra l (3 ) Ag re e (4 ) Str o ng ly Ag re e (5 )
1. The use of technology in schools serves the assessment process rather than the teaching process.
( ) ( ) ( ) ( ) ( )
2. The main purpose of using technology in schools is based on the assessment of the courses.
( ) ( ) ( ) ( ) ( )
3. Since teachers focus on multiple-choice exams, which are success indicators, to meet standards, there is no need to use technology in courses.
![Evaluation of immunoglobulin G complexed form of thyroid stimulating hormone [MACRO TSH] as interference in TSH assay](data:image/gif;base64,R0lGODlhAQABAIAAAP///wAAACH5BAEAAAAALAAAAAABAAEAAAICRAEAOw==)