115
SOME CONSIDERATIONS OF PRIMARY CORN OFFER IN OLT COUNTY
(2009 - 2011)
MEDELETE D.M., PÂNZARU R.L.
Faculty of Agriculture and Horticulture, University of Craiova
Key words: corn, area, total production, average production
ABSTRACT
This paper aims to highlight the place and role of Olt County, in the regional production of corn. For this, in the interval 2009 - 2011, are analyzed the components of primary offer maize cultivated area, total production and average yield.
Choosing the theme is based on the fact that Olt is a representative area for development region South - West Oltenia, with significant agricultural potential, given its surface, and productive potential. It is worth mentioning that the county has substantial potential also in terms of qualitative aspects that can be achieved in the production of corn.
INTRODUCTION
The importance and economic benefits of corn production arising from its use or intended versatility: fodder, industrial, agricultural technology - technological item for export and source of profit for farms.
Factors profitability and economic efficiency in the production of maize grain are: average yield per hectare, production management and marketing costs.
Deals on agricultural commodity markets is dispersed and irregular quantitatively. Production volume depends on one hand of technique equipment and on the other hand of the climate and biological conditions that are random printing of these commodity markets in agriculture, a highly mobile character. Quantitative offer of retail product market depends primarily on the benefit that it will achieve the entrepreneur.
Short-term supply of agricultural products is available depending on climatic and seasonal factors and the level of inventories in agricultural products in stock. For those perishable agricultural products, whose storage is difficult (fruits, vegetables, etc.), the supply is rigid. For short supply of agricultural products, especially when these perishable agricultural products, is the total quantity of products harvested (for some products require quick sale thereof).
METHOD AND MATERIAL
For carrying out the study are use a system of indicators to highlight specific primary offer of corn - cultivated area, total production and average yield.
Quantitative data on the volume recorded for the county and region, were taken as sources indicated.
The information refers to the time interval 2009-2011, in addition to it being used period average.
Average was determined according to the following relation for calculating:
𝑀 =𝑋1+ 𝑋2+. . . . +𝑋𝑛 n
RESULTS AND DISCUSSIONS
116
Table 1. OLT COUNTY, CORN - Cultivated area (ha)
No. Year Effective
Dynamic %
beside regional
level
Ibf Ibm
1 2009 101331 100 100 26,5
2 2010 100221 98,9 98,9 36,3
3 2011 73653 72,7 73,5 19,1
4 AVERAGE
2009-2011 91735 90,5 124,6 26,3
*http://www.olt.insse.ro/main.php?lang=fr&pageid=436
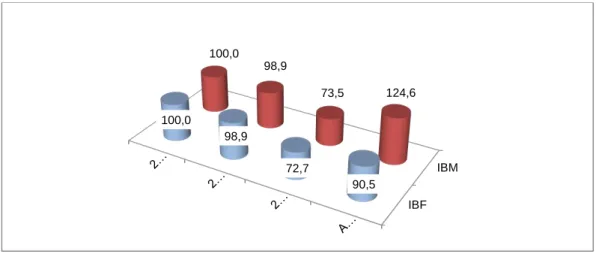
The indicator averaged 91735 ha, a level which is based on the annual cultivated area: 73653 ha in 2011, 100221 ha and 101 331 ha in 2010 for 2009.
Dynamics of the indices is dominated by the subunit levels components, except those with mobile based for period average - 124.6% comparing to the previous term of the dynamic series (2012). Decreases to basis reporting was 1.1% in 2010, 27.3 and 26.5% in 2011 and 9.55% when compared to the first term period average of the series dynamic - Fig.1.
FIG. 1. CORN. OLT COUNTY - the dynamic of cultivated area (%)
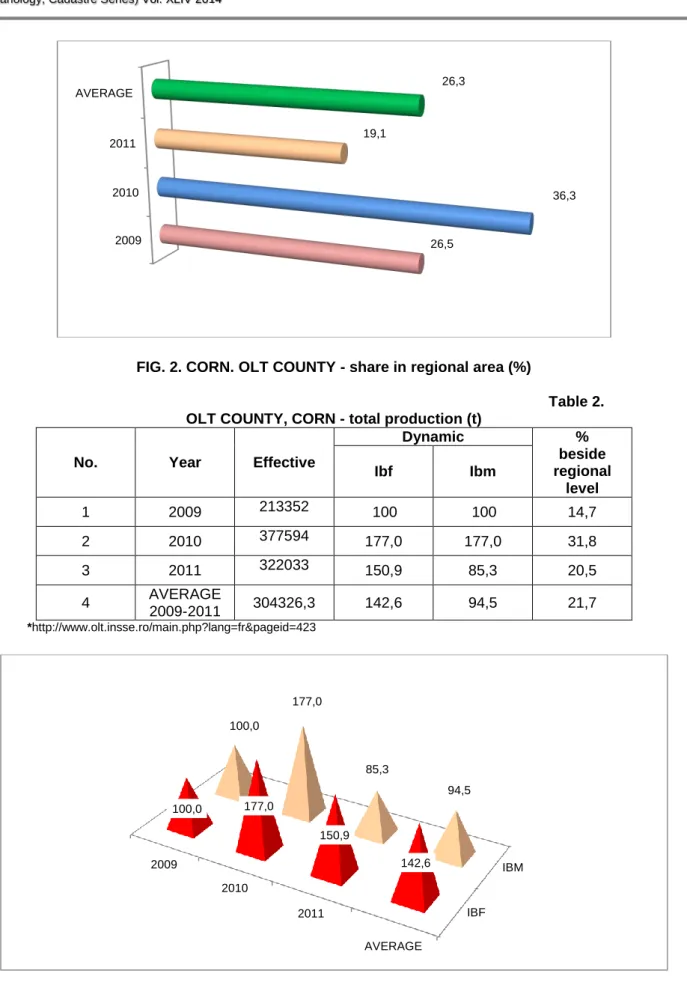
Analyzing the situation of Olt County in regional context, it may be noted that it held shares - in the regional total area planted with corn - of: 19.1% in 2011, 26.3% for the period average, 26.5% for 2009, 36.3% in 2010 - fig. 2.
Table 2 shows the quantities of maize obtained in Olt county, during the interval 2009-2012.
Indicator had limits of variation from 213352 t in 2009 to 377594 t in the case of 2010, the average indicator being 304,326.3 t.
Evolution in time of the total production of maize is one uneven the growth in 2010 (+ 77.0%), being followed by declines in 2012 (-14.7% compared to previous of dynamic series. Average outruns by 1.42 times the first term of the series dynamical, but is lower by 4.5% to the specific situation of 2012 - fig. 3.
IBF IBM 100,0
98,9
72,7
90,5 100,0
98,9
117
FIG. 2. CORN. OLT COUNTY - share in regional area (%)
Table 2. OLT COUNTY, CORN - total production (t)
No. Year Effective
Dynamic %
beside regional
level
Ibf Ibm
1 2009 213352 100 100 14,7
2 2010 377594 177,0 177,0 31,8
3 2011 322033 150,9 85,3 20,5
4 AVERAGE
2009-2011 304326,3 142,6 94,5 21,7
*http://www.olt.insse.ro/main.php?lang=fr&pageid=423
FIG. 3. CORN. OLT COUNTY - Dynamics of total production (%)
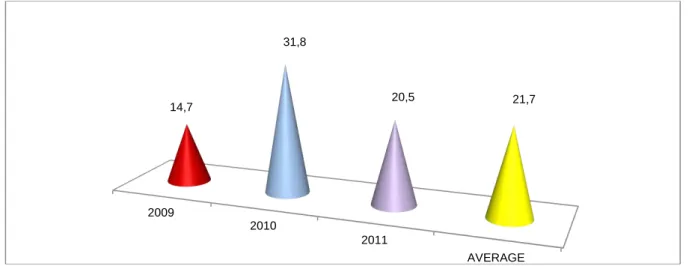
Compared to the regional situation, Olt County is 21.7% of the total production of maize (for average period). As the limits of variation in the structure of regional production
2009 2010 2011 AVERAGE
26,5
36,3 19,1
26,3
IBF IBM 2009
2010
2011
AVERAGE
100,0 177,0
150,9
142,6 100,0
177,0
85,3
118
Fig. 4.
FIG. 4. CORN. OLT COUNTY - share in regional production (%)
Based on data for the total cultivated area and production, we determined the average production per hectare. The data are presented in Table 3.
Table 3. OLT COUNTY, CORN - Average yield (kg / ha)
No. Year Effective
Dynamic %
beside regional
level
Ibf Ibm
1 2009 2105 100 100 55,4
2 2010 3768 179,0 179,0 87,6
3 2011 4384 208,3 116,4 108,0
4 AVERAGE
2009-2011 3318 157,6 75,7 82,3
*http://www.olt.insse.ro/main.php?lang=fr&pageid=434
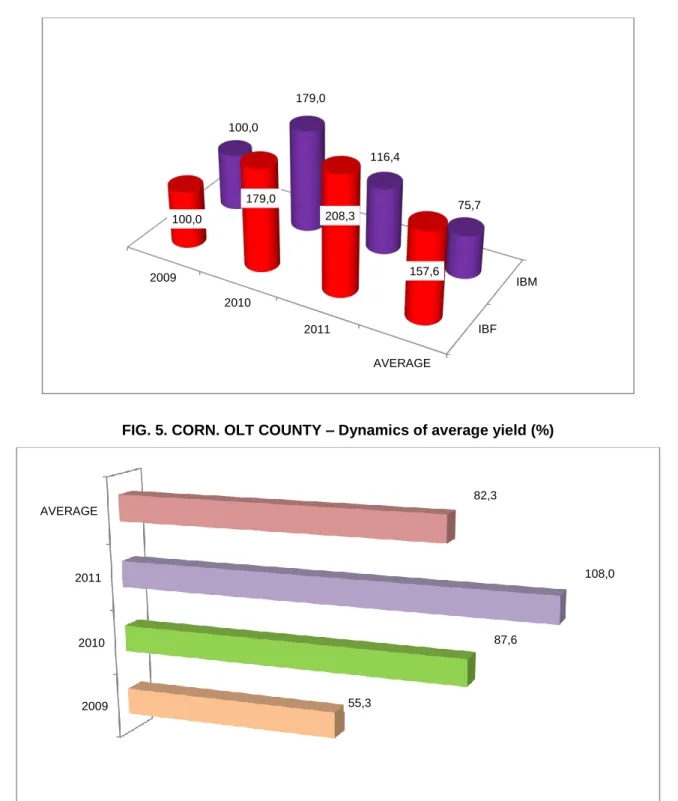
Average yield per hectare ranged between 2105 kg in 2009 to 4384 kg for 2011, while the average period reached 3318 kg (given that in 2010 the indicator recorded 3768 kg).
Evolution of the average production over time is emphasized by the indices that make up the dynamics. It can be seen that it is dominated by levels supra-unitary, sub-unitary being specific only compared with the previous terms, for period average of the dynamical series - 75.7%. Advancing bases of comparison were 1.79 times in 2010, 2.08 and 1.16 times in 2011, 1.57 times the average period (compared to the first term of the series dynamical - 2009) - Fig. 5.
Compared to the regional situation may be observed generally subunit levels - 55,4,82,3 and 87.6% in 2009 for period average and 2010 - exceeding the reporting term being specified only for 2011-108.0% - fig. 6.
2009
2010
2011
AVERAGE 14,7
31,8
119
FIG. 5. CORN. OLT COUNTY – Dynamics of average yield (%)
FIG. 6. CORN. OLT COUNTY - Positioning compared to regional average yield (%)
CONCLUSIONS
- surface cultivated with corn has evolved strictly downward during the analyzed period, successive annual declines being 1.1 and 26.5% in 2010 respectively 2011 compared with bases of reporting;
- corn was cultivated on 27.43% of arable land under cultivation (334397.7 ha), culture holding at the level of cereal sector a weight of 36.02% (from 254665 ha - second place after wheat 55.13% meaning 140404.7 ha);
IBF IBM 2009
2010
2011
AVERAGE 100,0
179,0
208,3
157,6 100,0
179,0
116,4
75,7
2009 2010 2011 AVERAGE
55,3
87,6
120
spectacular increases in 2010 (+ 77.0%), followed by important decreases for 2011 (-14.7% compared to the previous term of dynamic series );
- corn accounted 42.07% of the county grain (723351.7 t), being exceeded by wheat product with a share of 50.40% (354591.7 t);
- Average production per productive unit (hectare), experienced an upward trend, successive annual increases being 79.0 and 16.4% for indicator in the years 2010 and 2011 compared to previous terms of the dynamical series (1603 and 616 kg).
BIBLIOGRAPHY
1. Barbu C., Pânzaru R.L., 2000, Agrarian Economy, Hyperion Publishing House, Craiova
2. Dona, I., Rural economy, 2000, Economic Publishing House, Bucharest
3. Gavrilescu D. contributors, 2000, Agro food economy, Expert Publishing House, Bucharest ,
4. Ştefan G., 2006, Agrarian Economy, Junimea Publishing House, Iaşi
5. Ştefan G., Toma A.D., Pânzaru R.L., 2006, Economy and agro food policies, Alfa Publishing House, Iaşi