ADOPTION OF VARIABLE RATE TECHNOLOGY
Isti Surjandari
1and Marvin T. Batte
21
Industrial Engineering Department, Faculty of Engineering, University of Indonesia, Depok 16424, Indonesia
2
AED Economics, The Ohio State University, OH 43210, USA
E-mail: [email protected]
Abstract
Site Specific Management (SSM), which also variously referred to as Variable Rate Technology (VRT), is an emerging technology that enables producers to make more precise input application decisions based on soil and field characteristics. This study analyzes factors influencing the adoption of VRT for fertilizer application for cash grain production in Ohio. Results show that producer and field characteristics might influence the adoption decision on various SSM components differently. It also provides insight as to the sequence of adoption of SSM component technologies and how this sequence might differ for producers of differing characteristics.
Keywords: grid soil sampling, variable rate technology, yield monitor
1. Introduction
Global Positioning Systems (GPS) and Geographical
Information Systems (GIS) are two key technologies
that enable the emergence ofSite-Specific Management
(SSM) technology. While GPS allows producers to identify field locations so that inputs can be applied appropriately to individual field locations, GIS technology allows users to store field input and output data as separate layers in a digital map and to retrieve and utilize these data for future input allocation decisions [1]. With the availability of supporting technologies, SSM allows producers to (1) capture detailed field spatial data, (2) interpret and analyze that data, and (3) implement an appropriate management response based on the information.
SSM is not simply a single technology, but rather a suite of technologies that allows producers to monitor and control farm management factors. Various components of SSM may be adopted as a package. However, some components may require adoption of other components. For instance, in order to allow variable application of fertilizer inputs, data are needed on which to base fertilizer recommendations. These fertility data could be developed from grid soil sampling, or estimated from yield monitoring data or aerial or satellite imagery.
Currently, many producers hire VRT service providers to do the applications. This may be the highest profit alternative for small and moderate sized farms due to the high fixed investment cost for purchasing VRT
applicators. In fact, producers may choose to adopt SSM technologies as a package of services provided by custom applicators including grid soil sampling, data analysis, input recommendations, and variable rate input applications.
Grid Soil Sampling (GSS) involves dividing a field into square sections of certain acreage and gathering soil samples from each section. With the aid of DGPS as a positioning system, producers can identify the location of each grid. Another method to get fertility data is by using yield monitor equipped with DGPS to measure and record yields on-the-go, which enable producers to
generate a Site-Specific Yield Map and to be used as the
basis for future input decisions.
In spite of its potential benefits, SSM is still early in the diffusion process; in fact, recent studies show low rates of SSM adoption. In addition, the adoption rates vary greatly across states for each technology components. The objective of this study is to analyze factors that may influence the adoption of SSM for fertilizer application for cash grain production in Ohio. Because VRT is relatively new technology, the results of this study will contribute to the research literature for evaluating factors that influence VRT adoption and will aid the development of policies that can mitigate the obstacles to adoption. Information about types of producers more likely to adopt will also provide useful guides to industry participants involved with this rapidly growing new technology.
2. Methods
To examine the interaction of various producer and field characteristics in determining VRT for fertilizer
adoption, a Multinomial Logit model is used in this
analysis. Fertilizer is defined for the purpose of this study as lime, nitrogen, phosphorus, or potassium. Five categories of adoption choices are represented in the dependent variable: (0) non adopter, (1) adopter of grid soil sampling, (2) adopter of yield monitor, (3) adopter of grid soil sampling and VRT, (4) adopter of yield monitor and VRT, (5) adopter of grid soil sampling, yield monitor and VRT.
Most studies of technology adoption have focused either on a single new technology or a package of new technologies as a single unit. In the case where it is possible to adopt part of the technologies, as in SSM, considering the adoption as a single unit may disregard the economic information contained in the adoption decisions. The operational model most often used for multiple adoption choices is Multinomial Logit model.
Another alternative is to use Nested Logit model.
Unlike the Multinomial Logit model where the choice probabilities depend on individual characteristics only, the Nested Logit model considers the effects of choice characteristics on the determinants of choice probabilities as well. Thus, the main use of Nested Logit is to predict the probability of choice for a category not considered in the estimation procedure but
for which we are given the vector of characteristics xij,
that is, the vector of the values of characteristics for
choice j as perceived by individual i [2]. Since the main
objective of this study is to analyze the adoption decisions of SSM technologies given the individual characteristics, the Multinomial Logit is more appropriate for this analysis.
The explanatory variables used in this study to explain adoption of VRT include proxies for production and human capital, innovativeness, field characteristic and location. Variables used in the analysis are identified in Table 1.
Production capital is represented by farm size, size of livestock enterprise, and tillable acreage. Farms size in this study measured as total acres farmed. Size of livestock enterprise in this study is measured by the percentage of farm sales from livestock products. Tillable acreage, which is measured as the percentage of tillable acreage to total acres farmed, is used to modify the effective size of the crop enterprise and as a proxy for topography and land quality.
The availability of human capital is indicated by education level and age of farm operator, and whether the farm operator work off-farm. Number of owner
Table 1: Definition of Dependent and Explanatory Variables
Variables and Description Abbreviation
Dependent:
i = 0 Non adopter
i = 1 Adopter of grid soil sampling GSS
i = 2 Adopter of yield monitor YM
i = 3 Adopter of grid soil sampling and VRT
GSS+VRT
i = 4 Adopter of yield monitor and VRT
YM+VRT
i = 5 Adopter of grid soil sampling, yield monitor and VRT
GSS+YM+VRT
Explanatory:
− Farm size as measured by total acres farmed
ACRES
- Percentage of farm sales from livestock products
LIVESTK
- Percentage of tillable acreage to total acres farmed
TILL
- Education level (1 if post-high school; 0 otherwise)
EDUCATE
- Age of the primary operator AGE
- Off-farm work (1 if part-time farmer; 0 otherwise)
PTIME
- Number of owners (1 if multiple owner; 0 if sole owner)
OWNER
- Percentage of rented acres to total acres farmed
TENANCY
- Computer use for farm business (1 if use; 0 otherwise)
COMP
- Farm location (1 for Ohio Corn Belt region; 0 otherwise)
CBELT
and method of land control are also included in this analysis. Method of land control in this study is captured by tenancy, which is measured by the percentage of total land controlled by lease.
Computer use for farm business is used as a proxy for innovativeness. In terms of VRT, computer and its mapping software are essential in providing useful information to base input recommendations.
Farm location may affect the adoption of new technology. A dummy variable is used to capture the effect of region by separating respondents into those having farm location in the Corn Belt region and those who are not.
An initial mailing and a follow-up card were used in this survey. Responses were received from 1355 (54.20%) farmers. Seven hundred seventy six respondents were actively farming and completed the survey.
Average farm size for the respondents is 535 acres with a range of five to 6,650 acres. Respondent age ranged from twenty-two to eighty-four years, with a mean of fifty-two years. Nearly 18% of the respondents were under forty years of age. About 27% were sixty years or older. Sixty-three percent had education levels of high school or less, and 6.4% had post-baccalaureate education levels. Nearly 75% of the respondents are sole owners of a farming business. Nearly 30% worked part or full time off the farm. About fifty percent reported no livestock enterprise on their farm.
Farmers were asked about their adoption decisions for geo-referenced grid soil sampling, yield monitor and for one or more of VRT for nutrient applications (i.e., VRT for lime, nitrogen, phosphorus, or potassium). After adjusting for missing values, of the 776 farmers, 95 have adopted either grid soil sampling or yield monitors or both, 59 have adopted VRT, and 608 have adopted neither.
3. Results and Discussion
The probabilities of five categories of responses: (0) Non Adopter, (1) GSS Adopter, (2) YM Adopter, (3) GSS + VRT Adopter, (4) YM + VRT Adopter, and (5)
GSS + YM + VRT Adopter are represented by P0, P1,
P2, P3, P4, and P5, respectively. Ln (Pi/Pj) is the natural
logarithm of the probability of a category i relative to
the probability of a category j. All categories are
mutually exclusive. The maximum likelihood (ML) parameter estimates of the Multinomial Logit model and their asymptotic t-statistics for adoption of the four SSM technology components (category 1 to 5) relative to non-adoption (category 0) are reported in table 2. The lower panel of table 2 provides an estimate of the impact of the explanatory variable on the probability of adoption of one SSM component relative to another. Table 3 summarized the ML estimates of each category response.
The goodness of fit of the estimated model is examined by testing a hypothesis that all slope coefficients are zeros simultaneously. This has been done using the log-likelihood ratio (LR) test [3]. The LR test statistic is defined as:
[
]
2) ( ) 0 (
2 −
β
≈χ
υ−
= L L )
LR (1)
where ν is the number of restrictions, L(β) is the value
of the estimated log-likelihood function, and L(0) is the value of log-likelihood function when all slope
coefficients are restricted to zero. In this model, the estimated LR statistic is 157.155. This implies rejection of the null hypothesis at the 0.01% level of significance, indicating a good fit of the estimated model.
Farm size was hypothesized to be an important determinant of SSM adoption. The adoption of modern technologies like VRT or yield monitoring generally involves fixed investment in equipment and learning. Because such costs are largely fixed, they represent a greater impact on the average total cost of a smaller farm than of a larger farm. In the case where custom applicators provide variable rate applications on a per acre basis, the custom operator provides both the equipment and the knowledge. Hence, most of the costs of this service are variable (priced per acre of contract) and the comparative advantage of large farms for the adoption of VRT may be reduced. This is also the case for grid soil sampling, where farmers typically hire a custom applicator or input supply dealer to do the grid soil sampling. On the other hand, farmers typically operate the combine when harvesting their crop, and must own and operate the yield monitor. The costs of monitor ownership and acquisition of the knowledge to use it are fixed and thus favor the larger farmer. Larger farm operators are also suggested to be more innovative and more open to early adoption of new technologies [4].
The empirical evidence supports the argument that farm size does influence the adoption decision. When comparing adoption of a component of SSM relative to
no adoption (e.g., Pi/P0), farm size is statistically
significant in three of the five equations.
As total acres farmed increases, farmers are more likely to adopt YM, YM + VRT, or GSS + YM + VRT. Farm size is also significant in explanation of the sequence of adoption of SSM components. For instance, as farm size increases, farmers are more likely to adopt
YM+VRT relative to GSS + VRT (P4/P3) or GSS + YM
+ VRT relative to GSS + VRT (P5/P3). Thus, size is
most important in explanation of yield monitor adoption, where the fixed cost component is likely to be greatest.
The percentage of farm sales arising from livestock products was included as an indication of the degree of importance of cropping activities on the farm. This variable was significant in only one equation. Farmers having a larger percentage of sales from livestock are less likely to adopt a yield monitor. This result is understandable due the fact that yield monitors were primarily developed for crop management.
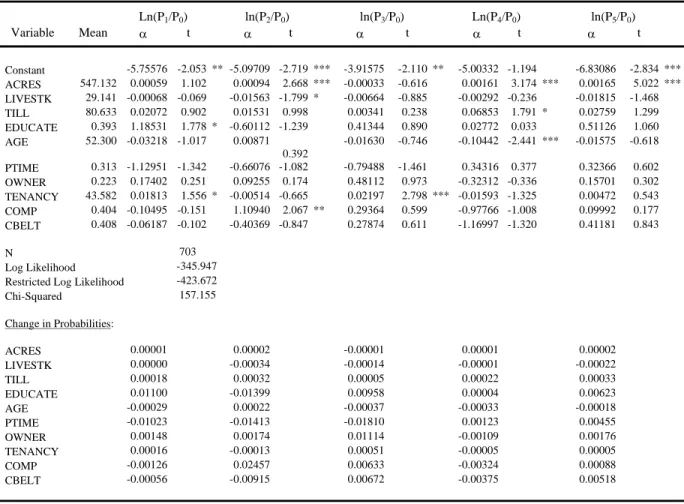
Table 2: Multinomial Logit Analysis of VRT Adoption
Ln(P1/P0) ln(P2/P0) ln(P3/P0) Ln(P4/P0) ln(P5/P0)
Variable Mean α t α t α t α t α t
Constant -5.75576 -2.053 ** -5.09709 -2.719 *** -3.91575 -2.110 ** -5.00332 -1.194 -6.83086 -2.834 *** ACRES 547.132 0.00059 1.102 0.00094 2.668 *** -0.00033 -0.616 0.00161 3.174 *** 0.00165 5.022 *** LIVESTK 29.141 -0.00068 -0.069 -0.01563 -1.799 * -0.00664 -0.885 -0.00292 -0.236 -0.01815 -1.468 TILL 80.633 0.02072 0.902 0.01531 0.998 0.00341 0.238 0.06853 1.791 * 0.02759 1.299 EDUCATE 0.393 1.18531 1.778 * -0.60112 -1.239 0.41344 0.890 0.02772 0.033 0.51126 1.060 AGE 52.300 -0.03218 -1.017 0.00871
0.392
-0.01630 -0.746 -0.10442 -2.441 *** -0.01575 -0.618
PTIME 0.313 -1.12951 -1.342 -0.66076 -1.082 -0.79488 -1.461 0.34316 0.377 0.32366 0.602 OWNER 0.223 0.17402 0.251 0.09255 0.174 0.48112 0.973 -0.32312 -0.336 0.15701 0.302 TENANCY 43.582 0.01813 1.556 * -0.00514 -0.665 0.02197 2.798 *** -0.01593 -1.325 0.00472 0.543 COMP 0.404 -0.10495 -0.151 1.10940 2.067 ** 0.29364 0.599 -0.97766 -1.008 0.09992 0.177 CBELT 0.408 -0.06187 -0.102 -0.40369 -0.847 0.27874 0.611 -1.16997 -1.320 0.41181 0.843
N 703
Log Likelihood -345.947
Restricted Log Likelihood -423.672
Chi-Squared 157.155
Change in Probabilities:
ACRES 0.00001 0.00002 -0.00001 0.00001 0.00002
LIVESTK 0.00000 -0.00034 -0.00014 -0.00001 -0.00022
TILL 0.00018 0.00032 0.00005 0.00022 0.00033
EDUCATE 0.01100 -0.01399 0.00958 0.00004 0.00623
AGE -0.00029 0.00022 -0.00037 -0.00033 -0.00018
PTIME -0.01023 -0.01413 -0.01810 0.00123 0.00455
OWNER 0.00148 0.00174 0.01114 -0.00109 0.00176
TENANCY 0.00016 -0.00013 0.00051 -0.00005 0.00005
COMP -0.00126 0.02457 0.00633 -0.00324 0.00088
CBELT -0.00056 -0.00915 0.00672 -0.00375 0.00518
One, two, and three asterisks indicate coefficients that are statistically different from zero at the 0.1, 0.05, and 0.01 levels of probability, respectively.
Table 3: Summary of Multinomial Logit Analysis of VRT Adoption
Ln Ln Ln Ln Ln Ln Ln Ln Ln Ln Ln Ln Ln Ln Ln
P1/P0 P2/P0 P3/P0 P4/P0 P5/P0 P2/P1 P3/P1 P4/P1 P5/P1 P3/P2 P4/P2 P5/P2 P4/P3 P5/P3 P5/P4
Constant - - - -
ACRES + + + + - + + +
LIVESTK -
TILL + +
EDUCATE + - + +
AGE - - - +
PTIME
OWNER
TENANCY + + - + - + -
COMP + -
CBELT +
total farm that is suitable for cropping. Tillable percent is significant in two equations. Farmers with higher percentage of tillable acreage are more likely to adopt
YM + VRT relative to no adoption (P4/P0). They also
more likely to adopt YM + VRT relative to GSS + VRT
(P4/P3). This may be due in part to the economies of
size impact on investment costs. With all else equal, the larger the percent of the farm that is tillable, the larger is the acreage over which investment costs are spread.
Education level is positively associated with grid soil sampling adoption. Farmers with more formal education are more likely to adopt GSS relative to
non-adoption (P1/P0). They also more likely to adopt GSS
relative to YM (P1/P2), GSS + VRT relative to YM
(P3/P2), and GSS + YM + VRT relative to YM (P5/P2).
Thus, it appears that if the SSM system is being adopted in sequential fashion over time, the more highly educated farmer will likely first adopt the GSS or GSS and VRT components prior to adopting yield monitoring. Grid soil sampling provides extensive information about field and soil characteristics and nutrient inventories. It can therefore reveal more to a well-educated farmer who understands soil chemical properties and the principles of crop nutrition than might be evident to someone with less education. Yields maps, on the other hand, are very illuminating of differences in yield performance of various field locations, but provide little in explanation of these differences.
Operator age typically is not a significant determinant of technology adoption [4]. However, others have found age to be an important explanatory variable when the technology is complex and requires mastery of new knowledge and skills. With all else equal, older farmers were less likely to adopt YM + VRT relative to no
adoption (P4/P0), less likely to adopt YM + VRT relative
to YM alone (P4/P2) or relative to GSS + VRT (P4/P3),
but more likely to adopt GSS + YM + VRT relative to
YM + VRT (P5/P4). If one considers that grid soil
sampling is usually done under contract by a local coop or consultant, the requirements for new knowledge are minimal. Similarly, most farmers in our sample contracted with a local service provider to provide variable rate fertilizer applications. In this setting the
GSS and VRT services can be viewed as turnkey
technologies that require little new knowledge to implement. However, farmers typically operate yield monitors themselves. Moreover, the farmer must learn to transfer the yield data to a geographic information system, to generate maps, and to perform other analytical chores in order to generate information from this voluminous data. Hence, adoption of this technology may require new skills leading to high learning costs. Older farmers who have shorter time horizon may find that adopting VRT based on yield data as not profitable. Also, older farmers may be more
likely to suffer from a technology anxiety that may
make them less confident in the use of these more complex technologies.
Method of control of land was also found to be a significant determinant of SSM adoption. When comparing adoption to non-adoption, tenancy is statistically significant in two of the five equations.
Tenant farmers are more likely to adopt GSS (P1/P0) or
GSS + VRT (P3/P0) relative to non-adoption. This may
imply that tenants find the technology more useful than owner-operators due to their lesser understanding of the field characteristics on leased land do. It is also possible that GSS and GSS + VRT adoption are valued by the landowner, and thus is a form of non-price competition for leased land.
Tenant farmers are also more likely to adopt GSS
relative to YM (P1/P2), GSS relative to YM + VRT
(P1/P4), GSS+VRT relative to YM (P3/P2) and GSS +
VRT relative to YM + VRT (P3/P4). These coefficients
all suggest a general tendency for farmers with increased use of leased land to prefer to adopt grid soil sampling prior to adoption of a yield monitor. Because yield monitoring only provides yield data, tenant farmers may find that extensive information from grid soil sampling gives them more knowledge of the soil and field characteristics on leased land.
Computer use in the farm business was included as a proxy for innovativeness and manager sophistication. It is significant in only two equations. Farmers who use computer for farm business are more likely to adopt YM
relative to non-adoption (P2/P0) but are less likely to
adopt YM + VRT relative to YM alone (P4/P2).
Referring to the discussion in the previous variable, the processing and analysis of yield monitor data is one of the most complex tasks associated with SSM usage. Facility with computer technology may greatly facilitate the adoption of this component of SSM.
CBELT, a zero/one binary variable, was included to indicate whether or not the farm was located in the Corn Belt region of Ohio. Farms in the glaciated, Corn Belt region were expected to be more suited to crop production than farms outside this region, and were expected to display higher adoption rates for all types of SSM technologies. However, this variable was statistically significant in only one equation. Corn Belt farmers were more likely to adopt GSS + YM + VRT
relative to YM + VRT (P5/P4).
farmer would adopt these management intensive technologies. Similarly, the number of owners was included based on the hypothesis that additional owners would mean additional management resources, and would increase the likelihood of adopting the management intensive SSM technologies.
4. Conclusions
SSM is an emerging technology that enables producers to make more precise input application decisions based on soil and crop characteristics. Hence, SSM not only offers substantial benefits of increased production efficiency for producers, but also improved environmental quality for society. As a suite of technologies, various components of SSM may be adopted as a package. However, some components may require adoption of other components. In spite of its potential benefits, adoption of SSM is still early in the diffusion process. Using a Multinomial Logit model, this study examines the interaction of various farmer and farm characteristics in determining SSM adoption. Results show that larger farmers are more likely to adopt yield monitors either as a single unit or as a package with VRT than are their small farmer counterparts. Unlike the yield monitor, the adoption process of grid soil sampling is scale-neutral. Because farmers typically hire custom applicators to do both grid soil sampling and VRT applications on a variable cost basis, the comparative advantage of large farms for VRT adoption may be reduced.
This study may also provide insight as to the sequence of adoption of SSM component technologies and how this sequence might differ for farmers of differing
characteristics. Farmers with higher levels of formal education are more likely to adopt GSS or GSS+VRT prior to adopting yield monitoring. This likely results from different perceptions of the value of GSS and yield monitor data by farmers with differing levels of education. Also, older farmers are less likely to adopt georeferenced yield monitoring relative to GSS or VRT. This may be due to the inability to delegate yield monitor operation, data management and data analysis to off-farm service providers. In other words, older farmers may prefer to adopt those parts of the technology for which technical skills and data analysis can be purchased. Although at first glance, the yield monitor appears to be a simple technology, the interface of the yield monitor with global positioning, the storage of yield data in a geographic information system, and the analysis of yield variations using GIS data are not trivial tasks. This may be the portion of the SSM system that requires the greatest human capital, the steepest learning curve, and the largest opportunity cost of manager time.
References
[1] M.T. Batte, Journal of Soil and Water Conservation 55 (2000) 12.
[2] G.S. Maddala, P. Hammond, A. Holly, Limited-Dependent and Qualitative Variables in Econometrics, Cambridge University Press, New York, 1983.
[3] W.H. Greene, Econometric Analysis, MacMillan Publishing Company, New York, 2000.