Environmental impact of salinity by diffuse contamination on the water quality of the Arba River
15
0
0
Full text
(2) Javier Machín & Ana Navas. el río Arba aumenta de 0.3 a 4.7 dSm-1 desde la entrada a la salida del área de Bardenas. Por ello, La carga de sal aportada por los flujos de retorno representa más del 50% de la carga total de sal transportada por el río Arba. Este río presenta los niveles más elevados de salinidad en la cuenca del Ebro. La escasa calidad del agua debido a alta salinidad res tringe los posibles usos posteriores del agua. Con el fin de reducir este impacto ambiental, es necesario fijar las prácticas de gestión más ade cuadas que impliquen un uso más eficiente del agua sin posteriores dete rioros. Key-words: Salinity, Water resources, Irrigation, Return flow, Ebro Depression, Spain. Palabras clave: Salinidad, Recursos hídricos, Regadío, Flujos de retorno, Depresión del Ebro, España. 1. Introduction Salinity is one of the most important problems for irrigation agriculture in arid and semi-arid zones. Both irrigation water and soil composition can help to increase salinity, which in turn decreases crop output and forces a shift to more resistant crops. The situation is deteriorating in areas with natural drainage problems or shallow phreatic layers. Any decision about transforming irrigated land should consider soil quality, drainage capacity and the quality of irrigation water are fundamental factors. When irrigation efficiency is low, the presence of drainage water is an important problem to conserve watercourse quality. An effective solution is to minimise drainage water by improving irrigation efficiency as well as educating farmers. Several techniques are now available to calculate how much water (or fertiliser) to apply and when. One solution is to stop irrigating saline soils but a large part of agricultural production comes from irrigated land. In the future, plans for irrigation must take into account the environment and aspects of economic and social viability. Environmental protection laws could also be improved and thoroughly implemented via the inspection and the reduction of agricultural waste and diffuse agricultural contamination. In general, developed countries have been able to purify urban wastewater but other problems remain, such as the eutrophisation of rivers and reservoirs and excess salts and nitrates. Public officials are beginning to act on diffuse sources of contamination, especially agriculture and livestock farming in order to solve the problem at its origin. (OCDE, 1982). In 1984, the USEPA reported that diffuse sources of contamination were responsible for 65% of the adverse impact on water quality and that 50 to 70% were due to agricultural activities. The Ebro Valley has a historical salinity problem that has been exacerbated by inadequate use of irrigation water (Alberto et al., 1979, 1986; Faci et al., 1985; Navas and Machín, 1995). The transformation of an area into irrigated land implies choosing the most adequate irrigation technique for the conservation of the environment and the reduction of foreseable damages. 16.
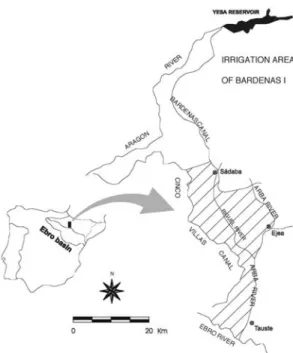
(3) Environmental impact of salinity by diffuse contamination on the water quality of the Arba river. We evaluated the impact of salt contamination in the Arba river in Gallur, which collects the irrigation effluents from Bardenas I. This site uses 5.8 t/ha of irrigation water every year, which makes up 50% of the total salinity of the river which collects the return flows. The Arba river is one of the most saline rivers in the Ebro Valley, with EC values as high as 2.4 dS m-1, under low flow and high irrigation demand (MOPU, 1972-1985; Basso et al., 1990; Machin & Navas, 2000). We analysed the water quality of the Arba and Riguel rivers and the behaviour of the Bardenas I irrigation site in terms of salinity, particularly with respect to seasonal and inter-annual variations and return flows. 2. The study area The study area comprised the sections of the Bardenas I irrigation site that drain water toward the Arba and Riguel river basins. The surface area was approximately 30000 ha of the 57000 ha that make up Bardenas I, which uses water from the Yesa reservoir via the Aragon river (origin flow of 60 m3 s-1) (Figure 1). The main irrigation canal is the Bardenas Canal. The secondary canals are Cinco Villas, Saso, Cascajos and the Pardina Canal. The drainage network has collectors or main drainages and secondary and tertiary drainages. The predominant irrigation system in the area is plot flooding. Aspersion was used in some sections of the site such as hillsides. According to data provided by the Regional Government of Aragon (Diputación General de Aragón) the main crops in this area are cereal (8000 ha), corn (12000 ha), sunflower (6000), alfalfa (5000) and horticulture (1000).. Figure 1. Location of the study area.. 17.
(4) Javier Machín & Ana Navas. The geomorphology includes fluvial terraces, alluvial fans, glacis, plains, structural platforms, valley fills and depressions (endorheic areas). The lithology is mostly chalk, marls, gypsum and detritic material. The northern part has sandy plains next to basins excavated on marls material with an endorheic character. The central part is composed of the Cinco Villas depression with predominant marls lithology covered with detritic material molded into terraces and glacis. At the foot of the platform called Plana de La Negra there are three levels of glacis that connect with the system of terraces of the Arba and Riguel rivers. The southern section is typical of the center of the Ebro depression with marls-gypsum, bordered by ravines that flow toward the Arba and Ebro rivers. Most soils in the area are on terraces and glacis. They have no drainage problems or salt accumulation which makes them excellent for irrigation agriculture even though they sometimes have other limiting factors such as being shallow or stony. The main characteristic of these soils is a petrocalcic horizon 40-60 cm below the surface. The valley bottom has saline soils due to the natural intrinsic salinity of geological materials in the area and posterior secondary salinization from irrigation without natural drainage. We classified the soil units according to the FAO (1989) (see Figure 2):. Figure 2. Soil units in the Bardenas I irrigated area.. 18.
(5) Environmental impact of salinity by diffuse contamination on the water quality of the Arba river. Lytic Leptosols + Haplic Gypsisols: (5.2 % of the surface area) soils on hillsides with >15% slope, developed on a rocky substrate of marly nature, very superficial with a high risk of erosion and fine texture. Rendsic Leptosols: (1.1% of the surface area) soils on hillsides with little slope, shallow with a high stone content and low EC. Calcaric Regosols + Sodic Solonchaks: (6.3% of the surface area) soils developed on clayey materials, which increases drainage problems, predominantly sandy loam texture with salinity and sodicity problems. Haplic Solonetz + Sodic Solonchaks: (9.9% of the surface area) soils on plains with intense generalised piping processes, EC up to 56 dS m-1 and 89 SAR, silt-loam and clay-loam textures. The predominance of the silt fraction (more than 50%) and the high percentages of interchangeable sodium in the clays explain the poor soil structure. Sodic Solonchaks: (8.3% of the surface area) soils of the depressions with clayey materials of fine texture, impeding drainage with salinity and sodicity problems. The proximity of the phreatic level to the surface makes salts rise by capillary action. Gypsic Regosols + Gypsic Solonchaks: (4.4% of the surface area) soils developed on filling materials (silt, sand, gravel) from the valley head and valley sides, deep soils with sandy loam and clay loam texture. Petric Calcisols: (39.7% of the surface area) soils in the high glacis and high terraces, high stoniness and calcareous coating which is a limiting factor of depth. Good drainage conditions and sand loam and loamy sand texture. No salinity problems. Haplic and Petric Calcisols: (7.2% of the surface area)soils on low glacis with an occasional petrocalcic horizon. Sandy loam texture and good drainage. No salinity problems. Calcaric Fluvisols: (10.3% of the surface area) soils of the inferior terrace or alluvial plain, with predominantly fine texture and depth (>1 meter). EC values up to 39 dS m-1 in parts of the alluvial plain with a saline phreatic layer. In general the soils affected by salts in Bardenas I are saline-sodic. The saline soils that sometimes appear on the glacis are mostly from levelling by irrigation and are responsible for the outcropping of the deepest layers of lutites and saline loams. 3. Methodology An Electromagnetic Sensor (EMS) was used to determine the spatial variability of the soil salinity. We took measurements «in situ» of the electrical conductivity on a regular grid of 3 x 3 km. The EC intervals were 0-2, 2-4, 4-8 and >8 dS m-1. An isoline map of EC was developed using the SURFER program (Figure 3). Water salinity was measured on the drainage network of the Bardenas I and in specific parts of the Arba and Riguel Rivers. We located sampling and gauging points to measure the flow and saline concentration (Figure 3). In the collectors, samples were 19.
(6) Javier Machín & Ana Navas. Figure 3. Location of collectors and rivers, sampling points and isolines of electrical conductivity.. taken at sections installed by the Hydrographic Confederation of Aragon (Confederación Hidrográfica del Ebro) to measure water levels. Samples were taken every fifteen days over three years. We controlled 15 sampling points in the drainage collectors and six in the rivers, three on the Arba and three on the Riguel river. One additional sampling point was used on the Bardenas Canal. We collected and analysed 884 water samples from drainages, 364 from the rivers and 60 from the Bardenas Canal. EC was the parameter used to measure water salinity (dS m-1 at 25ºC). Other measured parameters were: pH, anions (CO3=, HCO 3-, Cl -, SO 4=, NO3-), cations (Ca ++, Mg++, Na+, K+ ) and SAR. 20.
(7) Environmental impact of salinity by diffuse contamination on the water quality of the Arba river. 4. Results and discussion 4.1. Soil Characteristics. Four homogeneous regions were differentiated in the study area in terms of soil salinity (EC of 0-2, 2-4, 4-8 and > 8 dS m-1), represented in the isoline map of EC (saturation extract) of the soils in Figure 3. Calcisols had less than 2 dS m-1 EC. Soils in the poorest areas between the Cinco Villas ravine and the Riguel-Arba system exceeded this limit. The highest salinity was in the Valareña-Sabinar area (center of Bardenas ) and in the south with EC values that were similar to the soil map. Thus, the Calcisols were non-saline and the poorest areas were saline and/or sodic. The surface areas of each of level of saline soil were 16596 ha (58%) from 0 to 2 dS m-1; 10236 ha (36%) from 2 to 4 dS m-1; 1529 ha (5%) from 4 to 8 dS m-1 and 144 ha (0.6%) for >8 dS -1. The soil in valleys and depressions reached 50 dS m-1, where the predominant salt was sodium chloride. 4.2. Water characteristics. The statistical analysis of the EC in the drainage collectors is shown in Table 1. The salinity of the drainage water in Bardenas I was highly variable. The minimum value at C-21 was 0.44 dS m-1 and the maximum at C-27 was 9.84 dS m-1. In general, the conductivity of the drainage collectors was greater outside of the irrigation season. During irrigation, the saline concentration decreased due to the low salt content in the water from the tail of the streams that flow directly into the drainages. Nonetheless, collector 31 had the highest average EC in the irrigation season although the difference between the two seasons was minimal. The lowest saline concentrations were in soils without salinity problems (Haplic and Petric Calcisols) which included collectors 11, 12, 13, 14, 21, 34 and XI-4 with an average 0.84 dS m -1 EC. These values contrast with the elevated concentrations in drainage water (especially C-27, C-29 and C-30 with an average of 3.23 dS m -1 EC) and the very high coefficients of variation. These collectors were in areas with saline soils (Figure 4). The summary statistics of water EC in rivers is shown in Table 2. There were temporal variations in salinity in the Arba and Riguel rivers, but less than in the drainage collectors. EC varied between 0.25 dS m-1 in the Arba of Luesia at Ejea to 3.8 dS m-1 in the Arba at Tauste, although these values were not sampled on the same day. After analysing EC averages from each control point, it is clear that the process of salination in the Arba and Riguel rivers is due to the irrigation return flows. The Riguel river in Sádaba has an average annual EC of 0.39 dS m-1 that increases to 0.81 dS m-1 in an intermediate inspection point near the mouth of collector 12 (Riguel at C-12), 21.
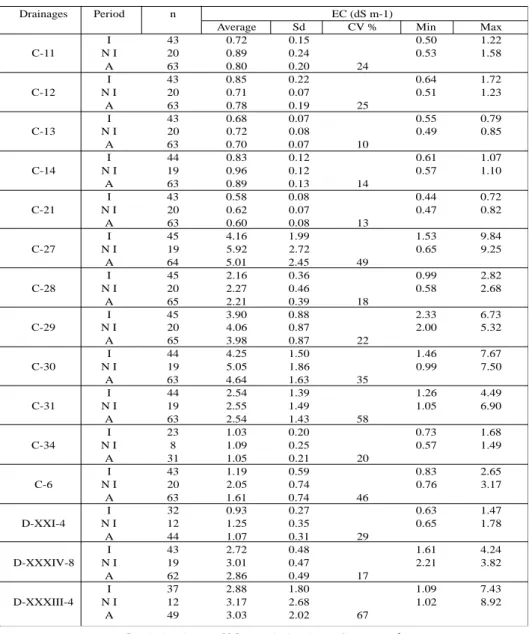
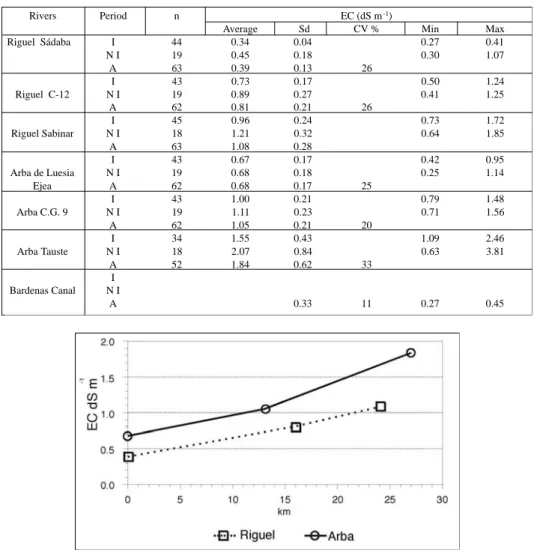
(8) Javier Machín & Ana Navas. Table 1. Statistics of Electrical Conductivity in Drainages of Bardenas I. Drainages. C-11. C-12. C-13. C-14. C-21. C-27. C-28. C-29. C-30. C-31. C-34. C-6. D-XXI-4. D-XXXIV-8. D-XXXIII-4. Period I NI A I NI A I NI A I NI A I NI A I NI A I NI A I NI A I NI A I NI A I NI A I NI A I NI A I NI A I NI A. n 43 20 63 43 20 63 43 20 63 44 19 63 43 20 63 45 19 64 45 20 65 45 20 65 44 19 63 44 19 63 23 8 31 43 20 63 32 12 44 43 19 62 37 12 49. I = irrigation. Average 0.72 0.89 0.80 0.85 0.71 0.78 0.68 0.72 0.70 0.83 0.96 0.89 0.58 0.62 0.60 4.16 5.92 5.01 2.16 2.27 2.21 3.90 4.06 3.98 4.25 5.05 4.64 2.54 2.55 2.54 1.03 1.09 1.05 1.19 2.05 1.61 0.93 1.25 1.07 2.72 3.01 2.86 2.88 3.17 3.03. Sd 0.15 0.24 0.20 0.22 0.07 0.19 0.07 0.08 0.07 0.12 0.12 0.13 0.08 0.07 0.08 1.99 2.72 2.45 0.36 0.46 0.39 0.88 0.87 0.87 1.50 1.86 1.63 1.39 1.49 1.43 0.20 0.25 0.21 0.59 0.74 0.74 0.27 0.35 0.31 0.48 0.47 0.49 1.80 2.68 2.02. N I = no irrigation. EC (dS m-1) CV %. Min 0.50 0.53. Max 1.22 1.58. 0.64 0.51. 1.72 1.23. 0.55 0.49. 0.79 0.85. 0.61 0.57. 1.07 1.10. 0.44 0.47. 0.72 0.82. 1.53 0.65. 9.84 9.25. 0.99 0.58. 2.82 2.68. 2.33 2.00. 6.73 5.32. 1.46 0.99. 7.67 7.50. 1.26 1.05. 4.49 6.90. 0.73 0.57. 1.68 1.49. 0.83 0.76. 2.65 3.17. 0.63 0.65. 1.47 1.78. 1.61 2.21. 4.24 3.82. 1.09 1.02. 7.43 8.92. 24. 25. 10. 14. 13. 49. 18. 22. 35. 58. 20. 46. 29. 17. 67. A = annual. reaching almost 1.1 dS m-1 in Sabinar when it meets the Arba. The Arba river at the entrance to the Bardenas I site in Ejea, had an average annual EC of 0.68 dS m-1 that increased to 1.05 dS m-1 in an intermediate control point (Arba at CG9), reaching 1.84 dS m-1 in Tauste (Figure 5). The data from the Arba river at Tauste are fundamental since it collects all the irrigation effluents from Bardenas I. It had the greatest temporal variability of all the seasons. 22.
(9) Environmental impact of salinity by diffuse contamination on the water quality of the Arba river. 23.
(10) Javier Machín & Ana Navas. Table 2. Statistics of Electrical Conductivity in the Riguel and Arbas rivers and the Bardenas Canal. Rivers Riguel Sádaba. Riguel C-12. Riguel Sabinar. Arba de Luesia Ejea Arba C.G. 9. Arba Tauste. Bardenas Canal. Period I NI A I NI A I NI A I NI A I NI A I NI A I NI A. n 44 19 63 43 19 62 45 18 63 43 19 62 43 19 62 34 18 52. Average 0.34 0.45 0.39 0.73 0.89 0.81 0.96 1.21 1.08 0.67 0.68 0.68 1.00 1.11 1.05 1.55 2.07 1.84. Sd 0.04 0.18 0.13 0.17 0.27 0.21 0.24 0.32 0.28 0.17 0.18 0.17 0.21 0.23 0.21 0.43 0.84 0.62. 0.33. EC (dS m -1) CV %. Min 0.27 0.30. Max 0.41 1.07. 0.50 0.41. 1.24 1.25. 0.73 0.64. 1.72 1.85. 0.42 0.25. 0.95 1.14. 0.79 0.71. 1.48 1.56. 1.09 0.63. 2.46 3.81. 0.27. 0.45. 26. 26. 25. 20. 33. 11. Figure 5. Increases of salinity along the Arba and Rigüel rivers.. The EC increased to 3.8 dS m-1 under no irrigation when the river flow is basically superficial drainage water full of salts from the washing of the soils. The average EC value in the Bardenas Canal was 0.33 dS m-1, with no variations in the period. This water quality is favourable for washing salts but the low salinity can cause permeability problems in sodic soils (Ayers & Westcot, 1976; Ayers & Tanji, 1981) Table 4. 4.3. Ionic composition of water Table 3 summarises data on the chemical parameters of drainage water from year 1 for the 15 collectors and drainages in Bardenas I. The SAR values were highest in the 24.
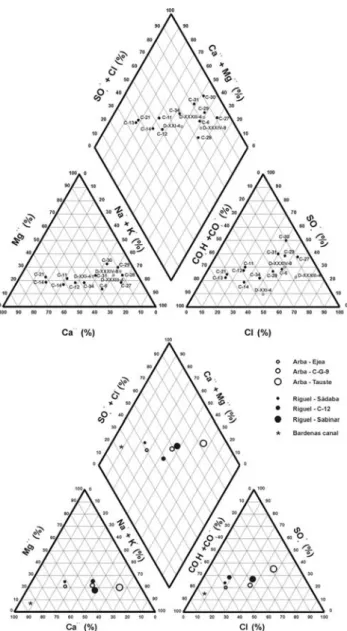
(11) Environmental impact of salinity by diffuse contamination on the water quality of the Arba river. Table 4. Statistics of Chemical composition in the Riguel and Arba rivers and the Badenas Canal. Rivers. Riguel Sádaba. Riguel C-12. Riguel Sabinar. Arba de Luesia Ejea Arba C.G.9. Arba Tauste. Bardenas Canal. average min max n average min max n average min max n average min max n average min max n average min max n average min max n. Ca2+. Cations Mg2+ Na+. 2.7 1.9 4.6 9 3.3 2.4 4.1 9 3.6 2.0 5.1 9 4.0 2.0 5.4 9 3.9 2.0 5.4 9 4.8 2.2 7.3 7 2.1 1.3 3.0 18. 1.2 0.4 3.2 9 2.9 1.8 3.7 9 2.2 0.5 2.9 9 1.6 1.2 2.6 9 2.3 1.2 2.6 9 6.0 2.6 8.8 7 0.6 0.1 2.5 18. 1.2 0.5 3.5 9 4.5 2.8 3.1 9 5.7 3.1 6.9 9 1.9 0.6 3.5 9 5.2 0.6 3.5 9 18.3 6.2 28.4 7 0.4 0.2 1.3 18. K+. CO32 meq L-1 0.1 0.1 0.03 0 0.2 0.3 9 4 0.1 0.7 0.1 0.7 0.1 0.8 9 4 0.1 0.6 0.03 0.4 0.1 0.8 9 4 0.1 0.2 0.04 0.0 0.2 0.4 9 4 0.1 0.03 0.04 0.0 0.2 0.4 9 4 0.2 0.3 0.1 0.0 0.2 0.5 7 4 0.02 0.1 0.0 0.0 0.1 0.4 18 5. Anions HCO3SO423.1 0.3 5.4 9 5.2 3.7 6.4 9 4.2 1.6 5.7 9 4.4 0.9 7.0 9 4.7 0.9 7.0 9 5.6 2.5 7.7 7 2.4 0.4 4.0 18. 1.3 0.6 4.6 9 3.4 2.1 4.5 9 3.3 1.7 3.8 9 1.6 1.0 2.1 9 2.9 1.1 2.1 9 10.2 3.9 15.6 7 0.4 0.03 0.6 18. SAR Cl1.0 0.3 2.5 9 2.3 1.6 3.0 9 4.4 2.1 5.2 9 1.6 0.7 2.8 9 4.2 0.7 2.8 9 14.3 6.3 20.7 7 0.4 0.1 1.6 18. 0.8 0.3 1.8 9 2.5 1.7 3.4 9 3.4 2.7 4.2 9 1.2 0.4 2.1 9 2.9 0.4 2.1 9 7.8 3.3 12.5 7 0.4 0.1 1.3 18. most saline collectors. At C-27 the average was close to 15 since the predominant cation in this drainage was sodium (up to 76 meq L-1). The anions in the south in collectors 30 and 31 (on an large extension of gypsum terrain) were predominantly sulfates. The most important salt in the rest of the drainage canals was sodium chloride. Table 4 shows the basic statistics for the chemical composition of the rivers and the Bardenas Canal. After comparing the ionic concentrations in the Bardenas Canal, the Riguel river at Sádaba and the Arba at Ejea with the Arba at Tauste (which collects all the effluents from Bardenas), we can appreciate the difference in quality between the water entering and leaving the area. We can clearly see these important changes in ionic composition using the Piper diagrams (Figure 6). The triangular diagram shows the differences in the ionic composition of the water in the collectors that drain the Haplic and Petric Calicisols compared to those in saline areas. In the former, the water is bicarbonated-calcic similar to that of the Bardenas Canal, while the latter is chlorated and/or sodium sulfated. The average ionic composition of the Arba and Riguel rivers indicate that their respective valley heads are bicarbonated-calcic. The proportion of sulfate and chloride 25.
(12) Javier Machín & Ana Navas. Table 3. Statistics of Chemical Composition in Drainages of Bardenas I. Drainages. C-11. C-12. C-13. C-14. C-21. C-27. C-28. C-29. C-30. C-31. C-34. C-6. D-XXI-4. D-XXXIV-8. D-XXXIII-4. 26. average min max n average min max n average min max n average min max n average min max n average min max n average min max n average min max n average min max n average min max n average min max n average min max n average min max n average min max n average min max n. Ca2+. Cations Mg2+ Na+. 3.7 2.7 4.7 10 3.3 2.2 4.7 10 4.2 2.8 5.7 10 4.2 1.4 7.1 10 3.8 2.8 5.5 10 9.3 2.2 14.6 11 2.6 1.2 4.3 10 4.7 1.9 6.7 10 11.0 1.9 15.9 9 6.2 1.6 19.2 10 4.1 3.3 5.1 7 5.2 3.1 7.0 10 3.7 4.5 4.0 6 3.1 1.8 4.7 8 4.6 2.1 8.8 10. 1.6 1.0 1.9 10 1.3 0.8 2.1 10 1.3 0.9 1.9 10 1.5 1.1 1.8 10 1.4 1.1 1.6 10 14.3 1.1 24.8 11 6.6 5.2 7.2 10 14.4 5.9 18.0 10 24.2 10.7 30.1 9 5.9 2.1 24.4 10 1.9 1.0 2.6 7 3.1 1.2 4.2 10 3.1 2.2 4.0 6 9.2 7.5 10.6 8 8.2 2.9 29.0 10. 2.5 1.3 3.8 10 2.7 1.4 6.3 10 1.2 0.9 2.1 10 2.5 1.1 3.5 10 0.9 0.7 1.0 10 52.4 3.0 76.3 11 17.6 15.2 19.6 10 27.5 11.9 36.3 10 37.0 26.7 43.2 9 11.2 4.6 43.6 10 4.7 1.5 6.9 7 11.4 3.3 16.3 10 6.2 5.0 7.8 6 21.4 17.6 25.2 8 19.1 6.0 71.4 10. CO3 2 meq L-1 0.03 0.3 0.02 0 0.05 0.4 10 4 0.03 0.2 0.01 0 0.1 0.4 10 4 0.04 0.6 0.02 0.5 0.1 0.9 10 4 0.03 0.1 0.02 0 0.1 0.3 10 4 0.1 0.5 0.02 0.3 0.2 0.6 10 4 0.1 0.8 0.02 0.3 0.2 1.1 11 5 0.1 0.9 0.01 0.6 0.2 1.2 10 4 0.2 0.8 0.02 0.4 0.3 1.0 10 4 0.2 0.6 0.1 0.5 0.4 0.7 9 4 0.1 0.3 0.1 0 0.3 0.5 10 4 0.1 0 0.1 0 0.1 0 7 7 0.1 0.7 0.03 0.4 0.1 1.1 10 4 0.1 0.4 0.1 0 0.1 1.2 6 6 0.2 0.9 0.02 0.7 0.2 1.2 8 4 0.1 0.2 0.01 0 0.4 0.9 10 8 K+. Anions HCO3SO423.4 2.1 4.0 10 3.3 2.4 3.9 10 3.8 2.2 4.7 10 4.4 0.5 5.5 10 3.4 1.8 4.3 10 6.2 1.2 8.2 11 7.2 6.2 8.6 10 6.4 0.1 8.8 10 6.7 5.4 7.6 9 4.2 3.5 5.2 10 4.3 3.2 5.2 7 3.7 2.0 4.9 10 5.2 4.2 6.2 6 7.4 5.9 8.5 8 5.0 3.8 7.7 10. 2.3 1.2 4.5 10 2.0 1.3 4.3 10 1.5 0.9 3.0 10 1.4 0.9 3.2 10 1.4 0.9 2.6 10 30.8 1.6 44.0 11 7.1 5.2 8.8 10 18.2 7.8 24.0 10 36.8 10.2 46.5 9 9.5 1.3 41.0 10 2.3 1.1 3.3 7 6.1 1.9 8.9 10 1.1 0.9 1.2 6 9.6 7.0 12.5 8 6.7 2.4 20.0 10. SAR Cl1.9 1.1 2.5 10 1.7 1.0 4.2 10 1.0 0.7 1.4 10 2.3 1.3 2.9 10 0.9 0.6 1.1 10 44.0 2.9 76.9 11 12.4 9.4 14.5 10 22.5 8.8 31.3 10 31.1 23.7 39.4 9 9.4 2.6 38.5 10 3.7 1.2 5.9 7 10.1 2.7 15.4 10 5.5 3.7 6.5 6 17.2 12.0 22.8 8 19.2 5.6 80.1 10. 1.5 1.0 2.2 10 1.7 1.0 3.4 10 0.7 0.5 1.4 10 1.5 0.5 2.3 10 0.5 0.5 0.6 10 14.6 2.3 22.3 10 8.2 7.6 9.4 10 9.0 6.0 11.0 10 9.0 7.6 9.7 9 4.4 2.5 9.3 10 2.7 1.0 3.5 7 5.4 2.2 7.7 10 3.4 2.8 4.1 6 8.6 7.2 10.0 8 6.7 3.4 16.4 10.
(13) Environmental impact of salinity by diffuse contamination on the water quality of the Arba river. Figure 6. Piper diagrams of the water ionic composition in irrigation return flows and rivers.. anions increases along their flow, in addition to the sodium cation. The Arba at Tauste near the mouth of the Ebro river has almost 50% chloride and 65% sodium, clearly reflecting the salinization and sodification of the river as a consequence of the irrigation effluents. We applied the quality criteria for irrigation water proposed by Richards (1954) for the collectors and the rivers (see Figure 7). The collectors that drain saline areas have an elevated risk of salinity and sodicity. 27.
(14) Javier Machín & Ana Navas. Figure 7. Salinization and sodification risk for different quality criteria in collectors and rivers.. The actual quality criteria for irrigation water are not as strict (UC.- Consultants 1974), so the average values of water quality in some collectors may be more acceptable. The Arba at Tauste had a high to very high salinity risk for an average or maximum EC value, respectively (Figure 7). If we consider all the criteria for salinity and sodicity used by Ayers and Wescott (1985), the most saline collectors (C-27, C-29, C-30 and D-XXXIII-4) had the highest risk of salinization. The sodification risk was not as serious for the majority. The Arba at Tauste had an moderate risk of salinization and sodification (Figure 7) 5. Conclusions The Riguel and Arba rivers are undergoing an important process of salinization, since the saline concentration in their valley-heads is very low compared to the flow in their respective outlets. Most of the salt comes from the superficial and subsuperficial drainage water. The saline concentration of the water is higher when there is no irrigation, which also coincides with the lowest flows. The water quality improves substantially at the beginning of the irrigation season when flows increase. Thus, there is an inverse relationship between salinity and flow. Part of the salinity of the Arba river is from the drainages on the left side of the river, which were not controlled directly. According to recent water quality criteria for irrigation, only the water from some collectors (11,12,13,14, 21 and 34) could be reused without risk of salination. On the other 28.
(15) Environmental impact of salinity by diffuse contamination on the water quality of the Arba river. hand, returns from collectors in saline soils (27, 28, 29, 30 y DXXXI-4) have a high risk of salinization. The quality of the return water produces moderate salinization problems in the Arba river at the end of the irrigation area and a low to moderate risk of alcalinization, in view of subsequent use. Acknowledgements This research was funded by CICYTprojects Nat 90-1077-CO2-O2 and HID 96-1306. References Alberto, F., Machin, J. and Aragüés, R. (1986). La problemática general de la salinidad en la Cuenca del Ebro. En: «Sistema integrado del Ebro: Estudio interdisciplinar». ISBN: 84-398-7293-3., 17 pp. Aragues, R., Alberto, F., Cuchi, J.A. and Machin, J. (1979). Calidad del agua para riego. I. Criterios generales. ITEA, 37:3-17. Ayers, R. S. and Wescott, D.W. (1976). Water Quality for Agriculture. Irrigation and Drainage Paper. Nº 29. FAO (Roma) 97 pp. Ayers, R. S. and Tanji, K.K. (1981). Agronomic aspects of crop irrigation with wastewater. Proc. Spec Conf. Water Form 81. (1): 578-586 pp. Ayers, R. S.and Wescott, D.W. (1985). Water quality for agriculture. FAO Irrigation and Drainage Paper Nº 29. FAO. (Roma). 174 pp. Basso, L.A., Machin, J. and Pellicer, F. (1990). Masa de sales exportada por la red de drenaje de Bardenas I. Monegros I y Cinca a las aguas superficiales de la cuenca del Ebro. Anales de Aula Dei. 20(1-2):163-181. Faci. J., Aragués, R., Alberto, F., Quilez, D., Machín, J. and Arrúe, J.L. 1985. Water and salt balance in an irrigated area on the Ebro river basin. (Spain). Irrigation Science, 6: 29-37. FAO (1989). Mapa mundial de suelos. Leyenda revisada. FAO. UNESCO. Roma. Machin, J. and Navas A. (2000). Análisis y evaluación de los efectos de los regadíos sobre la salinidad de las aguas. Confederación Hidrográfica del Ebro, Zaragoza. Navas, A. and Machin, J. (1995). Salinidad en las aguas superficiales de la Cuenca del Ebro. En: La calidad de las aguas continentales españolas. Estado actual e Investigación. Alvarez Cobelas, M. y Cabrera Capitán, F. (Eds), pp. 223-231, Geoforma Ediciones, Logroño. OCDE (1982). Entrophication of waters: Monitoring, assessment and control. Paris. Richards, L.A. (1954). Diagnosis and improvement of saline and alkali soils. USDA. Agric. Handbook, nº 60, 160 pp.. 29.
(16)
Figure

+4


Related documents
How Many Breeding Females are Needed to Produce 40 Male Homozygotes per Week Using a Heterozygous Female x Heterozygous Male Breeding Scheme With 15% Non-Productive Breeders.
On the Saudi Gulf coast the major environmental effects of coastal and marine use.. are concentrated in and around, Jubayl and
Another meditation teacher, who has facilitated meditation teachers training, has also worked with vulnerable populations in San Francisco including those with psychiatric
In this present study, antidepressant activity and antinociceptive effects of escitalopram (ESC, 40 mg/kg) have been studied in forced swim test, tail suspension test, hot plate
National Conference on Technical Vocational Education, Training and Skills Development: A Roadmap for Empowerment (Dec. 2008): Ministry of Human Resource Development, Department
We will cover those fixtures and structural improvements in the Home or on the Site which are your property and not insured by any insurance Policy taken out under the
In this study it is aimed to investigate the total lipid and the fatty acid composition of pearl mullet which is the only fish species occurring in Lake Van and
Assessing the Impact of Biodiversity Conservation in the Management of Maize Stalk Borer (Busseola f
Field experiments were conducted at Ebonyi State University Research Farm during 2009 and 2010 farming seasons to evaluate the effect of intercropping maize with
