INTRODUCTION
Identifying and characterizing the genetic vari-ants that affect human traits, ranging from dis-ease susceptibility to variability in personality measures, is one of the central objectives of human genetics. Ultimately, this aim will be achieved by examining the relationship between interesting traits and the whole genome se-quences of many individuals. Although whole genome resequencing of thousands of individ-uals is not yet feasible, geneticists have long recognized that much progress can be made by measuring only a relatively modest number of genetic variants in each individual. This type of “incomplete” information is useful because data about any set of genetic variants in a group of individuals provide useful information about many other unobserved genetic variants in the same individuals.
The idea that data on a modest set of ge-netic variants measured in a number of re-lated individuals can provide useful information about other genetic variants in those individu-als forms the theoretical underpinning of both genetic linkage mapping in pedigrees and hap-lotype mapping in founder populations (23, 24, 50). These studies typically use<10,000 genetic markers to survey the entire human genome by identifying stretches of chromosome inherited from a common ancestor. The shared stretches usually span several megabases and include thousands of genetic variants. Both approaches have been highly successful in identifying genes responsible for single-gene Mendelian disor-ders (9). In contrast, they have had only lim-ited success in mapping genes that influence complex traits, although success stories do exist (40, 42, 75, 83).
More recently, technological advances have made genome-wide association studies (GWAS) possible (39, 67, 109). Rather than <10,000 variants, these studies typically geno-type 100,000–1,000,000 variants in each of the individuals being studied. Since >10 million common genetic variants are likely to exist (104), even these detailed studies examine only a fraction of all genetic variants. Whereas in traditional genetic linkage and founder
haplotype mapping studies geneticists expect to identify long stretches of shared chro-mosome inherited from a relatively recent common ancestor, in GWAS focusing on apparently unrelated individuals geneticists expect to identify only relatively short stretches of shared chromosomes. Remarkably, geno-type imputation can use these short stretches of shared haplotype to estimate with great precision the effects of many variants that are not directly genotyped.
In this review, we first attempt to provide the reader with an intuition for how geno-type imputation approaches work and for their theoretical underpinnings. We start with the relatively intuitive setting of imputing missing genotypes for a set of individuals using informa-tion on their close relatives. We then examine how genotype imputation works when applied to more distantly related individuals. Next, we survey results of studies that have used genotype imputation to study complex disease suscepti-bility. We attempt to provide the reader with critical information to assess the merits of geno-type imputation-based analyses and to provide guidance to analysts attempting to implement these approaches. Finally, we survey potential uses of imputation-based analyses in the con-text of whole genome resequencing studies that we believe will soon become commonplace.
GENOTYPE IMPUTATION IN STUDIES OF RELATED INDIVIDUALS
Family samples constitute the most intuitive setting for genotype imputation. Genotypes for a relatively modest number of genetic markers can be used to identify long stretches of haplotype shared between individuals of known relationship. These stretches of shared haplotype (or regions “identical-by-descent”, IBD) are typically used to evaluate the evidence for linkage. Specifically, genetic linkage implies that family members who share a region IBD will be more similar to each other than will fam-ily members with the same degree of relatedness who do not share the region IBD. In the context
Annu. Rev. Genom. Hum. Genet. 2009.10:387-406. Downloaded from www.annualreviews.org
of genotype imputation, we characterize each of these stretches in detail by genotyping additional markers in one or more individuals in the family. Genotypes for these markers can then be propagated to other family members who are only typed at a minimal set of markers. The approach is illustrated inFigure 1. In the figure, all individuals have been genotyped for a set of genetic markers indicated in red; a subset of individuals in the top two generations has been genotyped at additional markers indi-cated in black (panela). Genotypes for the red markers, available in all individuals, can be used to infer the segregation of haplotypes through the family (panelb). Finally, most of the missing genotypes for individuals in the bottom gener-ation can be inferred by comparing the hap-lotypes they inherited with copies of the same haplotypes that are IBD and present in other individuals in the family (panelc).
The idea that family members share long stretches of haplotype that are IBD underpins nearly all methods of linkage analysis. Further-more, many early approaches for association analysis in pedigree data implicitly impute miss-ing genotypes by considermiss-ing the distribution of potential genotypes of each individual jointly with that of other individuals in the same pedi-gree (35, 45). The extension of this idea to the imputation of missing genotypes (as outlined above) was first described by Burdick and col-leagues (12), who coined the term in silico geno-typing to describe the idea that computational analyses could be used to replace laboratory-based procedures in the determination of in-dividual genotypes. To illustrate the potential of the approach, they reanalyzed the data of Cheung and colleagues (17). Cheung and col-leagues sought to identify genetic variants as-sociated with regulation of gene expression by examining RNA transcript levels and genotype data for individuals in the top two generations of the Centre d’Etude du Polymorphism Humain (CEPH) pedigrees (21). The CEPH pedigrees are three-generation pedigrees with a struc-ture similar to that of the cartoon pedigree in Figure 1.The top two generations of several of these pedigrees were genotyped at more than
830,000 genetic markers in the first phase of the International HapMap Project (103). Us-ing genotypes for approximately 6500 genetic markers genotyped by the SNP consortium in all three generations of the pedigrees (85), Burdick and colleagues imputed genotypes for most of the HapMap Project markers in the third generation of these pedigrees (12). They showed that this imputation-based analysis was more powerful than the original analysis, which examined only directly genotyped markers for each individual.
Several formal statistical descriptions of genotype imputation procedures for association analyses in families have now been published (15, 108), and the procedures to support geno-type imputation are implemented in packages such as MERLIN (2, 3) and MENDEL (52, 53). In principle, these procedures can be imple-mented using the infrastructure of the Lander-Green (48) or Elston-Stewart (29) algorithms, or one of the many other pedigree analysis algo-rithms, including those that are based on Monte Carlo sampling (38, 96). An important obser-vation from these more formal treatments of the problem is that even when genotypes can-not be imputed with high confidence, partial information about the identity of each of the true underlying genotypes can be productively incorporated in association analysis (15, 108). For example, when genotypes are measured di-rectly, observed allele counts are often used in regression analyses to estimate an additive ef-fect for each marker (1, 8, 34). These observed allele counts indicate the number of copies of the allele of interest (0, 1, or 2) carried by each individual. When genotypes are not measured directly, these discrete counts can be replaced with an expected allele count for each marker (a real number between 0 and 2) (15).
The approach has been successfully used to study several quantitative traits in a sam-ple of closely related individuals from four vil-lages in Sardinia (77). Among study partici-pants, 1412 individuals were genotyped with the Affymetrix 500K mapping array set (which assays∼500,000 SNPs) and a further 3329 in-dividuals were genotyped with Affymetrix 10K
Annu. Rev. Genom. Hum. Genet. 2009.10:387-406. Downloaded from www.annualreviews.org
A/A T/G A/G
T/T A/AT/T T/T G/G T/T G/T G/G A/T A/A G/G
a
T/T C/G A/G A/T G/T G/T G/A T/T C/G A/T T/T G/T A/A A/G C/G G/G ./. ./. T/T ./. ./. G/G ./. ./. T/T ./. ./. A/A ./. ./. G/G ./. ./. A/A ./. ./. G/G ./. ./. A/G ./. ./. T/T ./. ./. A/G ./. ./. G/T ./. ./.A A G A
T A A A T
G G T G G T T G
b
G/G C/C
C/G
G G T G G T T G
A G A A A A
T
C G G G C C G G
A G
T A A
T G
A A G
T
C G C G
A G A G A A A
G T T T G G G G T T T T
A/T
T/T G/T
A/A
G/G G/T
c
G T T T G G G G T T T T
C G G G C C C C G G G G
A/G A/T G/T G/T A/T G/T A/G T/T A/G C/G T/T A/A T/G T/T G/G A/A T/T G/G G/G G/G A/T A/T A/T A/T T/T G/G T/T A/A G/T A/A G/T A/G ./. ./. A/G ./. ./. T/T C/G G/A T/T C/G A/A G/G T/T T/T A/A A/A T/T T/T T/T T/T T/T T/T G/G T/T T/T C/C G/T G/G A/G C/C G/T G/G A/G C/G T/T A/A G/G G/T ./. A/G T/T G/T G/G A/A A/T G/T C/C A/G A/A G/T G/T G/G T G G G T T T A T G G T A A G G T A G T T T T T T A T T G T G T G A T T T G/G C/C G/G . . . . . . . . . . . . . . . . . . . . . . . . . . . . . . . . . . . . . . . . . . . . . . .
. A G G G G
G/G G/G T/T A/G C/C G/T A/T A/A G/T A/A A/G Figure 1
Genotype imputation within a sample of related individuals. (a) The observed data, which consist of genotypes at a series of genetic markers. In this case, a subset of markers has been typed in all individuals (red), whereas the remaining markers have been typed in only a few individuals (black, in individuals in the top two generations of the pedigree). (b) The process of inferring information on identity-by-descent by examining markers for which genotypes are available in all individuals. Each IBD segment that appears in more than one individual is assigned a unique color. For example, a segment marked in blue is shared between the first individual in the grandparental generation at the top of the pedigree, the first individual in the parental generation, and individuals 3 and 4 in the offspring generation at the bottom of the pedigree. (c) Observed genotypes and IBD information have been combined to fill in a series of genotypes that were originally missing in the offspring generation.
Annu. Rev. Genom. Hum. Genet. 2009.10:387-406. Downloaded from www.annualreviews.org
SNP mapping arrays (which assay ∼10,000 SNPs) (94). The data were then used to study the genetic architecture of a variety of quanti-tative traits, ranging from body mass index (94) to fetal hemoglobin levels (106) to personal-ity traits (101). Clearly, family-based genotype imputation will be maximally useful in samples that include very large numbers of related indi-viduals. In these settings, genotypes for a rel-atively modest number of individuals can be propagated to many other additional individ-uals, thereby increasing power. However im-puting genotypes for known relatives of the individuals included in a GWAS of mostly un-related individuals will always increase power (15) and should be considered whenever phe-notyped relatives for the individuals to be geno-typed in a scan are available. This will often be the case when individuals to be scanned are se-lected from a larger sample of related individu-als that was previously phenotyped for linkage analyses or family-based association testing.
IMPUTATION IN SAMPLES OF UNRELATED INDIVIDUALS Analyses of related individuals provide the intu-ition behind genotype imputation: Whenever a particular stretch of chromosome is examined in detail in at least one individual, we learn about the genotypes of many other individu-als who inherit that same stretch IBD. When studying samples of apparently unrelated indi-viduals, the same approach can be utilized. The major difference is that, when studying appar-ently unrelated individuals, shared haplotype stretches will be much shorter (because com-mon ancestors are more distant) and thus may be harder to identify with confidence. The in-tuition that short stretches of haplotype pro-vide useful information about untyped genetic markers provides the justification for the power gains suggested for many haplotype analysis strategies (22, 60, 91, 115).
The mechanics of genotype imputation in unrelated individuals are illustrated in Figure 2. Here, study samples genotyped for a relatively large number of genetic markers
....A...A....A... ....G...C....A...
CGAGATCTCCTTCTTCTGTGC CGAGATCTCCCGACCTCATGG CCAAGCTCTTTTCTTCTGTGC CGAAGCTCTTTTCTTCTGTGC CGAGACTCTCCGACCTTATGC
TGGGATCTCCCGACCTCATGG CGAGATCTCCCGACCTTGTGC CGAGACTCTTTTCTTTTGTAC CGAGACTCTCCGACCTCGTGC CGAAGCTCTTTTCTTCTGTGC
....A...A....A... ....G...C....A...
CGAGATCTCCTTCTTCTGTGC CGAGATCTCCCGACCTCATGG CCAAGCTCTTTTCTTCTGTGC CGAAGCTCTTTTCTTCTGTGC CGAGACTCTCCGACCTTATGC
TGGGATCTCCCGACCTCATGG CGAGATCTCCCGACCTTGTGC CGAGACTCTTTTCTTTTGTAC CGAGACTCTCCGACCTCGTGC CGAAGCTCTTTTCTTCTGTGC
cgagAtctcccgAcctcAtgg cgaaGctcttttCtttcAtgg
CGGCCCCCGGCAATTTTTTTT
CGAGATCTCCCGACCTCATGG CCAAGCTCTTTTCTTCTGTGC CGAAGCTCTTTTCTTCTGTGC CGAGACTCTCCGACCTTATGC
TGGGATCTCCCGACCTCATGG CGAGATCTCCCGACCTTGTGC CGAGACTCTTTTCTTTTGTAC CGAGACTCTCCGACCTCGTGC CGAAGCTCTTTTCTTCTGTGC
Study sample
a
Reference haplotypes
Study sample
Reference haplotypes
b
Study sample
Reference haplotypes
c
Figure 2
Genotype imputation in a sample of apparently unrelated individuals. (a) The observed data, which consists of genotypes at a modest number of genetic markers in each sample being studied and, in addition, of detailed information on genotypes (or haplotypes) for a reference sample. (b) The process of identifying regions of chromosome shared between a study sample and individuals in the reference panel. When a typical sample of European ancestry is compared to haplotypes in the HapMap reference panel, stretches of
>100 kb in length are usually identified. With a larger reference panel, larger shared segments would be expected. (c) Observed genotypes and haplotype sharing information have been combined to fill in a series of unobserved genotypes in the study sample.
(perhaps 100,000–1,000,000) are compared to a reference panel of haplotypes that includes detailed information on a much larger number of markers (Figure 2a). To date, the HapMap Consortium database has typically served as the reference panel (104), but we expect that in the future larger sets of individuals characterized at larger numbers of markers will be available. Stretches of shared haplotype are then iden-tified (Figure 2b) and missing genotypes for each study sample can be filled in by copying alleles observed in matching reference haplo-types (Figure 2c). In analyses of samples of European ancestry, comparisons with geno-types for the HapMap CEU panel typically yield shared haplotypes that range from about
Annu. Rev. Genom. Hum. Genet. 2009.10:387-406. Downloaded from www.annualreviews.org
100–200 kb in length. Thus, in a GWAS that examines 300,000 SNP markers, these shared stretches generally include 10–20 genotyped markers. When there is ambiguity about which haplotype stretch should be “copied” to fill in missing genotypes for a particular individual, most imputation programs provide an answer that summarizes this ambiguity probabilisti-cally (for example, in 60% of reconstructions genotype A/A was observed at a specific site, whereas in the remaining 40% a different geno-type A/C was observed).
In principle, any of the methods typically used to estimate missing haplotypes—whether based on a simple heuristic (18), on an E-M algorithm (30), or on more sophisticated co-alescent models (99) could be used to impute missing genotypes. In fact, most haplotyping programs will automatically “impute” missing genotypes during the haplotype estimation pro-cess. In practice, most researchers now use one of the tools that have been specifically en-hanced to facilitate genotype imputation-based analyses. These tools generally provide conve-nient summaries of the uncertainty surrounding each genotype estimate or, perhaps, convenient built-in association testing. Genotype imputa-tion tools fall into two main categories: (a) com-putationally intensive tools such as IMPUTE (64), MACH (59), and fastPHASE/BIMBAM (92, 95) that take into account all observed genotypes when imputing each missing geno-type, and (b) computationally more efficient tools such as PLINK (80), TUNA (71), WHAP (114), and BEAGLE (11) that usually focus on genotypes for a small number of nearby markers when imputing each missing genotype. Tools in the first category can be further subdivided into those that compare the potential haplo-types for each individual with all other ob-served haplotypes (e.g., IMPUTE and MACH) and those that compare potential haplotypes for each individual to a representative set of haplo-types (e.g., fastPHASE). Tools that consider all available markers and all available haplotypes can require substantially more intensive com-putation but generally do better at estimating
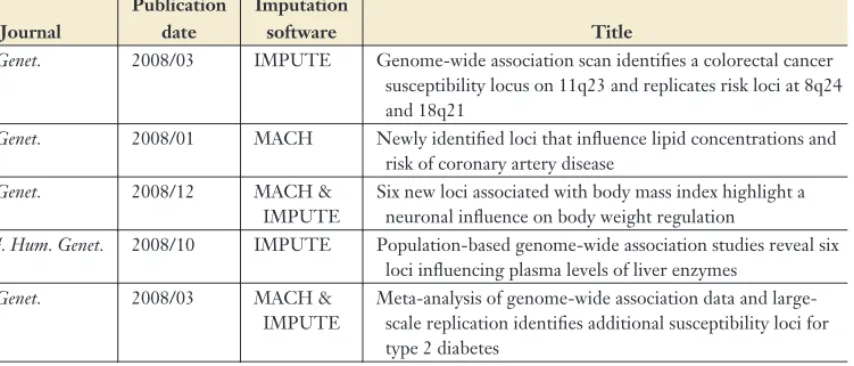
missing genotypes, particularly for rare poly-morphisms. Table 1 provides a partial list of recent genome-wide association scans that used genotype imputation, together with the method(s) used for imputing missing genotypes in each scan.
ACCURACY OF GENOTYPE IMPUTATION-BASED ANALYSIS Our first experience with genotype imputation in the context of a genetic association study occurred when fine-mapping the Complement Factor H susceptibility locus for age-related macular degeneration (58). This locus shows evidence for multiple disease-associated alleles and haplotypes (58, 63). Since multimarker as-sociation analyses are much more convenient in the absence of missing genotype data (5), we used the program PHASE (97, 98) and an early version of our MACH software (59) to fill in missing genotypes in our sample. In the absence of missing data, it is much easier to compare the evidence for association at different mark-ers and to interpret the results of conditional association analyses that seek to identify inde-pendently associated markers. To validate our imputation approach, we masked 5% of the genotypes at the locus and showed that these could be imputed correctly>99% of the time by comparing each individual with a missing genotype to other individuals who shared a common haplotype or haplotypes.
The first few applications of genotype im-putation on a genome-wide scale also involved considerable effort to validate the accuracy of imputed genotypes. For example, in the first published account of the performance of geno-type imputation in the context of a genome-wide scan, Scott et al. (93) genotyped a set of type 2 diabetes cases and controls at ap-proximately 300,000 SNPs. They then imputed genotypes at an additional>2 million SNPs to facilitate comparisons with the results of two other genome-wide association scans for type 2 diabetes that relied on a different genotyping platforms (90, 117). To evaluate the accuracy
Annu. Rev. Genom. Hum. Genet. 2009.10:387-406. Downloaded from www.annualreviews.org
Table 1 Examples of GWAS that have used genotype imputation
First author Journal
Publication date
Imputation
software Title
Aulchenko (4) Nat. Genet. 2008/12 MACH Loci influencing lipid levels and coronary heart disease risk in 16 European population cohorts
Barrett (6) Nat. Genet. 2008/06 MACH & IMPUTE
Genome-wide association defines more than 30 distinct susceptibility loci for Crohn’s disease
Broadbent (10)
Hum. Mol. Genet. 2007/11 MACH Susceptibility to coronary artery disease and diabetes is encoded by distinct, tightly linked SNPs in the ANRIL locus on chromosome 9p
Chambers (14) Nat. Genet. 2008/05 MACH Common genetic variation near MC4R is associated with waist circumference and insulin resistance
Chen (16) J. Clin. Invest. 2008/07 MACH Variations in the G6PC2/ABCB11 genomic region are associated with fasting glucose levels
Cooper (20) Blood 2008/06 BIMBAM A genome-wide scan for common genetic variants with a large influence on warfarin maintenance dose
Dehghan (26) Lancet 2008/10 MACH Association of three genetic loci with uric acid concentration and risk of gout: a genome-wide association study Ferreira (32) Nat. Genet. 2008/07 PLINK &
MACH
Collaborative genome-wide association analysis supports a role for ANK3 and CACNA1C in bipolar disorder Hung (41) Nature 2008/04 MACH A susceptibility locus for lung cancer maps to nicotinic
acetylcholine receptor subunit genes on 15q25 Kathiresan
(44)
Nat. Genet. 2008/12 MACH Common variants at 30 loci contribute to polygenic dyslipidemia
Lettre (56) Nat. Genet. 2008/04 MACH Identification of ten loci associated with height highlights new biological pathways in human growth
Liu (61) Hum. Mol. Genet. 2008/03 IMPUTE Genome-wide association scans identified CTNNBL1 as a novel gene for obesity
Loos (62) Nat. Genet. 2008/05 MACH & IMPUTE
Common variants near MC4R are associated with fat mass, weight and risk of obesity
O’Donovan (74)
Nat. Genet. 2008/07 IMPUTE Identification of loci associated with schizophrenia by genome-wide association and follow-up
Rafiq (81) Diabetologia 2008/10 MACH & IMPUTE
Gene variants influencing measures of inflammation or predisposing to autoimmune and inflammatory diseases are not associated with the risk of type 2 diabetes
Raychaudhuri (82)
Nat. Genet. 2008/09 IMPUTE Common variants at CD40 and other loci confer risk of rheumatoid arthritis
Sabatti (84) Nat. Genet. 2008/12 WHAP Genome-wide association analysis of metabolic traits in a birth cohort from a founder population
Sanders (86) Am. J. Psychiatry 2008/01 MACH No significant association of 14 candidate genes with schizophrenia in a large European ancestry sample: implications for psychiatric genetics
Sandhu (87) Lancet 2008/02 IMPUTE LDL-cholesterol concentrations: a genome-wide association study
Sanna (89) Nat. Genet. 2008/01 MACH Common variants in the GDF5-UQCC region are associated with variation in human height
Scott (93) Science 2007/04 MACH A genome-wide association study of type 2 diabetes in Finns detects multiple susceptibility variants
(Continued)
Annu. Rev. Genom. Hum. Genet. 2009.10:387-406. Downloaded from www.annualreviews.org
Table 1 (Continued)
First author Journal
Publication date
Imputation
software Title
Tenesa (100) Nat. Genet. 2008/03 IMPUTE Genome-wide association scan identifies a colorectal cancer susceptibility locus on 11q23 and replicates risk loci at 8q24 and 18q21
Willer (111) Nat. Genet. 2008/01 MACH Newly identified loci that influence lipid concentrations and risk of coronary artery disease
Willer (112) Nat. Genet. 2008/12 MACH & IMPUTE
Six new loci associated with body mass index highlight a neuronal influence on body weight regulation
Yuan (113) Am. J. Hum. Genet. 2008/10 IMPUTE Population-based genome-wide association studies reveal six loci influencing plasma levels of liver enzymes
Zeggini (116) Nat. Genet. 2008/03 MACH & IMPUTE
Meta-analysis of genome-wide association data and large-scale replication identifies additional susceptibility loci for type 2 diabetes
of imputed genotypes, they contrasted imputed genotypes generatedin silicowith experimental genotypes generated in the lab for>500 SNPs, including 16 SNPs with imputation-based p-values of<10−5(see online supplementary ma-terial in Reference 93). Their results showed excellent concordance between genotype calls, estimated allele frequencies, and test statistics for both types of data, with an overall allelic discrepancy rate of<1.50% between genotyped and imputed SNPs.
Similar comparisons with newer genotyping platforms, which can provide better coverage of the genome because they include larger num-bers of tag SNPs, show that imputed genotypes can achieve even greater accuracy. For example, in the GAIN psoriasis study (69), imputed and experimentally derived genotypes were com-pared at>660,000 SNPs in 90 individuals with an overall allelic discrepancy rate of<0.90% and an r2 correlation between observed and imputed allele counts that averaged 0.93. The r2correlation coefficient is a particular useful summary of the effect of genotype imputation on power: In the context of the GAIN psori-asis study we expect that, on average, imput-ing genotypes for one of the 660,000 evaluated markers in 1000 individuals would provide sim-ilar information to that obtained by genotyping the same marker in 930 individuals (69).
POWER OF GENOTYPE
IMPUTATION-BASED ANALYSES One obvious use of genotype imputation-based analysis is to accelerate fine-mapping studies. Once an association signal has been identi-fied and confirmed, genotype imputation can be used to evaluate the evidence for associa-tion at each of several nearby SNPs and help focus the search for potential causal variants. An example of this approach occurs in the fine-mapping study of Orho-Melander et al. (76). To fine-map an association signal linking SNPs in the glucokinase regulatory protein (GCKR) gene and triglyceride levels in blood, Orho-Melander et al. examined evidence for associa-tion with genotyped and imputed SNPs in the region and showed that an imputed common missense variant in the GCKR gene was more strongly associated with triglyceride levels than any other nearby SNP, a result that was subse-quently confirmed by direct genotyping (76).
Although we agree that examining evidence for association at imputed markers can be ex-tremely useful in the context of fine-mapping association signals, genotype imputation is also expected to increase the power of GWAS. For example, Willer et al. (111) and Kathiresan et al. (43) showed that rs6511720, a common variant in the low-density lipoprotein recep-tor gene (LDLR), was strongly associated with
Annu. Rev. Genom. Hum. Genet. 2009.10:387-406. Downloaded from www.annualreviews.org
LDLR locus and LDL cholesterol
0 1 2 3 4 5 6 7
–log
10
p−value for LDL
Imputed Affy500k Illu317k
Imputed SNPs Affy 500k
0 20 40 60 80 100
cM/Mb
10.9 11.0 11.1 11.2
Position on chromosome 19 (Mb)
CARM1 → ←YIPF2 C19orf52 →
SMARCA4 →
LDLR →
←SPC24
←KANK2
←DOCK6 LOC55908 →
PDGI+SardiNIA = 1.7 x 10⁻⁶
Figure 3
Association of genetic variants nearLDLRwith LDL-cholesterol levels. We use data from the SardiNIA (94) and Diabetes Genetics Initiative (DGI, 90) studies reported by Willer et al. (111). Evidence for association at each SNP, measured as log10p-value, is represented along the y-axis. The placement of each SNP along the x-axis corresponds to assigned chromosomal location in the current genome build. Results for directly genotyped SNPs are colored in red, imputed SNPs in blue. Note that rs6511720, the SNP showing strongest association in the region, is not well tagged by any of the variants on the Affymetrix genotyping arrays used in the SardiNIA and DGI studies. Evidence for association at the SNP increases to p<10−25 after follow-up in>10,000 individuals in whom the SNP was genotyped directly (111). Association results are superimposed on a gray line that summarizes the local recombination rate map. The bottom panel indicates coding sequences in the region. The putative functional gene, LDLR, is highlighted in blue.
blood low density lipoprotein (LDL) choles-terol levels (Figure 3). The association signal was missed in an initial analysis that considered only genotyped SNPs because rs6511720 is not included in the Affymetrix arrays used to scan the genome in the majority of their samples and is only poorly tagged by individual SNPs on the chip (the best single marker tag is rs12052058 with pairwise r2of only 0.21). Another exam-ple we have encountered concerns the genome-wide association analysis of G6PD activity
levels in a sample of Sardinian individuals (77, 94). There, analysis of directly genotyped SNPs revealed two sets of SNPs strongly associated (p < 5 × 10⁻⁸) with G6PD activity levels, one near theG6PDgene locus on chromosome X and another near the HBBlocus on chro-mosome 11. Genotype imputation revealed a strong additional signal (also with p<5×10⁻⁸) upstream of the 6PGD locus on chromo-some 1 (M. Uda, S. Sanna & D. Schlessinger, personal communication) (Figure 4). The
Annu. Rev. Genom. Hum. Genet. 2009.10:387-406. Downloaded from www.annualreviews.org
6PGD locus and G6PD activity
0 2 4 6 8 Imputed Affy500k Illu317k
PSardiNIA = 1 × 10⁻⁸
Imputed SNPs Affy 500k
0 20 40 60 80 100
cM/Mb
10.1 10.2 10.3 10.4
Position on chromosome 1 (Mb)
UBE4B →
KIF1B →
6PGD →
APITD1 →
CORT → ← DFFA
PEX14 →
–log
10
p−value for G6PD
Figure 4
Association of genetic variants near6PGDwith measurements of G6PD activity. We use data from the SardiNIA study (94). Evidence for association at each SNP, measured as log10p-value, is represented along the y-axis. The placement of each SNP along the x-axis corresponds to assigned chromosomal location in the current genome build. Results for directly genotyped SNPs are colored in red, imputed SNPs in blue. Although there is evidence for association in the region prior to imputation, the signal increases substantially enough to reach genome-wide significance after imputation. The connection between 6PGD activity and measurements of G6PD activity is long established (13). Association results are superimposed on a gray line that summarizes the local recombination rate map. The bottom panel indicates coding sequences in the region. The putative functional gene, 6PGD, is highlighted in blue.
three signals (nearG6PD, HBB, and6PGD) all fit our understanding of the biological basis of measurements of G6PD activity: (a) The role of variants nearG6PDin the regulation of G6PD activity in Sardinia and elsewhere is well estab-lished (25), (b) variants in theHBB locus can influence the life span and rate of turnover of red blood cells and because G6PD activity is higher in younger red blood cells the same poly-morphisms indirectly influence G6PD activity levels (70) and (c) 6PGD activity levels are com-monly used as an internal standard in assays for G6PD activity so that changes in 6PGD activity
will influence estimates of G6PD activity (13, 31, 68a).
Overall, the LDLR and 6PGD loci, to-gether with many other anecdotal examples, suggest that genotype imputation can improve the power of genome-wide association analy-ses. Nevertheless, accurately estimating the im-pact of genotype imputation on the power of a GWAS is more challenging. We have tried to accurately quantify this potential power gain in two ways: first, by generating and analyz-ing simulated datasets; and second, by analyzanalyz-ing datasets that combine genome-wide genotype
Annu. Rev. Genom. Hum. Genet. 2009.10:387-406. Downloaded from www.annualreviews.org
data and large-scale surveys of gene expres-sion. The second approach is especially attrac-tive because true posiattrac-tive associations between genetic variants and transcript levels are easy to identify (they often map to the locus en-coding the transcript). Both approaches sug-gest that genotype imputation can increase the power of gene-mapping studies, particularly when the associated variants have frequencies of<10%–20%. When we imputed genotypes and then reanalyzed the gene expression data of Dixon et al. (28), we mapped, on average, 10% more genome-wide association peaks to the locus surrounding each transcript than be-fore imputation (L. Liang, W.O.C. Cookson & G.R. Abecasis, unpublished data).
META-ANALYSIS OF GENOME-WIDE ASSOCIATION SCANS
Perhaps the most dramatic illustration of the utility of genotype imputation has been the abil-ity of researchers to conduct meta-analyses of genome-wide association scans even in sam-ples that were originally genotyped using sev-eral different platforms. Genotype imputation was first used to combine GWAS for blood lipid levels (43, 111) and height (89) and soon there-after to combine data across genome-wide scans for type 2 diabetes (116), body-mass index (62), and Crohn’s disease (6). The success of these meta-analyses can be dramatic: in the case of blood lipid levels (43, 111) a meta-analysis of three studies with relatively modest findings (each identifying one to three strongly associ-ated loci) resulted in a total of 19 strongly asso-ciated loci including 7 loci not previously impli-cated in regulating cholesterol and lipoprotein levels in humans. Because it greatly simplifies is-sues related to examining data collected on mul-tiple different platforms, genotype imputation also makes it simple for researchers to compare results of GWAS that target related traits. In this way, it has been possible to contrast results from genetic studies of blood lipid levels (111) with those of previous studies of coronary artery disease (105), to compare results of studies of
blood glucose levels in nondiabetic individuals (79) with those of previous case-control studies of type 2 diabetes (116), and to compare re-sults of studies of height (89) to those of pre-vious studies of osteoarthritis (68). We expect that these sorts of contrasts between the results of genome-wide studies for different traits will become ever more commonplace and that they will ultimately provide useful insights about the genetic basis of many complex human traits.
IMPUTATION-BASED ANALYSIS IN NON-EUROPEAN SAMPLES While most GWAS completed to date have fo-cused on populations of European ancestry (see Table 1 for examples), we expect that many GWAS will be conducted in much more diverse groups of samples. The success of genotype imputation depends critically on the choice of reference population from which densely char-acterized haplotypes are drawn. For studies of European ancestry samples, it is now clear that the HapMap CEU samples (102–104) usually constitute an appropriate reference panel. Sim-ilarly, we expect the HapMap CHB + JPT (102–104) samples will constitute a good ref-erence for imputing genotypes in samples of East Asian ancestry and that the HapMap YRI (102–104) samples will constitute a good refer-ence for imputing genotypes in populations of West African ancestry.
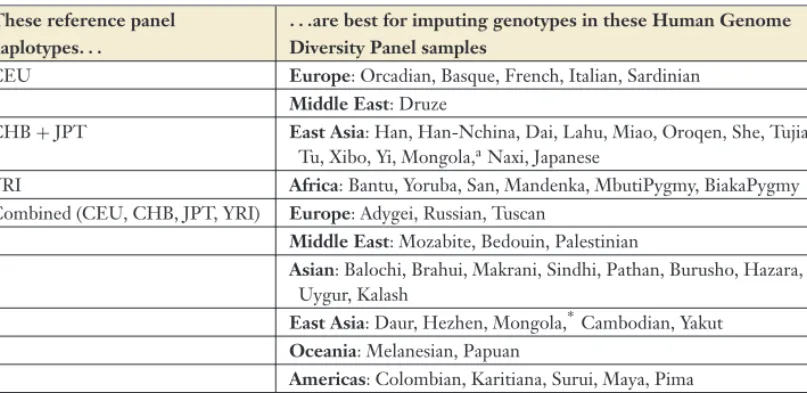
Studies of populations that are genetically more distinct from those examined by the HapMap consortium will require more care-ful consideration in the design of strategies for genotype imputation. For example, we expect that when imputing missing genotypes in Mid-dle Eastern samples, Native American samples, or even samples from the Indian subcontinent, it will be advantageous to use a reference panel that includes all HapMap haplotypes, rather than just the CEU, just the YRI, or just the CHB + JPT haplotypes (59). Fortunately, whenever the choice of reference panel is un-clear, it is possible to mask a subset of the avail-able genotype data, run genotype imputation using each of the different reference panels
Annu. Rev. Genom. Hum. Genet. 2009.10:387-406. Downloaded from www.annualreviews.org
Table 2 Recommended choices of HapMap reference panel haplotypes for imputing genotypes in Human Genome Diversity Panel different samples
These reference panel haplotypes. . .
. . .are best for imputing genotypes in these Human Genome Diversity Panel samples
CEU Europe: Orcadian, Basque, French, Italian, Sardinian
Middle East: Druze
CHB+JPT East Asia: Han, Han-Nchina, Dai, Lahu, Miao, Oroqen, She, Tujia, Tu, Xibo, Yi, Mongola,aNaxi, Japanese
YRI Africa: Bantu, Yoruba, San, Mandenka, MbutiPygmy, BiakaPygmy
Combined (CEU, CHB, JPT, YRI) Europe: Adygei, Russian, Tuscan
Middle East: Mozabite, Bedouin, Palestinian
Asian: Balochi, Brahui, Makrani, Sindhi, Pathan, Burusho, Hazara, Uygur, Kalash
East Asia: Daur, Hezhen, Mongola,∗Cambodian, Yakut Oceania: Melanesian, Papuan
Americas: Colombian, Karitiana, Surui, Maya, Pima
aTie.The Human Genome Diversity Panel Mongola samples are equally well imputed using either the combined HapMap
samples (CEU, CHB, JPT, and YRI) or just the CHB+JPT samples as a reference. This analysis summarized in this table
is adapted from Reference 59. The analysis used estimated haplotypes from Reference 104 and genotype data from Reference 19.
being considered, and then contrast imputed and masked genotypes to identify the strat-egy that provides the most accurate genotypes. Table 2summarizes the results of a recent anal-ysis (59) that sought to identify the most appro-priate reference panel for a series of samples in the Human Genome Diversity Panel (19).
An alternative to using the HapMap samples as a reference is to genotype a subset of study samples for additional markers of interest and then use these as templates for genotype impu-tation in the remaining samples. This approach was used by Chambers et al. (14) to combine data across three different platforms in a recent study of the genetics of obesity focused on in-dividuals of South Asian ancestry. Compared to approaches that use the HapMap as a reference, this strategy can greatly reduce imputation error (14).
PRACTICAL CONSIDERATIONS In this review, we have tried to provide readers with an intuition about why genotyping impu-tation methods work, described their history in the context of GWAS, and summarized some
examples of current uses of genotype imputa-tion. For readers who are encouraged to at-tempt genotype imputation in their own sam-ples, we now summarize important practical issues to consider when carrying out geno-type imputation-based analyses. In particular, we focus on issues encountered when develop-ing, implementdevelop-ing, and supporting our Markov Chain Haplotyping (MACH) software package for haplotype estimation and genotype imputa-tion. As with other analyses of genetic associa-tion data, we recommend that a standard set of quality filters be used to exclude markers with poor-quality genotypes prior to imputa-tion. These quality filters typically flag markers that have low call rates, significant evidence for deviations from Hardy-Weinberg equilibrium, a large rate of discrepancies between dupli-cate genotypes, or evidence for non-Mendelian inheritance (67).
When using an external reference panel as a template for imputation, the most important challenge for successfully imputing genotypes in genome scan samples is to ensure that alle-les are labeled consistently (that is, on the same strand) in the reference panel and in the samples
Annu. Rev. Genom. Hum. Genet. 2009.10:387-406. Downloaded from www.annualreviews.org
being imputed. MACH checks that allele fre-quencies are similar in the reference panel and in the samples, but it cannot catch all errors. In practice, we have found it extremely useful to genotype a small number of HapMap samples as part of each genome-wide scan—this helps both to evaluate genotyping error rates and to ensure that consistency of allele labels can be easily checked.
Once this first hurdle has been surpassed, the next step is to impute missing genotypes for each sample. As noted above and inTable 2, a key step is to select an appropriate set of refer-ence haplotypes. Different choices of referrefer-ence panel can be assessed by masking a subset of the available genotypes and checking whether these can be recovered accurately. After a refer-ence panel has been selected and imputation is complete, a key issue is to decide which mark-ers to take forward for analysis. Typically, not all markers can be accurately imputed, and sev-eral different measures have been proposed to help identify well-imputed markers. The sim-plest of these measures focuses on the aver-age probability that an imputed genotype call is correct—in this context for example, one might look for markers where genotypes are imputed with>90% accuracy. We do not recommend this type of measure because it is not very mean-ingful when comparing markers with different allele frequencies (for example, if a marker has an allele frequency of<5%, it should be possi-ble to achieve 90% accuracy by simply assigning the most common genotype to every individ-ual). Instead, we typically recommend measures that try to capture the correlation between im-puted genotype calls and the true underlying genotypes—usually expressed as an r2 coeffi-cient. Generally these measures are calculated by comparing the variance in a set of imputed allele counts to theoretical expectations based on Hardy-Weinberg equilibrium (because im-puted allele counts for poorly imim-puted markers show less variability than expected based on al-lele frequency).
The final step is to analyze the resulting im-puted “genotypes.” MACH and other genotype imputation programs represent imputation
results in a variety of ways. Usually, imputed genotypes are probabilistic rather than discrete. For example, a particular individual might have a 90% probability of carrying genotype A/A and a 10% probability of carrying genotype A/C at a specific marker—corresponding to 1.9 ex-pected copies of allele A. We do not recom-mend transforming these “probabilistic” geno-type calls into discrete genogeno-types as that can result in a substantial loss of information, espe-cially for less common alleles. Generally, im-puted allele counts for each allele (e.g., 1.9 expected copies of allele A) can conveniently be tested for association with quantitative or discrete traits using an appropriate regression model. Of course, as in other genetic associa-tion analyses, adequate adjustment for poten-tial population stratification is essenpoten-tial (27, 36, 78). If ancestry-informative principal compo-nents are to be estimated from genetic data (78), this should be done before imputation.
If results from multiple studies are to be combined, each study should be analyzed in-dividually and results should then be meta-analyzed across studies using standard ap-proaches (see 89, 111, 112, 116 for examples). We do not recommend pooling data across studies as an alternative to meta-analysis, es-pecially when these have been genotyped using different platforms.
CHALLENGES FOR THE FUTURE The technologies used in human genetic stud-ies are rapidly improving. We expect several enhancements to genetic imputation technolo-gies. First, as better characterized reference panels are developed, it should become possible to use genotype imputation methods to study not only single-nucleotide polymorphisms but also other types of genetic variants, such as copy-number variants (33, 66) or classical HLA types (55). Second, improved algorithms for genotype imputation will likely be developed to tackle ever more complex problems. Sim-ilar pressures previously motivated continued development of methods for pedigree analysis, both for large pedigrees (29, 51, 54, 73) and
Annu. Rev. Genom. Hum. Genet. 2009.10:387-406. Downloaded from www.annualreviews.org
75 100
0 25 50
0
Proportion of genome covered (%)
r2 between imputed and actual genotypes N = 60 individuals
N = 200 individuals N = 500 individuals
1.0 0.8
0.6 0.4
0.2
Figure 5
Genome coverage as a function of reference panel size. The accuracy of imputation increases with the number of individuals in the reference panel. To generate the figure, we analyzed genotyped data from the FUSION study (93). For any given r2threshold, the results illustrate the proportion of markers whose genotypes can be imputed with equal or greater accuracy. The results illustrate how the proportion of markers whose genotypes are recovered accurately (with high r2between imputed and actual genotypes) increases with larger reference panels.
for smaller ones (2, 37, 46–48, 65). Still, the most useful advance, in the context of geno-type imputation-based analyses, would be the development of larger reference panels. As il-lustrated inFigure 5, the accuracy of geno-type imputation-based analyses should increase substantially as the size of reference panels in-creases. This increase in accuracy occurs be-cause haplotype stretches shared between study samples and samples in the reference panel in-crease in length and are easier to identify un-ambiguously with a larger reference panel.
IMPUTATION AND GENOME-WIDE
RESEQUENCING DATA
So far, we have focused our discussion on the analysis of genotype data. However, genome sequencing technologies are also improving ex-tremely rapidly. Whereas the first two human whole genome assemblies took years to com-plete (49, 107), several additional genomes have been assembled just in the past 18 months (7, 57, 110). These advances in whole genome se-quencing have resulted from the deployment of massive throughput sequencing technologies,
which differ from standard Sanger-based se-quencing (88) in many ways. For example, the data produced by these new technologies typi-cally have somewhat higher error rates (on the order of 1% per base). Since these technolo-gies produce very large amounts of data, one typically accommodates these error rates by re-sequencing every site of interest many times to achieve a high-quality consensus.
We expect that the continued deployment of these technologies will significantly change how genotype imputation is used. An exam-ple is given by the 1000 Genomes Project (see http://www.1000genomes.org), which aims to deliver whole genome sequences for>1000 individuals from several different populations in the next 12 months. To do this in a cost-effective manner, the project is using a strat-egy that combines massively parallel shotgun sequencing technology with the same statistical machinery used to drive genotype imputation-based analyses. Specifically, a relatively mod-est amount of shotgun sequence data is be-ing collected for each individual: Each of the target bases will be resequenced only 2–4x on average (statistical fluctuations around this av-erage mean that many bases will not be cov-ered even once), rather than the 20–40x used in conventional applications of these technolo-gies to whole genome resequencing. To accu-rately call polymorphisms in each genome, the Project will then use imputation-based tech-niques to combine information across individ-uals who share a particular haplotype stretch. Using simulations, we have predicted that when 400 diploid individuals are sequenced at only 2x depth (1x per haploid genome) and the data are analyzed using approaches that combine data across individuals sharing similar haplotype stretches, polymorphic sites with a frequency of>2% can be genotyped with>99.5% accu-racy (Y. Li & G. Abecasis, unpublished data). Note that the same 2x average depth would not be useful for genotype calling when examining a single individual—since, by chance,∼37% of alleles would not be sampled. For another ex-ample of how genotype imputation can be com-bined with sequence data, see Reference 72.
Annu. Rev. Genom. Hum. Genet. 2009.10:387-406. Downloaded from www.annualreviews.org
The ability to combine relatively modest amounts of sequence data across many indi-viduals to generate high-quality sequence data for all may become one of the most common uses of imputation technologies in the near future. For a given sequencing effort, geno-type imputation-based analyses may allow an increase in the number of individuals to be se-quenced by five- to tenfold with minimal loss of accuracy in individual genotypes. Such an increase in sample size is critical when attempt-ing to map the genes for complex diseases. Of course, even before massively parallel sequenc-ing technologies are deployed more widely, one immediate change will occur with the completion of the 1000 Genome Project (see http://www.1000genomes.org). Specifically, we expect these data will provide accurate geno-type information on>10 million common vari-ants and quickly replace the HapMap Consor-tium genotypes as the reference panel of choice
for imputation studies. Thus imputation-based analyses will be able to examine even more ge-netic markers, and each of these markers will, on average, be imputed much more accurately.
CONCLUSIONS
In the past two years, genotype imputation-based analyses have become a key tool for the analysis of human genetic data. They have been used to aid fine-mapping studies, to increase the power of genome wide association studies, to extract maximum value from existing fam-ily samples, and to facilitate meta-analysis of genome-wide association data. In the next few years, we expect these imputation-based analy-ses will become a key tool in the analysis of mas-sively parallel shotgun sequence data, enabling geneticists to rapidly deploy these technologies to analyze large samples and dissect the genetic basis of complex disease.
DISCLOSURE STATEMENT
The authors are not aware of any affiliations, memberships, funding, or financial holdings that might be perceived as affecting the objectivity of this review.
ACKNOWLEDGMENTS
We thank S. Kathiresan, K. Mohlke, D. Schlessinger, and M. Uda for the example relating common variants nearLDLRand LDL-cholesterol levels. We thank D. Schlessinger and M. Uda for the example relating variants near6PGDto G6PD activity levels. Finally, we thank M. Boehnke, K. Mohlke, and FUSION colleagues for the data used to generateFigure 5. Yun Li was supported in part by a Rackham Merit fellowship. Cristen Willer was supported in part by an American Diabetes Association Fellowship. Gonc¸alo Abecasis is a Pew Scholar for the Biomedical Sciences. This research was supported in part by research grants HG-2651, HL-84729, and MH-84698.
LITERATURE CITED
1. Abecasis GR, Cardon LR, Cookson WOC. 2000. A general test of association for quantitative traits in nuclear families.Am. J. Hum. Genet.66:279–92
2. Abecasis GR, Cherny SS, Cookson WO, Cardon LR. 2002. Merlin–rapid analysis of dense genetic maps using sparse gene flow trees.Nat. Genet.30:97–101
3. Abecasis GR, Wigginton JE. 2005. Handling marker-marker linkage disequilibrium: pedigree analysis with clustered markers.Am. J. Hum. Genet.77:754–67
4. Aulchenko YS, Ripatti S, Lindqvist I, Boomsma D, Heid IM, et al. 2008. Loci influencing lipid levels and coronary heart disease risk in 16 European population cohorts.Nat. Genet.41:47–55
5. Balding DJ. 2006. A tutorial on statistical methods for population association studies.Nat. Rev. Genet. 7:781–91
Annu. Rev. Genom. Hum. Genet. 2009.10:387-406. Downloaded from www.annualreviews.org
6. Barrett JC, Hansoul S, Nicolae DL, Cho JH, Duerr RH, et al. 2008. Genome-wide association defines more than 30 distinct susceptibility loci for Crohn’s disease.Nat. Genet.40:955–62
7. Bentley DR, Balasubramanian S, Swerdlow HP, Smith GP, Milton J, et al. 2008. Accurate whole human genome sequencing using reversible terminator chemistry.Nature456:53–59
8. Boerwinkle E, Chakraborty R, Sing CF. 1986. The use of measured genotype information in the analysis of quantitative phenotypes in man. I. Models and analytical methods.Ann. Hum. Genet.50:181–94 9. Botstein D, Risch N. 2003. Discovering genotypes underlying human phenotypes: past successes for
Mendelian disease, future approaches for complex disease.Nat. Genet.33(Suppl.):228–37
10. Broadbent HM, Peden JF, Lorkowski S, Goel A, Ongen H, et al. 2008. Susceptibility to coronary artery disease and diabetes is encoded by distinct, tightly linked SNPs in the ANRIL locus on chromosome 9p. Hum. Mol. Genet.17:806–14
11. Browning SR. 2006. Multilocus association mapping using variable-length Markov chains.Am. J. Hum. Genet.78:903–13
12. Burdick JT, Chen WM, Abecasis GR, Cheung VG. 2006. In silico method for inferring genotypes in pedigrees.Nat. Genet.38:1002–4
13. Catalano EW, Johnson GF, Solomon HM. 1975. Measurement of erythrocyte glucose-6-phosphate dehydrogenase activity with a centrifugal analyzer.Clin. Chem.21:134–38
14. Chambers JC, Elliott P, Zabaneh D, Zhang W, Li Y, et al. 2008. Common genetic variation near MC4R is associated with waist circumference and insulin resistance.Nat. Genet.40:716–18
15. Chen WM, Abecasis GR. 2007. Family based association tests for genome wide association scans.Am. J. Hum. Genet.81:913–26
16. Chen WM, Erdos MR, Jackson AU, Saxena R, Sanna S, et al. 2008. Variations in the G6PC2/ABCB11 genomic region are associated with fasting glucose levels.J. Clin. Invest.118:2620–28
17. Cheung VG, Spielman RS, Ewens KG, Weber TM, Morley M, Burdick JT. 2005. Mapping determinants of human gene expression by regional and genome-wide association.Nature437:1365–69
18. Clark AG. 1990. Inference of haplotypes from PCR-amplified samples of diploid populations.Mol. Biol. Evol.7:111–22
19. Conrad DF, Andrews TD, Carter NP, Hurles ME, Pritchard JK. 2006. A high-resolution survey of deletion polymorphism in the human genome.Nat. Genet.38:75–81
20. Cooper GM, Johnson JA, Langaee TY, Feng H, Stanaway IB, et al. 2008. A genome-wide scan for common genetic variants with a large influence on warfarin maintenance dose.Blood112:1022–27 21. Dausset J, Cann H, Cohen D, Lathrop M, Lalouel JM, White R. 1990. Centre d’etude du polymorphisme
humain (CEPH): collaborative genetic mapping of the human genome.Genomics6:575–77
22. de Bakker PI, Yelensky R, Pe’er I, Gabriel SB, Daly MJ, Altshuler D. 2005. Efficiency and power in genetic association studies.Nat. Genet.37:1217–23
23. de la Chapelle A. 1993. Disease gene mapping in isolated human populations: the example of Finland. J. Med. Genet.30:857–65
24. de la Chapelle A, Wright FA. 1998. Linkage disequilibrium mapping in isolated populations: the example of Finland revisited.Proc. Natl. Acad. Sci. USA95:12416–23
25. De Vita G, Alcalay M, Sampietro M, Cappelini MD, Fiorelli G, Toniolo D. 1989. Two point mutations are responsible for G6PD polymorphism in Sardinia.Am. J. Hum. Genet.44:233–40
26. Dehghan A, Kottgen A, Yang Q, Hwang SJ, Kao WL, et al. 2008. Association of three genetic loci with uric acid concentration and risk of gout: a genome-wide association study.Lancet372:1953–61 27. Devlin B, Roeder K. 1999. Genomic control for association studies.Biometrics55:997–1004
28. Dixon AL, Liang L, Moffatt MF, Chen W, Heath S, et al. 2007. A genome-wide association study of global gene expression.Nat. Genet.39:1202–7
29. Elston RC, Stewart J. 1971. A general model for the genetic analysis of pedigree data.Hum. Hered. 21:523–42
30. Excoffier L, Slatkin M. 1995. Maximum-likelihood estimation of molecular haplotype frequencies in a diploid population.Mol. Biol. Evol.12:921–27
31. Fan YH, Lazenbery L, Foster E, Duelm F, Grant E Jr. 2007. Improved quantitative method for G6PD deficiency detection.J. Clin. Lab. Anal.21:107–13
Annu. Rev. Genom. Hum. Genet. 2009.10:387-406. Downloaded from www.annualreviews.org
32. Ferreira MA, O’Donovan MC, Meng YA, Jones IR, Ruderfer DM, et al. 2008. Collaborative genome-wide association analysis supports a role for ANK3 and CACNA1C in bipolar disorder.Nat. Genet. 40:1042–44
33. Franke L, de Kovel CG, Aulchenko YS, Trynka G, Zhernakova A, et al. 2008. Detection, imputation, and association analysis of small deletions and null alleles on oligonucleotide arrays.Am. J. Hum. Genet. 82:1316–33
34. Fulker DW, Cherny SS, Sham PC, Hewitt JK. 1999. Combined linkage and association analysis for quantitative traits.Am. J. Hum. Genet.64:259–67
35. George VT, Elston RC. 1987. Testing of association between polymorphic markers and quantitative traits in pedigrees.Genet. Epidemiol.4:193–201
36. Guan W, Liang L, Boehnke M, Abecasis GR. 2009. Genotype-based matching to correct for population stratification in large-scale case-control genetic association studies.Genet. Epidemiol.In press
37. Gudbjartsson DF, Jonasson K, Frigge ML, Kong A. 2000. Allegro, a new computer program for multi-point linkage analysis.Nat. Genet.25:12–13
38. Heath SC. 1997. Markov chain Monte Carlo segregation and linkage analysis for oligogenic models. Am. J. Hum. Genet.61:748–60
39. Hirschhorn JN, Daly MJ. 2005. Genome-wide association studies for common diseases and complex traits.Nat. Rev. Genet.6:95–108
40. Hugot JP, Chamaillard M, Zouali H, Lesage S, Cezard JP, et al. 2001. Association of NOD2 leucine-rich repeat variants with susceptibility to Crohn’s disease.Nature411:599–603
41. Hung RJ, McKay JD, Gaborieau V, Boffetta P, Hashibe M, et al. 2008. A susceptibility locus for lung cancer maps to nicotinic acetylcholine receptor subunit genes on 15q25.Nature452:633–37
42. Jakobsdottir J, Conley YP, Weeks DE, Mah TS, Ferrell RE, Gorin MB. 2005. Susceptibility genes for age-related maculopathy on chromosome 10q26.Am. J. Hum. Genet.77:389–407
43. Kathiresan S, Melander O, Guiducci C, Surti A, Burtt NP, et al. 2008. Six new loci associated with blood low-density lipoprotein cholesterol, high-density lipoprotein cholesterol or triglycerides in humans.Nat. Genet.40:189–97
44. Kathiresan S, Willer CJ, Peloso G, Demissie S, Musunuru K, et al. 2009. Common DNA sequence variants at thirty genetic loci contribute to polygenic dyslipidemia.Nat. Genet.41:5–6
45. Keavney B, McKenzie CA, Connell JM, Julier C, Ratcliffe PJ, et al. 1998. Measured haplotype analysis of the angiotensin-I converting enzyme gene.Hum. Mol. Genet.7:1745–51
46. Kruglyak L, Daly MJ, Reeve-Daly MP, Lander ES. 1996. Parametric and nonparametric linkage analysis: a unified multipoint approach.Am. J. Hum. Genet.58:1347–63
47. Kruglyak L, Lander ES. 1998. Faster multipoint linkage analysis using Fourier transforms.J. Comput. Biol.5:1–7
48. Lander ES, Green P. 1987. Construction of multilocus genetic linkage maps in humans.Proc. Natl. Acad. Sci. USA84:2363–67
49. Lander ES, Linton LM, Birren B, Nusbaum C, Zody MC, et al. 2001. Initial sequencing and analysis of the human genome.Nature409:860–921
50. Lander ES, Schork NJ. 1994. Genetic dissection of complex traits.Science265:2037–48
51. Lange K, Boehnke M. 1983. Extensions to pedigree analysis. V. Optimal calculation of Mendelian likelihoods.Hum. Hered.33:291–301
52. Lange K, Sinsheimer JS, Sobel E. 2005. Association testing with Mendel.Genet. Epidemiol.29:36–50 53. Lange K, Weeks D, Boehnke M. 1988. Programs for pedigree analysis: MENDEL, FISHER, and
dGENE.Genet. Epidemiol.5:471–72
54. Lathrop GM, Lalouel JM, Julier C, Ott J. 1985. Multilocus linkage analysis in humans: detection of linkage and estimation of recombination.Am. J. Hum. Genet.37:482–98
55. Leslie S, Donnelly P, McVean G. 2008. A statistical method for predicting classical HLA alleles from SNP data.Am. J. Hum. Genet.82:48–56
56. Lettre G, Jackson AU, Gieger C, Schumacher FR, Berndt SI, et al. 2008. Identification of ten loci associated with height highlights new biological pathways in human growth.Nat. Genet.40:584–91 57. Levy S, Sutton G, Ng PC, Feuk L, Halpern AL, et al. 2007. The diploid genome sequence of an individual
human.PLoS Biol.5:e254
Annu. Rev. Genom. Hum. Genet. 2009.10:387-406. Downloaded from www.annualreviews.org
58. Li M, Atmaca-Sonmez P, Othman M, Branham KE, Khanna R, et al. 2006. CFH haplotypes without the Y402H coding variant show strong association with susceptibility to age-related macular degeneration. Nat. Genet.38:1049–54
59. Li Y, Ding J, Abecasis GR. 2006. Mach 1.0: rapid haplotype reconstruction and missing genotype inference.Am. J. Hum. Genet.79:S2290
60. Lin S, Chakravarti A, Cutler DJ. 2004. Exhaustive allelic transmission disequilibrium tests as a new approach to genome-wide association studies.Nat. Genet.36:1181–88
61. Liu YJ, Liu XG, Wang L, Dina C, Yan H, et al. 2008. Genome-wide association scans identified CTNNBL1 as a novel gene for obesity.Hum. Mol. Genet.17:1803–13
62. Loos RJ, Lindgren CM, Li S, Wheeler E, Zhao JH, et al. 2008. Common variants near MC4R are associated with fat mass, weight and risk of obesity.Nat. Genet.40:768–75
63. Maller J, George S, Purcell S, Fagerness J, Altshuler D, et al. 2006. Common variation in three genes, including a noncoding variant in CFH, strongly influences risk of age-related macular degeneration. Nat. Genet.38:1055–59
64. Marchini J, Howie B, Myers S, McVean G, Donnelly P. 2007. A new multipoint method for genome-wide association studies by imputation of genotypes.Nat. Genet.39:906–13
65. Markianos K, Daly MJ, Kruglyak L. 2001. Efficient multipoint linkage analysis through reduction of inheritance space.Am. J. Hum. Genet.68:963–77
66. McCarroll SA. 2008. Extending genome-wide association studies to copy-number variation.Hum. Mol. Genet.17:R135–42
67. McCarthy MI, Abecasis GR, Cardon LR, Goldstein DB, Little J, et al. 2008. Genome-wide association studies for complex traits: consensus, uncertainty and challenges.Nat. Rev. Genet.9:356–69
68. Miyamoto Y, Mabuchi A, Shi D, Kubo T, Takatori Y, et al. 2007. A functional polymorphism in the 5 UTR of GDF5 is associated with susceptibility to osteoarthritis.Nat. Genet.39:529–33
68a. Mosca A, Paleari R, Rosti E, Luzzana M, Barella S. 1996. Simultaneous automated determination of glucose 6-phosphate dehydrogenase and 6-phosphogluconate dehydrogenase activities in whole blood. Eur. J. Clin. Chem. Clin. Biochem.34:431–38
69. Nair RP, Duffin KC, Helms C, Ding J, Stuart PE, et al. 2009. Genome-wide scan reveals association of psoriasis with IL-23 and NF-κB pathways.Nat. Genet.41:199–204
70. Nathan DG, Stossel TB, Gunn RB, Zarkowsky HS, Laforet MT. 1969. Influence of hemoglobin pre-cipitation on erythrocyte metabolism in alpha and beta thalassemia.J. Clin. Invest.48:33–41
71. Nicolae DL. 2006. Testing untyped alleles (TUNA)-applications to genome-wide association studies. Genet. Epidemiol.30:718–27
72. Nyholt DR, Yu CE, Visscher PM. 2008. On Jim Watson’s APOE status: genetic information is hard to hide.Eur. J. Hum. Genet.17:147–49
73. O’Connell JR, Weeks DE. 1995. The VITESSE algorithm for rapid exact multilocus linkage analysis via genotype set-recoding and fuzzy inheritance.Nat. Genet.11:402–8
74. O’Donovan MC, Craddock N, Norton N, Williams H, Peirce T, et al. 2008. Identification of loci associated with schizophrenia by genome-wide association and follow-up.Nat. Genet.40:1053–55 75. Ogura Y, Bonen DK, Inohara N, Nicolae DL, Chen FF, et al. 2001. A frameshift mutation in NOD2
associated with susceptibility to Crohn’s disease.Nature411:603–6
76. Orho-Melander M, Melander O, Guiducci C, Perez-Martinez P, Corella D, et al. 2008. Common mis-sense variant in the glucokinase regulatory protein gene is associated with increased plasma triglyceride and C-reactive protein but lower fasting glucose concentrations.Diabetes57:3112–21
77. Pilia G, Chen WM, Scuteri A, Orru M, Albai G, et al. 2006. Heritability of cardiovascular and personality traits in 6148 Sardinians.PLoS Genet.2:e132
78. Price AL, Patterson NJ, Plenge RM, Weinblatt ME, Shadick NA, Reich D. 2006. Principal components analysis corrects for stratification in genome-wide association studies.Nat. Genet.38:904–9
79. Prokopenko I, Langenberg C, Florez JC, Saxena R, Soranzo N, et al. 2009. Variants in the melatonin receptor 1B gene (MTNR1B) influence fasting glucose levels and risk of type 2 diabetes.Nat. Genet. 41:77–81
80. Purcell S, Neale B, Todd-Brown K, Thomas L, Ferreira MAR, et al. 2007. PLINK: a toolset for whole genome association and population-based linkage analyses.Am. J. Hum. Genet.81:559–75
Annu. Rev. Genom. Hum. Genet. 2009.10:387-406. Downloaded from www.annualreviews.org
81. Rafiq S, Melzer D, Weedon MN, Lango H, Saxena R, et al. 2008. Gene variants influencing measures of inflammation or predisposing to autoimmune and inflammatory diseases are not associated with the risk of type 2 diabetes.Diabetologia51:2205–13
82. Raychaudhuri S, Remmers EF, Lee AT, Hackett R, Guiducci C, et al. 2008. Common variants at CD40 and other loci confer risk of rheumatoid arthritis.Nat. Genet.40:1216–23
83. Rivera A, Fisher SA, Fritsche LG, Keilhauer CN, Lichtner P, et al. 2005. Hypothetical LOC387715 is a second major susceptibility gene for age-related macular degeneration, contributing independently of complement factor H to disease risk.Hum. Mol. Genet.14:3227–36
84. Sabatti C, Service SK, Hartikainen AL, Pouta A, Ripatti S, et al. 2009. Genome-wide association analysis of metabolic traits in a birth cohort from a founder population.Nat. Genet.41:35–46
85. Sachidanandam R, Weissman D, Schmidt SC, Kakol JM, Stein LD, et al. 2001. A map of human genome sequence variation containing 1.42 million single nucleotide polymorphisms.Nature409:928–33 86. Sanders AR, Duan J, Levinson DF, Shi J, He D, et al. 2008. No significant association of 14 candidate
genes with schizophrenia in a large European ancestry sample: implications for psychiatric genetics.Am. J. Psychiatry165:497–506
87. Sandhu MS, Waterworth DM, Debenham SL, Wheeler E, Papadakis K, et al. 2008. LDL-cholesterol concentrations: a genome-wide association study.Lancet371:483–91
88. Sanger F, Nicklen S, Coulson AR. 1977. DNA sequencing with chain-terminating inhibitors.Proc. Natl. Acad. Sci. USA74:5463–67
89. Sanna S, Jackson AU, Nagaraja R, Willer CJ, Chen WM, et al. 2008. Common variants in the GDF5 region are associated with variation in human height.Nat. Genet.40:198–203
90. Saxena R, Voight BF, Lyssenko V, Burtt NP, de Bakker PI, et al. 2007. Genome-wide association analysis identifies loci for type 2 diabetes and triglyceride levels.Science316:1331–36
91. Schaid DJ, Rowland CM, Tines DE, Jacobson RM, Poland GA. 2002. Score tests for association between traits and haplotypes when linkage phase is ambiguous.Am. J. Hum. Genet.70:425–34
92. Scheet P, Stephens M. 2006. A fast and flexible statistical model for large-scale population genotype data: applications to inferring missing genotypes and haplotypic phase.Am. J. Hum. Genet.78:629–44 93. Scott LJ, Mohlke KL, Bonnycastle LL, Willer CJ, Li Y, et al. 2007. A genome-wide association study
of type 2 diabetes in Finns detects multiple susceptibility variants.Science316:1341–45
94. Scuteri A, Sanna S, Chen W-M, Uda M, Albai G, et al. 2007. Genome wide association scan shows genetic variants in the FTO gene are associated with obesity related traits.PLoS Genet.3:e115 95. Servin B, Stephens M. 2007. Imputation-based analysis of association studies: candidate regions and
quantitative traits.PLoS Genet.3:e114
96. Sobel E, Lange K. 1996. Descent graphs in pedigree analysis: applications to haplotyping, location scores, and marker-sharing statistics.Am. J. Hum. Genet.58:1323–37
97. Stephens JC, Schneider JA, Tanguay DA, Choi J, Acharya T, et al. 2001. Haplotype variation and linkage disequilibrium in 313 human genes.Science293:489–93
98. Stephens M, Scheet P. 2005. Accounting for decay of linkage disequilibrium in haplotype inference and missing-data imputation.Am. J. Hum. Genet.76:449–62
99. Stephens M, Smith NJ, Donnelly P. 2001. A new statistical method for haplotype reconstruction from population data.Am. J. Hum. Genet.68:978–89
100. Tenesa A, Farrington SM, Prendergast JG, Porteous ME, Walker M, et al. 2008. Genome-wide associ-ation scan identifies a colorectal cancer susceptibility locus on 11q23 and replicates risk loci at 8q24 and 18q21.Nat. Genet.40:631–37
101. Terracciano A, Sanna S, Uda M, Deiana B, Usala G, et al. 2008. Genome-wide association scan for five major dimensions of personality.Mol. PsychiatryIn press
102. The International HapMap Consortium. 2003. The International HapMap Project.Nature426:789–96 103. The International HapMap Consortium. 2005. The International HapMap Project.Nature437:1299–
320
104. The International HapMap Consortium. 2007. A second generation human haplotype map of over 3.1 million SNPs.Nature449:851–61
105. The Wellcome Trust Case Control Consortium. 2007. Genome-wide association study of 14000 cases of seven common diseases and 3000 shared controls.Nature447:661–78
Annu. Rev. Genom. Hum. Genet. 2009.10:387-406. Downloaded from www.annualreviews.org
106. Uda M, Galanello R, Sanna S, Lettre G, Sankaran VG, et al. 2008. Genome-wide association study shows BCL11A associated with persistent fetal hemoglobin and amelioration of the phenotype of beta-thalassemia.Proc. Natl. Acad. Sci. USA105:1620–25
107. Venter JC, Adams MD, Myers EW, Li PW, Mural RJ, et al. 2001. The sequence of the human genome. Science291:1304–51
108. Visscher PM, Duffy DL. 2006. The value of relatives with phenotypes but missing genotypes in associ-ation studies for quantitative traits.Genet. Epidemiol.30:30–36
109. Wang WY, Barratt BJ, Clayton DG, Todd JA. 2005. Genome-wide association studies: theoretical and practical concerns.Nat. Rev. Genet.6:109–18
110. Wheeler DA, Srinivasan M, Egholm M, Shen Y, Chen L, et al. 2008. The complete genome of an individual by massively parallel DNA sequencing.Nature452:872–76
111. Willer CJ, Sanna S, Jackson AU, Scuteri A, Bonnycastle LL, et al. 2008. Genome-wide association scans identify novel loci that influence lipid levels and risk of coronary artery disease.Nat. Genet.40:161–69 112. Willer CJ, Speliotes EK, Loos RJF, Li S, Lindgren CM, et al. 2009. Six new loci associated with body
mass index highlight a neuronal influence on body weight regulation.Nat. Genet.41:25–34
113. Yuan X, Waterworth D, Perry JR, Lim N, Song K, et al. 2008. Population-based genome-wide association studies reveal six loci influencing plasma levels of liver enzymes.Am. J. Hum. Genet.83:520–28 114. Zaitlen N, Kang HM, Eskin E, Halperin E. 2007. Leveraging the HapMap correlation structure in
association studies.Am. J. Hum. Genet.80:683–91
115. Zaykin DV, Westfall PH, Young SS, Karnoub MA, Wagner MJ, Ehm MG. 2002. Testing association of statistically inferred haplotypes with discrete and continuous traits in samples of unrelated individuals. Hum. Hered.53:79–91
116. Zeggini E, Scott LJ, Saxena R, Voight BF, Marchini JL, et al. 2008. Meta-analysis of genome-wide association data and large-scale replication identifies additional susceptibility loci for type 2 diabetes. Nat. Genet.40:638–45
117. Zeggini E, Weedon MN, Lindgren CM, Frayling TM, Elliott KS, et al. 2007. Replication of genome-wide association signals in UK samples reveals risk loci for type 2 diabetes.Science316:1336–41
Annu. Rev. Genom. Hum. Genet. 2009.10:387-406. Downloaded from www.annualreviews.org