DOWNTOWN
DYNAMICS
evaluating
©2015
Rachel C. P. Atkinson
iii
ACKNOWLEDGEMENTS
iv
E
valuatingD
owntownD
ynamicsTABLE OF CONTENTS
5 CHAPTER ONE: INTRODUCTION
7 CHAPTER TWO: SEEKING COMMON GROUND
IN “DOWNTOWN”
7 a. Clarifying the Terminology
8 b. Defining and Measuring Quality Downtowns 15 c. Defining Downtown Geographies
15 i. Local Boundary Definitions 15 ii. Radial Boundary Definitions
16 iii. Alternative Boundary Definitions
20 CHAPTER THREE: THE QUALITY OF
DOWNTOWN INDEX
20 a. The Case Against Tract Boundaries
22 b. Selecting the Indicators
34 CHAPTER FOUR: APPLYING THE QDI IN TWO
MID-SIZED SOUTHERN CITIES
34 a. Context
36 b. Determining Baselines 37 c. Determining Boundaries
39 d. Results
44 CHAPTER FIVE: CONCLUSION
46 APPENDIX A: DATA GUIDE
5
C
hapter1
INTRODUCTION
A
ccording to recent press, America is in the midst of an unprecendented
urban renaissance. Popular media has been reporting an increased
interest in urban living for much of the last decade (Karp 2008; Leinberger
2008; Rosales 2012). Surveys find that today’s twenty-and-thirty-somethings
(“millennials,” “generation y,” “the echo-boomers”) value mixed-use locations
where they can get around without a car (Fry 2013; Rockefeller Foundation
2014; Urban Land Institute 2013; American Planning Association 2014).
Employers are adapting to the desires of the new workforce; companies such
as Yahoo, Coca-Cola, Motorola and United Airlines have made recent moves to
downtown offices. The Wall Street Journal has gone so far as to pronounce an
“era of corporate urbanism” (Weber 2013; Vanderkam 2011).
Yet, despite this increased interest in urbanism, little effort has been made to quantitatively measure changes occurring in the nation’s most urban places:
downtowns. In fact, most of the discussion on downtown trends relies on housing preference surveys rather than observed population change. Because desires do not always align with actions, the applications of these findings are limited.
Cities are investing heavily in downtown revitalization to compete in the increasingly urban job and housing markets. Accurate data demonstrating the changes occurring downtown is crucial for local governments, developers and downtown organizations to
justify their expenditures and to assess the impact of their projects.
Current approaches to downtown
evaluation lack a structured methodology. Academics study downtown job densities and demographic changes, but their
methods do not accommodate idiosyncratic local boundaries and typically do not
6
E
valuatingD
owntownD
ynamicsto identify indicators that can be compared across cities as well as over time.
The goal of this thesis is to present an improved methodology for evaluating the overall quality of downtowns. The result is a set of Quality of Downtown Indicators that can be summarized by a comprehensive Quality of Downtown Index (QDI). This evaluation framework has three distinct advantages over current practice:
It is comprehensive
Real estate professionals, demographers, economists and urban planners have differing concerns regarding urban places and thus evaluate places with different criteria. The QDI includes performance indicators used in all of these fields,
organized by four key elements of a quality downtown: accessibility (urban form and transportation), economy (employment and real estate), community (downtown as a residential neighborhood) and identity (distinctiveness, culture and activity).
It provides unprecedented geographic precision
A major shortcoming of existing downtown research is its dependence upon data collected at the census tract level. Census tracts are defined based on residential population, so downtowns with few residents have very large tracts. These coarse units are often a poor fit for downtown geographies. The QDI was developed for fine geographic precision; its
indicators primarily use data available at point, parcel and block levels.
It is transparent
This paper explains each step in the development of the QDI; it justifies the underlying assumptions behind each indicator of the index. It presents the sources where data for each indicator can be found, including the limitations of each data source.
The next chapter presents a review of the literature that informed the assumptions and methodology of the QDI. Chapter 3 explains the key decisions that went into its development, including the geographic definition of downtown, the reasoning behind selected performance idnicators, and the process of constructing a composite index. Chapter 4 applies the methodology to two case cities in North Carolina and discusses how the results align with local perceptions of downtown change. The paper concludes by identifying areas for further research and potential improvements to the QDI and by describing potential applications for academics,
7
C
hapter2
SEEKING COMMON GROUND
IN “DOWNTOWN”
W
hat is downtown? Although the word is ubiquitous in the American
vernacular, there is little agreement on what downtown means. Cities
have unique names for their most urban areas; Locals disagree on where
boundaries lie. The literature reviewed in this chapter presents a variety of
perceptions of what downtown is and what it should be. The methodologies,
definitions and limitations found in these works informed key decisions
on what indicators to use and what geographies to study in the Quality of
Downtown Index. The first section of this chapter clarifies terminology used
to describe downtown. The second section surveys prior approaches to
downtown evaluation. The final section discusses literature on downtown’s
geographic definition and associated limitations on data availability.
A. CLARIFYING THE
TERMINOLOGY
There is an abundance of literature on the history, changing roles and renewed popularity of the American downtown. Since 2000, “Downtown” has appeared in the titles of over 4,000 academic
publications. One of few points of consensus in the literature is that the definition of downtown lacks clarity.
While some authors directly confront this issue by establishing their own working definitions, others acknowledge it implicitly by providing an alternative terminology— a downtown alias with its own slightly nuanced definition. Authors may add to the confusion by employing several names
for downtown in a single paper. Drawing connections among works using different terms can appear fallacious, drawing false equivalencies. This literature review begins with a clarification of terminology to avoid that outcome.
“City center” is the term most frequently used synonymously with downtown
8
E
valuatingD
owntownD
ynamicsdowntown and the central business district (Burayidi 2013, p.24).
The Central Business District (CBD) is another term that frequently appears in the literature. Historically, the American downtown was literally the central
business district of a city and the two terms were synonymous (Fogelson 2003, p. 12). However, as businesses decentralized in the latter half of the 20th century, the concept of a central business district became less relevant. Given the wide range of functions in contemporary downtowns, many authors draw a distinction between downtown and the CBD (Ford 2003, p.6; Levy & Gilchrist 2013; p. 8; Burayidi 2013, p. 21). When the CBD is discussed in recent literature, it is often in studies of job sprawl and office performance (Cortright 2006; Glaeser & Kahn 2002; Malizia 2014; Stoll 2005).
Many terms used to describe downtown locations also have broader applications. “Urban center” and “urban core” appear in several texts discussing downtowns, though their context makes it unclear at times whether the terms are meant to be directly equivalent to downtown, or if they refer to a larger area (Levy & Gilchrist 2013, p.10; Faulk 2006; Wachs 2013). Authors also describe downtowns as urban cores, vibrant centers, mixed-use centers and employment nodes, but also apply these terms to suburban developments, institutional campuses and/ or neighborhood areas. These terms will not be assumed to describe downtown
without a careful interpretation of the original context.
This paper will use the following definition for downtown: an area with current
or historic significance as a center of economic activity and a comparatively urban character. It is more intensively developed than the rest of the region, but may or may not contain high densities of jobs or residents. It has sidewalks and storefronts but may or may not have active street life or high concentration of retail. This definition allows downtown to include historically active urban districts that are presently underutilized and acknowledges that downtowns are determined by local perceptions rather than standard criteria. This terminology will be used consistently except when quoting another author or discussing an idiosyncratically named downtown (e.g. Chicago’s Loop, Midtown Manhattan, Charlotte’s Uptown).
B. DEFINING AND
MEASURING
QUALITY
DOWNTOWNS
9
C
hapter2
their reports were extremely easy to find online, suggesting wide distribution to the public.
In addition to criteria from the BID reports, this section will introduce the criteria used in two downtown scoring systems designed for public consumption: the annual ranking of “Best Downtowns” by Livability.com and the one-time ranking by Forbes. The evaluations surveyed share several general categories of criteria:
1. Accessibility
urban form and transportation
2. Economy
employment and real estate
3. Community
downtown as a residential neighborhood
4. Identity
distinctiveness, culture and activity
The remainder of this section is organized within these four categories. I introduce each category’s most common evaluation criteria and provide examples of how they have been used. When possible, I connect the criteria to broader theories of urbanism. Some criteria, such as walkability, have been the focus of a great deal of research. For those, I also discuss evaluation methods used in research outside the downtown context.
The purpose of this section is not to
determine the best indicators for downtown evaluation but rather to examine which qualities have been considered worthy of evaluation in the past. For that reason, I withhold most commentary on the
usefulness of any indicator until Chapter 4 where I discuss the selection process for my own indicators.
I. ACCESSIBILITY
Today’s dominant urban planning trends promote compact, walkable, mixed-use environments. New Urbanism, Walkable Urbanism, Pedestrian Oriented Development and Transit Oriented Development take slightly varied
approaches to reach the same end; they all aim to create places where a resident’s daily activities are readily accessible without the use of a car (Leccese & McCormick 2000; Leinberger 2007, p. 117; Schmitz & Scully 2006, p.16; Cervero et al 2002, p. 2). This goal heavily depends on a place’s physical design. Because many American downtowns were developed prior to automobile prevalence, they are often walkable by default, one reason for the resurgent interest in urban living.
10
E
valuatingD
owntownD
ynamicsbe walkable, compact, diverse and multi-modal.
Downtown should be walkable
Of all criteria for downtown accessibility, walkability deserves the most attention. Walkability is an absolutely critical element of urbanity. As Jeff Speck notes, the pedestrian is “the canary in the coal mine of urban livability” (2012, p.10). Street activity is the most obvious sign of urban vitality and a downtown will not be seen as thriving if its sidewalks are empty.
Urban planners, environmentalists, public health experts, gerontologists and economic developers all recognize the importance of walkability. Residents of walkable places have smaller carbon footprints and lower obesity rates than residents of traditional suburbs (Alberts 2014; Frank et al. 2004). Walkable places allow aging residents to remain independent even after they are unable to drive a car. There is evidence that customers who travel by non-motorized means spend more per month at local businesses than those that drive (Kelly et al. 2013).
Many downtown BIDs reference walkability in their annual reporting, citing it as a key element of their downtown’s attractiveness. Philadelphia’s Center City Partners and the Downtown Seattle Association both report the share of downtown employees who walk to work, as well as the Walk Score of downtown neighborhoods (Walk Score will be discussed in greater detail below). Downtown Seattle Association and Downtown Raleigh Alliance also record pedestrian traffic at key intersections. Cincinnati references downtown
walkability, but does not provide metrics for assessment. Austin only provides general descriptions of mobility and infrastructure initiatives, with no measures of walkability.
Walkability has been a criterion in
Livability.com’s “Best Downtown” rankings for two of the four years it has been
released. In 2011, the rankings cited walkability as a criterion without giving methods for determining it. In its 2015 rankings, the website measures walkability using Walk Scores.
In broader literature, researchers have explored many methods to assess walkability, most of which evaluate proximity between trip origins and destinations or factors that affect the quality and directness of routes to destinations (Frank 2000). Proximity measures include density, diversity of land uses, and as-the-crow-flies distances to destinations. Connectivity measures include “micromeasures” like intersection density, street connectivity, and the presence of sidewalks (Frank 2000; Saelens et al. 2003). These physical measures of connectivity have indeed been found to correlate with walking behavior (Frank et al 2005). But, as Reid Ewing and Susan Handy observe, they fail to capture a pedestrian’s perception of walkability (2009).
11
C
hapter2
historic buildings, presence of outdoor dining, proportion street wall1 and
proportion of first floor with windows.
Ewing and Handy’s approach begins to account for another key factor of walkability: pedestrian motivation. Walk Score, a popular online scoring system, measures a location’s walkability by its proximity to particular amenities like groceries, dining, retail, schools, parks and entertainment opportunities. In its first iteration, the system measured proximity as-the-crow-flies, but since 2013, Walk Score has been integrating street networks into its algorithm, allowing it to measure not just proximity but also connectivity (Hirsch et al. 2013; Lerner 2014). Walk Score’s validity has been tested against other
common indicators of walkability, proving significant correlations with variables such as destination density, pedestrian route directness, intersection density and speed limit (Duncan et al. 2011). Although Walk Score’s applications may be limited by its presentation as a composite measure, that fact may actually contribute to the tool’s validity; a recent study has found that composite measures better indicate
1. The authors use this term to describe the proportion of the street lined with buildings: “The buildings become the ‘walls’ of the outdoor room, the street and sidewalks become the ‘floor’, and if the buildings are roughly equal height, the sky projects as an invisible ceiling. Buildings lined up that way are often referred to as ‘street walls’”
walkability than individual variables (Vargo et al. 2011).
Downtown should be compact and diverse
Compact, mixed land uses are characteristic of all the world’s most urban places. A mixed-use environment brings together a diverse range of activities. Downtowns depend this diversity to keep the area active at all hours of the day. Though the two traits are very different, they are deeply related. Density allows a greater number properties, which in turn allow opportunities for a broader range of uses.
Though none of the BID reports surveyed track these characteristics, academics have developed operational measures. Researchers assess land use diversity using statistical models of entropy and dissimilarity (Cervero 1997). Entropy measures how equally land uses are distributed across some specified area, while dissimilarity measures the likelihood that any given parcel will have a different land use than its neighboring parcel (Brown 2009; Cervero 1997).
In an urban environment compactness and density refer to the intensity of
12
E
valuatingD
owntownD
ynamicsdefined as generally having an FAR greater than 1.0 (Leinberger 2005).
Downtown should be multimodal
Despite the many benefits of walkability, few would argue it should be a singular transportation goal for urban places. Even the most prominent walkability evangelists admit, “walkable cities rely on [transit] utterly” (Speck 2012, p.71).
Seattle and Philadelphia present their multimodality through statistics on the means of transportation to work for
downtown employees. The downtown BIDs of Seattle, Raleigh and Philadelphia report downtown transit ridership, though Raleigh only reports ridership for its downtown circulator route. Philadelphia also reports Transit Score and Bike Score, both from the creators of Walk Score. The Transit Score algorithm considers distance to the nearest stop, the frequency of routes serving the stop and the mode of transit (Walk Score, “Transit Score Methodology”). Bike Score essentially adds the presence of bike lanes, topology and bike commuting mode share to the Walk Score algorithm (Walk Score, “Bike Score Methodology”).
Though the costs and benefits of parking are a contentious topic, the number of parking spaces downtown does indicate accessibility by one mode of a multimodal system. Raleigh, Cincinnati and Seattle report the number of parking spaces
downtown, but only Raleigh’s BID presents abundant parking as an amenity.
II. ECONOMY
With its origins as the primary hub of local business activity, downtowns have always held major economic significance. Although major industries vary from city to city, an obvious and fundamental indicator of downtown’s economic health is its density of jobs. All of the surveyed BID reports provided downtown employment statistics as a key indicator of economic growth (or decline – Philadelphia’s Center City Partners went out of their way to illustrate how their downtown has fewer jobs than it did forty years ago). Most reports also profiled major downtown employers.
In addition to job counts, property and tax information create a more complete picture of how a downtown location is valued. Office property performance demonstrates how highly employers value a downtown location. All five BID reports include downtown office rents and occupancy rates, as well as an indicator of property investment – either as a monetary amount or as newly constructed square footage. Raleigh and Austin’s downtown BIDs also compare downtown’s taxable value per acre to the rest of the city or county.
For a downtown Business Improvement District, economic indicators have
obvious significance. Downtown rankings in popular media place somewhat less emphasis on downtown’s economic standing; Forbes’ ranking considered no economic variables, while
13
C
hapter2
were considered; in 2012 they vaguely assessed “economic growth” as a separate variable from vacancy and unemployment rates; in 2014 they considered income growth and vacancy rates; and in 2015 they only considered vacancy.
Literature on downtown revitalization supports the use of employment and property data to evaluate downtown’s economic health. Dagney Faulk suggests that downtown revitalization should be measured by growth in jobs, businesses and housing (2006, p.230). Michael
Burayidi’s evaluation framework includes employment, business count, change in tax base, real property investment and office space occupancy (2001, p.60).
A more refined approach to urban
economics has taken the spotlight in recent years. Rather than focusing on universal job growth, people-focused theories like those of Richard Florida and Ed Glaeser define a city’s success by the types of workers it attracts. According to Glaeser, a city’s strength lies in its human capital, defined as “its education and level of entrepreneurship” (Glaeser 2014, p.12).
Florida refines this human capital theory to focus on the “scientists, techies, professionals, artists and media types” whom he has dubbed the “creative class” (2014a). He argues that attracting the creative class is key to economic growth. Florida assesses cities’ attractiveness to creative people by measuring the city’s creative class share of the workforce, its Tech Pole Index (an indicator of high-tech industry developed by the Milken Institute), its patents per capita and a Gay Index to estimate openness, diversity and tolerance
(2002). Indeed, cities deemed more creative by Florida’s criteria have demonstrated more growth in total jobs and total wages than less creative cities (Florida 2014b, p.200).
III. COMMUNITY
The human capital and creative capital economic theories described above have major limitations – they tend to undervalue the working class without which a city could not operate – however they do illustrate how a place’s success can be influenced by its demographics. A successful downtown’s many retail and dining
establishments require a substantial lower-wage workforce.
In an equitable downtown, these workers should be represented not only in the workforce but also in the residential community. With Americans’ growing interest in urban living, downtowns must be evaluated as not only places to work and play, but also as residential communities.
All the surveyed BID reports provided some discussion of their cities’ growing downtown residential populations. Beyond that basic statistic, the demographic reporting varied widely across the cities. Austin and Philadelphia include figures on downtown rent and/or home prices. Seattle and Philadelphia report information on where downtown workers live, including the population that lives and works downtown.
14
E
valuatingD
owntownD
ynamicspopulation by age and income. Seattle reports household type and educational attainment.
Diversity has been a goal of urban planners for decades, but the methods by which it is measured vary widely. Diversity can be measured within many categories (race, age, income, household type, education), but there has been little if any effort to establish which type of diversity is most desirable. Common indicators of diversity include racial/ethnic diversity, employment by industry sector and income distribution (Breen & Rigby 2004; Burayidi 2001;
Cortright 2006).
IV. IDENTITY
In describing vibrant, successful urban places, many authors describe some quality far less tangible and more subjective than any matter of urban form or demographics. It has been called “hipness” (Breen & Rigby 2004), “sense of place” (Ewing & Clemente 2013; American Institute of Architects 2005) and “authenticity” (Brown & Dixon 2014). These qualities, while difficult to operationalize and evaluate, demonstrate the need for indicators of downtown’s culture, history and all the activities that contribute to a unique identity.
In BID reports, these indicators include convention attendance (Philadelphia, Seattle), arts organizations (Seattle), visitor counts at downtown attractions (Philadelphia, Raleigh, Seattle) and number of outdoor festivals (Raleigh). Storefronts, historic buildings and outdoor dining all contribute to perceptions of imageability, “the quality of a place that makes it distinct, recognizable and memorable” (Ewing &
Handy 2009). Raleigh and Philadelphia report their numbers of outdoor dining options and Seattle reports the types of ground level businesses downtown.
In the literature, authors have assessed these qualities by counting convention facilities, historic districts, festival attendees, destinations and major
attractions (Ford 2003; Faulk 2006; Malizia 2013). At the regional scale, researchers at the Urban Institute have developed a set of indicators for cultural vitality including “arts establishments per thousand population,” “percentage of employment in nonprofit and commercial arts establishments as a proportion of all employment,” “nonprofit arts organizations per thousand population,” and “nonprofit community celebrations, festivals, fairs and parades per thousand population” (Jackson 2006, p. 39).
15
C
hapter2
for the development of indicators presented later in this paper.
C. DEFINING
DOWNTOWN
GEOGRAPHIES
Geographically defining downtown is a difficult task. There are no standards for downtown boundaries and no requirements for cities to delineate them. Zoning maps, comprehensive plans and transportation documents all come straight from city hall but frequently present conflicting downtown boundaries. Downtown Business Improvement Districts (BIDs) and local visitor centers may also distribute maps that contribute to the boundary confusion. These boundaries not only vary widely but are often irregular and do not align with more ubiquitous geographic units like zip codes or census tracts (Birch 2002; Burayidi 2001; Burayidi 2013; Levy & Gilchrist 2013).
Nearly all downtown research relies on boundaries built from an aggregation of census tracts, but researchers employ a variety of methods to determine which tracts to consider. In this section, I discuss the various approaches found in the literature.
I. LOCAL BOUNDARY
DEFINITIONS
Because of the variations of local boundaries described above, few
researchers have attempted to use local downtown definitions. In her work on demographic trends in American downtowns, Eugenie Birch defines each downtown with a collection of census tracts
that best approximates locally accepted boundaries, as determined by conversations with local officials (2002, 2005, 2009). Birch built these boundaries from 1970 tracts so that they could be compared over time. She acknowledges that this approach is better suited for longitudinal studies than cross-sectional, as local definitions reduce comparability across cities.
Michael Burayidi does not share Birch’s concerns with using local boundaries for cross-sectional research. He defines the geographies of fourteen “resilient downtowns” using local definitions but builds some of these boundaries from a collection of both census tracts and block groups and does not provide a thorough explanation of his methods or reasoning (2014).
II. RADIAL BOUNDARY
DEFINITIONS
Authors frequently cite a need for nationally standardized downtown geographies
(Levy & Gilchrist 2013; Ford 2003). Since the discontinuation of the Census Bureau’s Central Business District program in 1982, there have been no nationally delineated geographies equivalent to downtowns (US Bureau of the Census 1994, p. G-11). As established in the terminology section above, the CBD is not an adequate
16
E
valuatingD
owntownD
ynamicsreport that used a three-mile radius around the CBD to determine the existence of a “well-defined employment center” (Glaeser & Kahn 2001, p. 2).
Although the Census CBD boundaries are out of date, this method still has validity
in some contexts, such as measuring job sprawl by the distance to the centroid of the CBD (Stoll 2005). However, some researchers have used these antiquated CBD rings as approximations of downtown, a context in which their validity is more questionable. When only a few square miles are being studied, the misplacement of a centroid has much more significance. The former CBD centroid may have little relevance to today’s diverse downtown activities and if the centroid happens to sit near a waterfront, a large area of downtown may be underwater
(as is the case in New York City, shown in Figure 1).
Reports from CEOs for Cities frequently use three-mile radii around the 1982 CBD, most recently to define “close-in neighborhoods” or the “urban core” (Cortright 2014, p. 2).
The Census Bureau recently attempted to assess the demographic changes in downtowns, also using radial boundary definitions (Wilson 2012). A report on
“Patterns of Metropolitan and Micropolitan Change” defined downtown using census tracts with centroids within two miles of city hall (p. 26). Critics of this report aptly note that “Not all city halls are at the geographic center of their downtowns nor, generally, does a circle capture the idiosyncratic shapes of urban commercial areas” (Levy & Gilchrist; 2013, p. 12). These radial downtown boundaries are attractive for large, cross-sectional studies because they are simple to compute and easy to compare. However, not addressing local idiosyncrasies results in findings with little relevance for many downtowns.
III. ALTERNATIVE BOUNDARY
DEFINITIONS
A 2013 report from Philadelphia’s Central City Partners and the International Downtown Association introduced an alternative methodology for defining downtown boundaries (Levy & Gilchrist 2013). Levy and Gilchrist utilize Local Employment Dynamics (LED) data to
3 MI LES
2 MI
L ES
1MI
LE
17
C
hapter2
determine boundaries for the commercial downtowns of 150 U.S. cities and places.
LED data is one of the Census Bureau’s newest and most geographically precise data products. It provides data on the employed population based on the census block where they work and the census block where they reside.
The Census’s OnTheMap tool visualizes LED data with a density heatmaps; areas with the most jobs or residents per block are generalized and displayed in darker colors. Levy and Gilchrist establish boundaries of 231 job nodes based on “visual job-density levels” shown in OnTheMap (p. 13, p. 54 2013). They then define downtown using the census tracts represented in these employment nodes.
Levy and Gilchrist present this methodology as a means to “map downtown commercial areas and institutional districts, however irregular in shape,” yet by simplifying the LED-defined job nodes to census tracts, they eliminate this advantage (p. 14 2013).
Their methodology is also not nearly as standardized and replicable as they imply; rather than determining employment nodes by some standard minimum job density (i.e. tracts where job densities are in the 75th percentile for the MSA), they determine the nodes visually based on the color gradations shown in the OnTheMap viewer. This makes their downtown
designation difficult to replicate, especially in cities with decentralized employment patterns. A downtown where job densities are no higher than surrounding areas would be overlooked with OnTheMap’s default job-density classifications. Figure 2 demonstrates the the minimal contrast
in how job densities are displayed across a large area of Phoenix, AZ.
While defining downtowns by job density patterns could help ensure that similar areas are being compared across cities, this approach relies on an outdated assumption that downtown must be a job center. Defining boundaries by current job densities would discount the significance of primarily residential or entertainment-oriented downtowns.2 This approach
would also completely ignore historical downtowns that have not begun to recover from major declines.
Though several approaches have been taken in determining downtown geographies, no major studies have defined downtown without generalizing the boundaries using
2 This is not to suggest that a residential or
entertainment-oriented downtown would not provide jobs, merely that their job densities would likely be low in comparison with traditional office-oriented employment centers.
5 miles Jobs per Sq. Mile
5 - 3,140 3,141 - 12,547 12,548 - 28,225 28,226 - 50,173 50,174 - 78,394
18
E
valuatingD
owntownD
ynamics20
E
valuatingD
owntownD
ynamicsTHE
QUALITY OF DOWNTOWN
INDEX
S
ome might suggest that downtown’s greatness can’t be measured— that
it’s one of those “know it when you see it” things. This paper attempts
to prove otherwise, quanitifying the characteristics essential to a successful
downtown. After considering the approaches discussed in the previous
chapter, I construct a comprehensive “Quality of Downtown Index” that
includes characteristics essential to all of downtown’s primary activities.
In this chapter, I describe the rationale behind the key decisions in the development of the Quality of Downtown Index (QDI). First, I critique the status quo for downtown research: the use of census tract-based downtown boundaries. The remainder of this chapter explains the process used to select indicators of downtown quality, following the categorization used in the literature review: indicators of downtown accessibility, economy, society and identity.
A. THE CASE AGAINST
TRACT BOUNDARIES
Because the geographic definition of downtown would determine the data availability for all indicators, I had to determine what geographic units would be studied from the outset. After giving consideration to all of the approaches found in the literature, I chose to base the QDI
on locally-defined downtown boundaries. Radial definitions are only appropriate for measures of sprawl and centralization. Attempts to standardize downtown geographies post-facto fail to incorporate the diverse activities of the contemporary downtown. For researchers comparing a broad sample of downtowns, these generalizations may be acceptable, but for an indicator to be useful to locals, it must be tracked with local definitions.
21
C
hapter3
designed to hold somewhere between 1,200 and 8,000 people, with an ideal population of 4,000 (US Census Bureau 2010 Geographic Terms). This means they vary greatly in geographic size and are much smaller in dense areas.
In large, densely populated downtowns, census tracts are very small. For example, Chicago’s four square mile “Central Area” (a downtown definition extending slightly beyond the Loop’s historic business district) contains 18 tracts with an average area of 0.28 square miles (Figure 3)
Philadelphia’s downtown, a three square mile area called the Center City, contains 22 tracts with an average size of 0.13
square miles. These small geographic units allow reasonable approximations of local downtown boundaries (Figure 3, Figure 4).
Downtowns that do not have a major
residential population contain fewer census tracts with each tract covering a larger geographic area. Downtown boundaries built from these coarse geographic units may have little in common with local boundaries and can result in gross misrepresentations of downtown’s contents. As Larry Ford notes in his comparative assessment of downtowns, “Boundaries and definitions are extremely important since the inclusion or exclusion of a few blocks can make for significant differences in, for example, employment or recreational opportunities or population” (Ford 2003, p. 7).
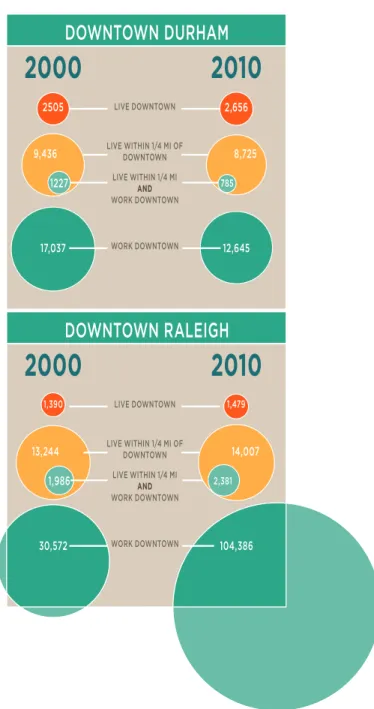
This is well illustrated by the downtowns of Durham and Raleigh, North Carolina. Both cities have small downtowns that are rapidly gaining residents, jobs and
FIGURE 3. CENSUS TRACTS AND LOCAL DOWNTOWN BOUNDARY IN CHICAGO, IL
1 Mile
Census Tract with centroid inside downtown boundary
Local boundary from City of Chicago 2003 Local downtown boundary
CHICAGO
1 Mile
Census Tract with centroid inside downtown boundary
Local boundary from Center City District 2007 Local downtown boundary
PHILADELPHIA
22
E
valuatingD
owntownD
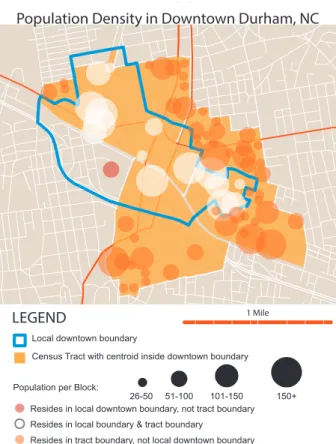
ynamicsamenities. The local definition of downtown Durham is a 0.89 square mile district.
Figure 5 shows the three census tracts whose centroids are within Durham’s local downtown boundary (the origins of this local boundary are discussed in Chapter 4). These tracts cover an area more than twice that of the local definition and hold a residential population more than twice as large.
On the other hand, only one census tract has its centroid in Raleigh’s 1.47 square mile downtown. An approximation of downtown using this tract would result in an area roughly half the size of the local definition, missing more than half of the actual downtown residential population.
These small, rapidly changing downtowns are those most in need of clear indicators of progress and precise measures of change. Tract-based downtowns may provide information good enough for a large cross-sectional study, but the information is not precise enough for the assessment of a specific downtown. The methods presented in this paper are original in their independence from census tract geographies. The data sources used here are available at point, parcel and block level allowing the collection of objective, quantitative data for downtowns of many shapes and sizes.
Perhaps a reason previous studies have not used this level of geographic precision is lack of awareness of sources for data at this scale. Some of the sources providing this level of detail are relatively new and although others have been in existence longer, trends in “open data” have made resources increasingly accessible (www.
Data.gov). Appendix A provides a detailed guide to the data sources considered when selecting this paper’s indicators.
B. SELECTING THE
INDICATORS
I identified preliminary indicators based on their ability to demonstrate one of the characteristics of successful urban places discussed in the literature: accessibility, economy, community, or identity. Many were pulled directly from the literature, where they may or may not have been applied in a downtown geographic context.
Census Tract with centroid inside downtown boundary Local downtown boundary
Population per Block:
26-50 51-100 101-150 150+ Resides in local downtown boundary, not tract boundary Resides in local boundary & tract boundary Resides in tract boundary, not local downtown boundary
1 Mile Population Density in Downtown Durham, NC
LEGEND
23
C
hapter3
The potential viability of each indicator was rated on the following criteria:
1. Reliability of data and face validity of variable
Data provided by a trustworthy source and the variable
measured must have a
demonstrated relationship to the characteristics of a quality downtown
2. Geographic scale of data
Data availability at a fine-grained geography, such as point (address or geographic coordinates), parcel, or block
3. Geographic range:
Data available for many cities, preferably through the same database. When local data sources are used in comparative analysis, they must be sufficiently comparable across municipalities
4. Temporal scope:
Data distributed regularly, availability of historic data and potential for the variable to show change (because the QDI is intended to be useful in demonstrating revitalization and
or decline, its indicators must have the potential for change over time)
5. Ease of Access:
Cost of data, restrictions on user access and existence of national databases
A complete list of indicators that were considered can be found in Appendix B along with their data sources and ratings for the above criteria.
Two criteria were often at odds: data with a broad geographic range frequently had a limited temporal scope, while the variables with the most abundant historical data often come from unique local sources. For example, online platforms like Open Street Map (OSM), Google Maps and WalkScore provide useful information on the distribution of amenities nationwide, but many of these sources do not archive data or do not make historic data easily accessible. Meanwhile, cadastral parcel data provides a wealth of information on property values and land uses often going back over a decade, but this data is often only accessible through the departmental webpages of local governments.
24
E
valuatingD
owntownD
ynamicscrucial for longitudinal studies, assessing the changes in quality of individual downtowns over time.
Discovering this limitation led to the decision to base the Quality of Downtown Index on only a core set of indicators accessible through national databases. Some of the quality of downtown indicators can be tracked over time, and supplementary indicators reported by local sources could help fill in gaps in historical analyses. The composite QDI cannot demonstrate progress from a historic baseline (though it can demonstrate progress each year after initial implementation), but it is easily collected and readily comparable for the downtowns of many cities.
The Quality of Downtown Index consists of four sub-indexes: the Downtown
Accessibility Index, the Downtown Economy Index, the Downtown Society Index and the Downtown Identity Index. The remainder of this chapter will present the indicators for each sub-index.
I. INDICATORS OF
DOWNTOWN
ACCESSIBILITY
The review of literature in the first chapter found consensus on the key characteristics of accessibility: compact/ dense development, a diversity of land uses, a variety of destinations and accessibility by a variety of modes of transportation – especially by foot. Over a dozen variables were considered as potential indicators of downtown accessibility (details on all variables considered can be found in Appendix B. A guide to data sources can be
found in Appendix A). Given the quality and availability of data, the Accessibility Index is based on the following core indicators:
1. Density: Average Floor-Area-Ratio
Measured with: Square footage of commercial properties
Recommended data source: CoStar
Floor-Area-Ratio (FAR) refers to the ratio of a building’s gross leasable area (GLA) to the size of the lot on which the building sits. Of the three measures of density introduced in Chapter 2, FAR requires the most difficult data inputs. Population density and job density have important implications for downtown’s social and economic conditions, but because the contemporary downtown is not made up solely of office buildings or solely of homes, neither metric provides an adequate picture of the density of downtown’s development.
Minimum and maximum FARs are
commonly included in zoning regulations. This indicator measures the average FAR for downtown commercial properties, using data collected from the CoStar property analytics.
2. Mixed Use
Measured with: Squre footage of commercial properties
Diversity of Uses by Building Area Recommended data source: CoStar
This indicator measures the mix of uses present in downtown commercial properties. I calculate the diversity of downtown’s square footage among office, retail, warehouse and multifamily residential uses using an entropy equation.3
25
C
hapter3
The selection of property types included in CoStar data limit the usefulness of this indicator. CoStar does not include non-commercial properties such as government-services or single-family residences. When parcel data is accessible, it is recommended that it be used to better demonstrate
downtown’s mix of uses.
3. Transit Accessibility
Percentage of downtown workers living in walking distance of transit Recommended data source: Google Transit Feeds and OnTheMap
A common measure of transit accessibility builds quarter-mile buffers around transit stops to determine the area is transit-served. However, this indicator says little about the usefulness of the transit: do buses arrive frequently enough? Do buses go where travelers need to go?
Data availability limits the feasibility of indicators of transit utility. Though transit riders have easy access to route information through online maps, mobile applications and agency websites, it is still fairly difficult for researchers to access this data. Most transit agencies use the standard data format required by Google maps and Google Transit Feed Specifications (GTFS), but this data format is based on many related tables and requires a long sequence of operations
uses) + (SF office / SF all uses) ln (SF office / SF all uses) + (SF residential / SF all uses) ln (SF residential / SF all uses)] / ln (n3); where n3 = 0 through 3 depending on the number of different land uses present
to extract data on route frequencies for typical weekday routes.
It is, however, quite simple to extract the geographic locations of transit stops from GTFS data. In an effort to better represent not only the presence of transit, but it’s utility, I measure the percentage of downtown workers who live within walking distance of transit.4 This measure
demonstrates the coverage of transit and how well the region is connected to downtown.
I calculated this by first mapping bus stops with GIS software. I then created simple quarter mile buffers around these stops and considered the resulting area to be within walking distance of transit.5 I then
imported this GIS layer into the Census’s OnTheMap tool, alongside the downtown boundary layer. I used OnTheMap’s paired analysis tool to find the number of people who live in the transit-served area and also work within the downtown boundary.
4. Supplemental indicators of Accessibility
Of all of the QDI’s core indicators, those of accessibility are the weakest. It is difficult to access comparable data on the built environment across many cities. Most of the data on the built environment is collected locally so supplemental indicators based on
4 To the best of my knowledge, this measure has not been used in any prior research, Prior to the release of LEHD data the relationship between home geographies and workplace geographies could not be evaluated on a fine geographic scale. I believe this indicator has strong potential as an easily calculated measure of transit accessibility. Future research could test the validity of this measure against other measures of transit accessibility.
26
E
valuatingD
owntownD
ynamicslocal data provide a better representation of downtown accessibility. The following supplemental indicators are recommended:
When local cadastral parcel datasets include building area, that data should be used to calculate FAR. It can cover a greater portion of downtown, including
non-commercial properties.
Most parcel data reports some categories of land use, though the classifications and specificity vary by municipality. Calculating land use diversity with this data includes non-commercial properties.
When GTFS data is available for a transit system, additional measures of transit accessibility should be calculated, including the total number of routes servicing
downtown and the frequency of stops made downtown.
II. INDICATORS OF
DOWNTOWN ECONOMY
Traditional indicators of urban economics are much more easily collected than those of accessibility. Reliable data sources provide office property performance and job densities at downtown geographies.
1. Office Rents Compared to County
Recommended data source: CoStar
Office rents demonstrate how highly businesses value a downtown location. Comparing downtown rents to regional rents shows the relative advantage that businesses are willing to pay for. This indicator calculates the average downtown office rent per square foot, divided by the
average office rent per square foot for the metropolitan statistical area.
2. Office Occupancy Compared to County
Recommended data source: CoStar
While some downtowns might take pride in low office rents as a sign of affordability (Raleigh State of Downtown 2014), vacancy rates are more difficult to give a positive spin, making them a straightforward indicator of the downtown office market. This indicator calculates the average downtown occupancy rate, divided by the average vacancy rate for the metropolitan statistical area.
3. Job Density
Recommended data source: LEHD (OnTheMap)
Job growth over time is easily extracted from the Census Bureau’s LEHD data. These figures are reported for most of the nation from 2002 onward,6 and demonstrate
downtown’s strength as an employment center.
4. Supplementary Indicators
Most of the indicators used in urban economics research are available without using local data sources. Property values and tax assessments are the exception; this information is available at the parcel level only though local datasets. Taxable value per acre downtown compared to the county average is recommended as a supplemenrary indicator to show the
27
C
hapter3
relative economic importance of downtown properties.
III. INDICATORS OF
DOWNTOWN COMMUNITY
Indicators of the quality of downtown’s residential community measure not only who is living downtown but also how well downtown serves their needs.
1. Population Density
Recommended data source: Census (Decennial & ACS), Esri
Because downtowns are not Census geographies, their populations are most accurately measured by summing the populations of downtown blocks. Although population is only released on the block level every ten years, downtown population can be estimated between these years using weighted block apportionment. This method uses the block populations from decennial years as weights to distribute the population of the blocks groups or tracts that intersect the downtown boundary. Esri’s Business Analyst Online automatically calculates population for custom
geographies using this method.
2. Diversity of Household Types
Recommended data source: Census (Decenniel & ACS)
As discussed in Chapter 2, there is no consensus over what type of diversity is desirable in a downtown population. Given the concern over whether millennials will still be attracted to urban life once they start families, it is important to evaluate what types of households live downtown. This indicator measures the diversity of downtown’s family, non-family and single
households with a model multigroup entropy index previous used by the Census Bureau (Iceland 2004).7
3. Live-Work Dynamic: Share of Nearby Residents Who Work Downtown
Recommended data source: LODES, accessed through OnTheMap
This indicator measures the share of the employed residents living within a quarter mile of downtown who also work downtown. It assumes that people who live within walking-distance of downtown are more likely to spend a significant portion of their time in downtown using its amenities, supporting its retailers and populating its sidewalks and public spaces.
Many factors of downtown’s success depend on consistent daily foot traffic, including retail viability, public perception of safety (the oft-cited “eyes on the street” of Jane Jacobs) and the success of public spaces (Speck 2012). A quarter-mile buffer was chosen to define the residential area based
7 “A unit within the metropolitan area, such as a census tract, would analogously have its entropy score, or diversity, defined as:
28
E
valuatingD
owntownD
ynamicson the concept of a five-minute walkshed (Crankshaw, p.92).
4. Resident-Serving Businesses per Block
Recommended data source: Esri Business Analyst
Downtown must have an adequate concentration of resident-serving
establishments to be a quality residential community. This indicator measures the resident-serving retail establishments per block downtown. TABLE 1 shows the NAICS codes used to classify resident-serving establishments.
5. Supplementary Indicators
There are many additional ways to measure community diversity; racial diversity,
educational attainment, age distribution, and income distribution all have important implications for a residential community. Because not all of this data is available for custom geographies using Esri’s BAO, they were not included as core indicators.
IV. INDICATORS OF
DOWNTOWN IDENTITY
A successful downtown must have a unique and authentic identity. Based on the prior evaluation approaches described in Chapter 2, downtown’s identity is a product of its history and culture and the activity on its streets. These qualities are difficult to measure and even more difficult to compare across cities, but I identified three
core indicators of downtown identity that can be tracked consistently across cities.
1. Destinations per Square Mile Recommended data source:
ReferenceUSA, Esri Business Analyst
Using the same methods as the resident-serving business indicator above, I measure the density of destination businesses: bars, restaurants, theaters, nightclubs and
non-NAICS CODE BUSINESS TYPE
445 Food and Beverage Stores
446 Health and Personal Care Stores
6211 Offices of Physicians
62411 Child and Youth Services
6244 Child Day Care Services
6111 Elementary and Secondary Schools
5221 Depository Credit Intermediation
8121 Personal Care Services
8123 Drycleaning and Laundry Services TABLE 1. RESIDENT-SERVING
29
C
hapter3
resident serving retail, as outlined in TABLE 2.
2. Storefront occupancy
Recommended data source: CoStar
Active uses of ground-level storefronts have a major impact on a visitor’s perception of imageability (Ewing & Handy 2009). Although occupancy does not necessarily indicate an active use, the occupancy rates of storefront retail properties provide a reasonable indicator of street-level business activity.
3. Relative Concentration of Downtown Arts & Culture Jobs
Recommended data source: LEHD (OnTheMap)
The relative concentration of arts and cultural employment indicates downtown’s position as a regional cultural center. This indicator evaluates the percentage of an
Urban Area’s total “Arts, Entertainment and Recreation” employment (using NAICS Industry Sector classification, as provided in the Census’s OnTheMap tool) that is located in the Urban Area’s downtown. This indicator evaluates total jobs as opposed to primary jobs, based on the assumption that arts professionals are likely to have another career alongside their creative endeavors.
4. Supplementary Indicators
Although historic character and perception of crime are key elements of downtown identity, measures of these traits are not sufficiently comparable across downtowns.
In an attempt to include the downtown crime rate as an identity indicator, I found that although most law enforcement agencies have a public viewer for crime data, it is impossible to extract this data for analysis.
My attempts to create an indicator of historic character were also unsuccessful. Historic buildings are the second most significant feature contributing to the perception of imageability or identity (after the number of other people on the street; Ewing & Handy 2009). But the number of downtown historic buildings would be an impractical evaluation measure, since a city can do nothing to replace structures that have already been lost to time or urban renewal. I attempted to create an indicator to evaluate the cumulative investment in historic preservation by summing the total cost of downtown Historic Preservation Tax Credit projects but this measure was NAICS CODE BUSINESS TYPE
71 Arts/Entertainment/Recreation
721 Accomodation Businesses
722 Food Service & Drinking Places
451 Sport/Hobby/Book/Music Business
448 Clothing & Accessory Businesses
30
E
valuatingD
owntownD
ynamicsdifficult to normalize since the values would vary so much across cities.
Althouh these measures could not be compared across cities, this information is still valuable for individual downtown evaluations, so it is recommended that it be tracked as supplementary indicators.
V. CONSTRUCTING THE
INDEX
To aggregate the indicators into a composite Quality of Downtown Index, I normalized each variable using fixed target ranges rather than mean-standardized values. Though z-score normalization is common practice in walkability and vibrancy indexes, it is not a suitable technique for the QDI. Data for the quality of downtown indicators have not been collected for a large enough sample to normalize them against mean values and, more importantly, one of the primary intents of the index is to track changes over time in individual downtowns - an application that z-score normalization does not allow. If the QDI were based on z-score normalization, changes in a downtown’s QDI each year would demonstrate not only on changes in that downtown but also changes in the best and worst downtowns.
To evaluate changes in quality over time as well as across cities, I established static minimum and maximum values for each indicator. This technique comes from the methodology behind the United Nation’s Human Development Index, which is normalized using fixed “goalposts” based on historical minimums and projected
maximums for each variable (Anand and Sen 1994, p. 11). The Transit Score released by Walk Score also normalizes scores based on static values, defining a perfect score as the averaging of five model cities: San Francisco, Chicago, Boston, Portland and Washington, D.C.
TABLE 3 shows the minimum and maximum values used to normalize each measure, as well as the conceptual reasoning behind the chosen range. The maximum values for job density and population density were based on estimated values from three model cities: Chicago, Philadelphia and Washington D.C. There locations were chosen simply because their downtowns are dense, but their density is not often met with the same level of criticism as New York or Los Angeles.
sub-31
C
hapter3
index scores are summed for a maximum score of 100.
The development of a composite indicator requires many considerations. Academics have harshly criticized hastily developed indexes (Böhringer and Jochem n.d.). The intent of this thesis was to present improved downtown evaluation methods, but fully developing and testing a composite indicator goes beyond this project’s scope. The index methodology presented here should not be viewed as definitive but rather seen as a starting point for further research and validation. The normalization ranges are subjective and could be
32
E
valuatingD
owntownD
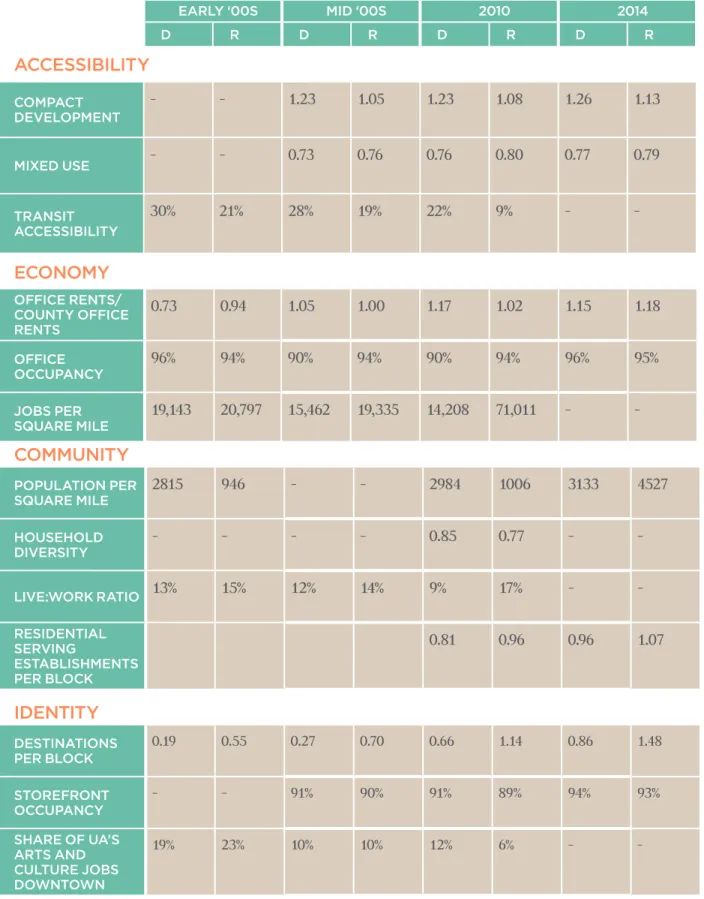
ynamicsDOWNTOWN ACCESSIBILITY SUB-INDEX
CHARACTERISTIC OPERATIONAL INDICATOR NORMALIZATION RANGE JUSTIFICATION
COMPACT
DEVELOPMENT Floor Area Ratio 0.3 to 15 Leinberger uses 0.3 as the maximum FAR for drivable suburban development (2007,
p.114). A downtown with a suburban FAR is given no points. 15 was a common FAR found in NYC commercial Zoning codes
MIXED USE Entropy of commercial land uses
by lot size
0 to 1 Implicit in entropy model. Completely even distribution = 1
TRANSIT
ACCESSIBILITY Share of downtown workforce living within walking distance
of transit
0 to 1 Natural range of 0 to 1 (There are likely places were transit is minimal enough to result in near 0 scores and others where nearly every worker can walk to transit)
DOWNTOWN ECONOMY SUB-INDEX
CHARACTERISTIC OPERATIONAL MEASURE NORMALIZATION RANGE JUSTIFICATION
OFFICE RENTS Ratio of downtown office rents to
county office rents
0.5 to 2 Based on max difference between CBD and suburban markets in Malizia 2014. No additional points are assigned for rents more than twice the surrounding suburbs. Zero points are assigned downtowns with rents less than half those in surrounding suburbs.
OFFICE OCCUPANCY Average annual office occupancy
rate
0.75 to 1 Assumes full occupancy is ideal. No points are assigned where fewer than 75% of downtown’s storefronts are occupied.
JOB DENSITY Primary jobs per mi2 0 to 343,500 The maximum value was determined by
averaging estimated jobs per square mile in three model downtowns
33
C
hapter3
DOWNTOWN IDENTITY SUB-INDEX
OPERATIONAL MEASURE NORMALIZATION RANGE JUSTIFICATION
DESTINATIONS Destinations per block 0 to 21 Destinations are determined using seven
NAICS codes. This range assumes that no additional value would be gained by having more than 3 of each type of destination on each block.
STREET LEVEL
ACTIVITY Storefront occupancy 0.5 to 1 Full occupancy is ideal. No points are assigned where fewer than half of
downtown’s storefronts are occupied.
ARTS AND CULTURE Share of Urban Area’s Arts, Culture
and Entertainment jobs located downtown
0 to 1 Natural range of 0 to 1, there are likely places were this figure is minimal enough to result in near 0 scores and others where nearly all arts activity occurs downtown
DOWNTOWN COMMUNITY SUB-INDEX
COMMUNITY OPERATIONAL MEASURE NORMALIZATION RANGE JUSTIFICATION
POPULATION DENSITY Population per mi2 0 to 22,500 The maximum value was determined by
averaging estimated population per square mile in three model downtowns
HOUSEHOLD
DIVERSITY Entropy of household types 0 to 1 Implicit in entropy model. Completely even distribution = 1
LIVE WORK DYNAMIC Share of employed population
living within ¼ mile of downtown, who also work downtown
0 to 1 Natural range of 0 to 1. 1 meaning every employed resident within walking distance of downtown works downtown.
RESIDENTIAL
SERVICES Resident serving business per block 0 to 10 Resident serving businesses are determined using ten NAICS codes. This range
34
E
valuatingD
owntownD
ynamicsAPPLYING THE QDI
IN TWO MID-SIZED
SOUTHERN CITIES
T
o test whether the Quality of Downtown Indicators can truly guage
downtown’s overall quality, I applied it to two of the downtowns I know
best: Durham and Raleigh, North Carolina. This chapter discusses the Quality
of Downtown Indicators in practice.
I chose to test my indicators on these cities because I am familiar with their downtowns and I have witnessed much of their recent revitalization. My familiarity allowed me to bett er compare the
QDI’s measures with local perception of downtown changes and to compare the accuracy of various data sources. These downtowns are also of the class that I believe most needs improved evaluation criteria; they are changing rapidly, but existing evaluation measures are a poor fit for their idiosyncratic boundaries (see Chapter 2 section C).
This chapter begins by introducing the two downtowns. I will briefly discuss their histories and the timelines of their downtown decline and revitalization. Next, I will explain how I determined the boundaries by which to define downtown geographies. I then explain challenges and idiosyncrasies uncovered while operationalizing the indicators before presenting each downtown’s resulting QDI.
A. CONTEXT
Raleigh and Durham are neighboring cities in central North Carolina, known for their research and educational institutions. Though they are often discussed as a unified region, the Census has placed them in separate metropolitan areas since 2003 (US Census Bureau, Historical Delineation Files). When the cities are grouped, it is often as part of the “Research Triangle” or simply “The Triangle” (the other point on the Triangle being Chapel Hill, which is a part of Durham’s urbanized area).
35
C
hapter4
most of the last half century, Raleigh and Durham have largely built their identities around it (Rohe 2012). In more recent years, however, both cities have been cultivating more individualized, increasingly urban identities.
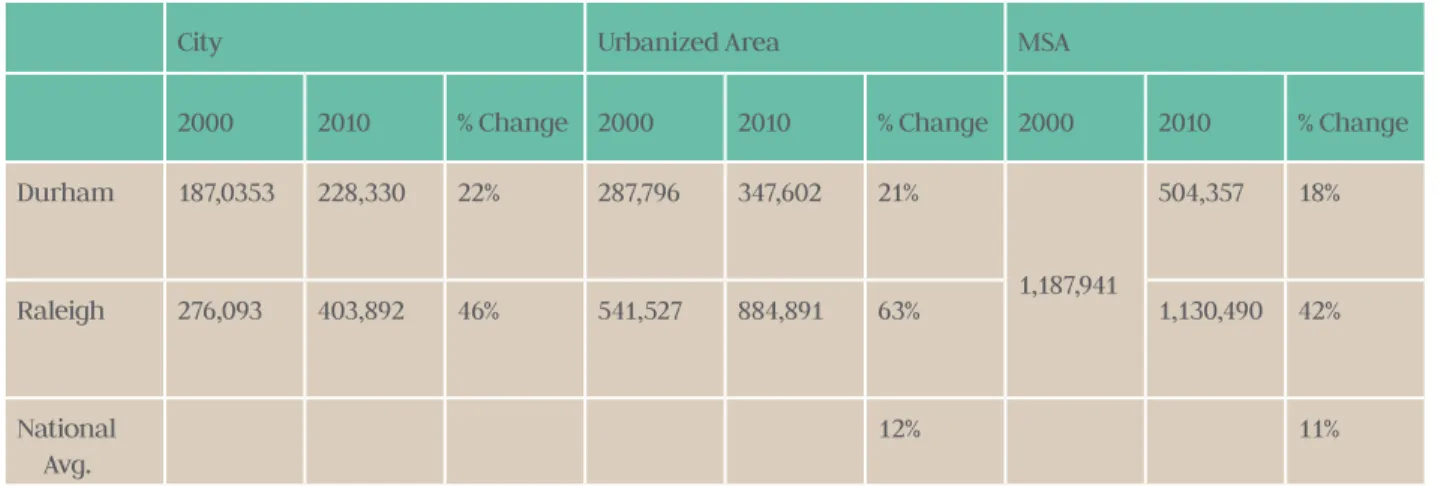
Between 2000 and 2010, Raleigh and Durham grew at rates well above the national average (Table 1), but RTP’s workforce was declining during the same time period (Jones 2005). As IBM and Glaxo-Smith-Kline made headlines with major RTP job cuts, revitalization and redevelopment projects in Downtown Raleigh and
Downtown Durham were attracting cutting edge technology firms.
A little over two decades ago, few would have imagined that the downtowns of either of these cities would be competing with RTP for the offices of major companies. In 1993, office rents in Downtown Durham were just one-third to one-half the rates of comparable suburban markets (Space 1993). The many warehouses of Downtown Durham, once a major hub of the tobacco trade, sat empty after American Tobacco and Liggett & Myers closed their doors in 1987 and 2000 respectively (Rohe 2012, p.191). As late as 2000, Main Street was described as “empty” and “deserted, even during the day” (Barrett 2000).
With a substantial governmental workforce, Downtown Raleigh never reached the same level of decline as Downtown Durham. But in the 1970s, as regional malls pulled retailers into the suburbs, the City of
Raleigh responded dramatically, converting Fayetteville Street to a pedestrian mall. Closing Downtown’s primary shopping street to traffic ultimately led to further
decline and by the early 1990s the street and its storefronts were mostly empty (Rohe 2012, p.201).
Today, Fayetteville Street is open to automobile traffic and Downtown
Raleigh has seen tremendous investment in multifamily residential and office developments. Likewise, the streets of Downtown Durham are more active than they have been in decades. Both downtowns are hubs for early stage ventures and start up activity. American Underground, an entrepreneurial hub with backing from Google, has two locations in Downtown Durham and one in Downtown Raleigh, holding 205 startups among them (Ohnesorge 2015).
Recently, Downtown Raleigh has been the relocation destination for several high profile tech companies: Citrix renovated 130,000 SF of office space in Downtown Raleigh’s Warehouse District; Red Hat moved all of its Raleigh employees to a downtown office tower; and Ipreo has plans to invest over $3 million in a new downtown facility (Ohnesorge 2012; Hoyle and Baysden 2011; Ohnesorge 2013). In addition to the tech startups of American Underground, Downtown Durham holds offices for a diverse range of establishments, including several that previously had
or still have offices in RTP, including
GlaxoSmithKline, Burt’s Bees and FHI 360, a nonprofit human development organization.
36
E
valuatingD
owntownD
ynamicsorganic processes; both were guided by bold visioning plans, catalyzed by major developments and funded by optimistic investors. The timeline above outlines the critical moments in the revitalization of each downtown.
B. DETERMINING
BASELINES
Before applying the QDI to downtown Raleigh and Durham, I had to determine the temporal and geographic scope of the evaluation. Given the events outlined above, it seemed that an ideal baseline would be 1990, before any catalytic developments or plans had emerged in either downtown. However, the temporal availability of the necessary data proved that timeframe to be overly ambitious.
Of the indicators that can be evaluated with historical data, most are not available until after some time between 2000 and 2006. The Census has released Longitudinal Employment Dynamics (LED) data for most
of the nation beginning in 2002. CoStar provides information on Durham and Raleigh office markets dating back to 2000, but data for other commercial properties begins in 2006. The CoStar data used to find the denominator of the FAR measure is only accessible for current properties.
Esri’s Business Analyst Online only provides data for some of its Census variables for 2000 and it only provides the data based on the American Community Survey for the most recent 5-year release. Its business location data also shows only the most current information.
Historical data on crime, public transit access and business locations is difficult to access and thus is not included in the longitudinal evaluations. If a local agency with easy access to this data were conducting an evaluation, I would encourage them to include it. If these indicators were tracked regularly for a
City Urbanized Area MSA
2000 2010 % Change 2000 2010 % Change 2000 2010 % Change
Durham 187,0353 228,330 22% 287,796 347,602 21%
1,187,941
504,357 18%
Raleigh 276,093 403,892 46% 541,527 884,891 63% 1,130,490 42%
National Avg.
12% 11%