IN BALTIMORE CITY, MARYLAND
By
SUMNER HANDY
A paper submitted to the faculty of
The University of North Carolina at Chapel Hill in partial fulfillment of the requirements for the degree
Master of City and Regional Planning
7 April 2017
This paper represents work done by a UNC-Chapel Hill Master of City and Regional Planning student. It is not a formal report of the Department of City and Regional Planning, nor is it the work of the
department’s faculty.
Approved by:
Contents
Definition and Description ... 3
Review of the Literature ... 5
Connection between transit access and employment ... 5
The ADA mandate ... 5
Defining accessibility ... 6
Difficulties of measuring accessibility for people with disabilities ... 6
Methods and Results ... 8
Discussion... 12
Implications for Further Study ... 17
Appendix ... 18
Map 1. ... 18
Map 2. ... 19
Map 3. ... 20
Map 4. ... 21
Map 5. ... 22
Definition and Description
According to research we review in the next section, improvements to people’s economic conditions can be triggered by improvements to their access to transit. Legislation like the Personal Responsibility and Work Opportunity Reconciliation Act of 1996 (also known as the welfare reform act) and the
Transportation Equity Act for the 21st Century affirm that this idea has gained national momentum. However, there has been comparatively little discussion about the needs of disabled people regarding their access to transit, even as people with physical disabilities are among the most economically vulnerable groups. This report explores whether the relationship between access to transit and employment rates is the same for people with disabilities as for able-bodied people.
In the year 2000, per the US Census, nationwide 24% of able-bodied people aged 21-64 were not employed while 66% of people with physical disabilities were not employed. In Baltimore, those figures are 31% and 75%, respectively. These are not unemployment figures, which take into account labor force participation, but the difference is stark. Nationwide there were nearly 11 million people with physical disabilities in that age group in the year 2000, making about 7 million non-employed people with disabilities. According to the BLS, these employment disparities have continued into 2015. Further, according to the Americans with Disabilities Household Economic Studies (2002) report, the median individual income for people with a non-severe physical disability was $13,100; the median individual income for people with no disability was $25,000. People with disabilities are also more likely to be in poverty.
According to the 2002 Household Economic Studies: Americans With Disabilities report, which surveys Americans at large and then disaggregates by disability status, people who reported very good or excellent health were less likely to have a disability than people who reported fair or poor health.1 Badland et al (2016) found that commute times were shorter for people who lived in areas where more people commuted to work by transit; that shorter commute times were associated with less time spent sitting; and that people who spent less time sitting had better self-rated health. We might therefore conclude that people with greater access to transit would report better health outcomes, further bolstering the touted benefits of transit access for people with disabilities. But people with disabilities use transit less frequently than do able-bodied people. According to the Bureau of Transportation Statistics (2002), about a third of people with disabilities use no or limited public transportation; an additional 17% have some difficulty using transportation due to their disability. There is a lack of data on commute patterns for people with disabilities, but we can infer that they are less likely than able-bodied people to use public transit. The National Council on Disability (2005) noted that some people with disabilities are willing and able to work, but cannot for inadequate access to transportation.
Considering the economic and health disadvantages of people with physical disabilities, the questions of whether and how well transit infrastructure serves this group are relevant not just from economic development and social justice perspectives, but also a legal perspective, given the 1990 Americans with Disabilities Act. This study explores whether the relationship between access to transit and employment rates is the same for people with disabilities as for able-bodied people. Here we evaluate employment rates for people with physical disabilities2 relative to their access to transit. We control for several
1 The Household Economic Studies reports are a series produced by the US Census. The 2002 report is report
P70-107 and the 2010 report is report P70-131.
2 Note that the 2000 Census asked respondents to identify their type of disability: physical, hearing, etc. In this
Review of the Literature
There is a body of literature that explores the connection between access to transit and employment. There is also a body of literature that discusses the importance of measuring accessibility and the best ways to do it, and a related body that acknowledges the difficulties of measuring accessibility for people with disabilities. However, there is little literature that directly addresses the question of access to transit and employment rates specifically for people with disabilities. This study will aid in the
establishment of that literature, and complement the existing work that has been done researching the connections between access to transit and employment, the definition of accessibility, and the best ways to measure accessibility.
Connection between transit access and employment
According to Sanchez (1999), researchers have paid little attention to the connection between labor force participation and access to transit. Rather, researchers have commonly focused on what has been referred to as the spatial mismatch hypothesis which explores the relationship between labor
participation and the spatial separation of jobs and workers’ residences. Teitz and Chapple (1998) conducted a thorough review of the literature exploring this hypothesis. Controlling for race, job skill level, relative access to employment locations by public transit, and household composition as factors affecting employment for workers living in Portland, OR, and Atlanta, GA, Sanchez found that “it appears possible that improved access to public transit can overcome the physical separation between the residential locations of Nonwhite workers and job locations.” Sanchez acknowledges, however, that his study does not indicate a causal relationship between increased access to public transit and increased employment rates. I echo that disclaimer in this study.
Sanchez suggests extending his research by conducting an analysis of many cities with similar
compositions but with varying transit systems and access. That work could reveal the marginal benefits of increased or improved public transit service as it relates to labor force participation. While this study does not stand in for such a broad-scale, composite study, even as we review the 50 largest cities in the United States, it does expand the question of differential employment to a city and population sub-group not yet studied.
Cervero et al (2002) found that a concentration of housing near transit stops was important in stimulating higher rates of employment. Yi (2006), controlling for race and age, found that job
accessibility by transit has a stronger effect on increasing labor force participation than does access to a private vehicle. Alam (2009) found an inverse relationship between transit accessibility to jobs and the amount of time people spend on welfare, implying that transit accessibility plays a role in employment rates. While none of these studies addresses people with disabilities uniquely, they all serve to indicate that transit access likely has a positive effect on employment.
The ADA mandate
The US Congress made the Americans with Disabilities Act (ADA) law in 1990. The ADA requires that public transit agencies make their services accessible to people with disabilities. Since then, rulemaking has progressed. Nancy Coburn’s (1992) report, Guidelines for Improvements to Transit Accessibility for People with Disabilities, provided the earliest thorough discussion of the needs of people with
disabilities with respect to access to transit.
the station or terminal. People with physical disabilities, the subset of people with disabilities who are the focus of this study, may have particular challenges when attempting to use public transit. These challenges include stepping up to or down from a vehicle; moving inside a vehicle; sitting or standing up; and moving to or from the doorway of a vehicle. Assistive devices like canes and walkers may make maneuvering inside a vehicle more difficult, and often require the use of one or both hands, which may make maintaining stability in a moving vehicle more difficult.
Coburn’s now-dated report focused on the transit service itself, but ignored the pathways utilized between the would-be rider’s origin and the transit stop. Other documents have established standards for sidewalks and other public infrastructure, but there has been no systematic exploration of the quality of this intervening public infrastructure and its effect on the relationship between transit access or use and employment of people with physical disabilities.
Defining accessibility
Handy and Niemeier (1996) explored ways to measure accessibility by performance measures. They characterize accessibility as being “determined by the spatial distribution of potential destinations, the ease of reaching each destination, and the magnitude, quality, and character of the activities” found at these destinations. When considering the accessibility of transit service, this paper adequately accounts for only the first of these three aspects of accessibility: the spatial distribution of transit stops. No effort is made to account for either how easy it is for people with disabilities to reach each destination
(outside of the distance to them) or to account for the quality of the transit stop.
(We might consider the quality of the sidewalk or other impedance variables, like ambient crime rate, when considering the ease with which people can access transit stops. We might consider whether the transit stop is a bus or rail line, whether a transfer is required to reach the individual’s destination, the stop’s safety, and frequency and reliability of service as aspects of the destination’s quality.)
When Levine and Garb (2002) consider measures of accessibility, they focus more on the ability to reach destinations easily rather than on the quality of those destinations. While this idea does well as a starting point to differentiating it from and preferring it to measures of mobility (the ability to move quickly or freely), it falls short of Handy and Niemeier’s thoroughness. Nevertheless, Levine and Garb’s conception is closer to the measure used in this report.
Marston and Church (2002) draw out Levine and Garb’s basic notion with more nuance: “The greater the number of potential destinations within some defined time or distance range, the greater the accessibility. The closer such choice destinations are within this maximum range, the higher the level of accessibility. An accessibility measure estimates the level of access to some type of activity from a starting location or home location to one or multiple locations.” This thorough definition is useful in justifying the measure used in this study.
Difficulties of measuring accessibility for people with disabilities
the cost of travel for people with physical disabilities is higher than it is for able-bodied people, including and perhaps especially the cost of the segment of the trip that is route from home to the transit stop, and back again.
Methods and Results
For several reasons Baltimore City is a good case city on which to center our analysis. The spatial, transportation, and economic development patterns of Baltimore City mirror those of many other urban areas across the United States. Beginning in the 1800s, Baltimore City increasingly grew outward from its port through its new gridded street network, institutionalized its first public transit in horsecars with in-laid tracks, and paved its streets around the turn of the 20th century. Like many northeastern cities, the second half of the 20th century brought an influx of southern rural and Black labor, then white flight, and then deindustrialization, along with urban renewal projects centerpieced by downtown freeway construction and the following redevelopment and revitalization of the Inner Harbor.
In the last three decades, Baltimore has met economic challenges, but retained and developed some bright spots of the 21st century economy. The computer and electronic parts manufacturing (CEPM) industry has seen increased specialization in the metropolitan statistical area. Baltimore continues to be a national leader in the “eds and meds” industries, with several educational institutions and hospital establishments underpinning the economy. Accompanying these economic developments were large public transportation investments in the heavy metrorail system (opened 1983), the light rail system (opened 1992), and a redevelopment of the bus network (opening summer 2017). These general patterns of development can be seen in many other cities across the country and make Baltimore an ideal case for this study.
The 2000 Census was the last to collect data on employment status by particular disability status – physical, hearing, vision, etc. Here we have considered only individuals who reported having a physical disability. This data was collected at the census tract level and is used, in this report, as the measure of employment by disability status.
It is important to note that the percentage of people with physical disabilities that is not employed differs from the unemployment rate in an important way. While the unemployment rate considers only individuals who are in the labor force – that is, employed or those not employed but looking for work – the percentage of individuals with physical disabilities that is not employed does not consider whether they are looking for work. This is an acceptable difference in this study as we do not at any point seek to compare the unemployment rates for the physically disabled with that of the overall population; rather, we use these data only to determine statistical associations.
The Environmental Protection Agency has calculated several transit accessibility metrics for all cities that submit General Transit Feed Specification (GTFS) data. In keeping with a simple definition of
Regarding the first assumption – that the location and incidence of transit stops has not changed substantially since the year 2000: according to employees of the Maryland Transit Administration, they have not. This past summer we had the opportunity to work with the Maryland Transit Administration. In preparation for this research, we spoke with the manager of project development, a project manager, and a senior transit service planner, each of whom confirmed that the location of transit stops
throughout Baltimore City has not meaningfully changed since the year 2000. Fixed rail transit stops (for the light rail and the metro subway) have remained unchanged, and the locations of bus stops have changed only marginally.
The second assumption is that the weighted population centroid of a unit of analysis has not changed since the year 2000. From 2000 to 2010, according to the US Census, the population of Baltimore City fell from about 650,000 people to about 620,000 people, a drop of about 4.5%. While residential patterns have thus changed, we assume here that the relative location and within-tract spatial
distribution of residents’ residences has not. With that assumption, the weighted population centroids are assumed to have remained the same, and therefore do not affect the use of variable D4a for this analysis of transit accessibility.
When we broaden the analysis to other cities, we make these same assumptions.
Our analysis consists of ordinary least squares regression tests, using employment rates for people with physical disabilities as the dependent variable and their access to transit as the explanatory variable of interest. We also control for the number of jobs within a 45-minute transit commute, the tract’s median household income, the tract’s job density, and the tract’s high school dropout rate. I conducted the same analysis for non-disabled people.
The EPA’s Smart Location Database reports its transit accessibility statistics at the block group level. For this analysis, I have used a dataset that has calculated those block-group level statistics at the census tract level, weighting by population. The number of jobs within a 45-minute transit commute is variable
D5br, also from the EPA’s Smart Location Database; this value has a distance decay formula applied to it, more about which can be found in the EPA’s Smart Location Database Userguide.
The tract’s median household income is from the 2000 Census, in 1999 dollars. To calculate the tract’s job density, I divided the tract’s total 2002 employment by its total area. To calculate the tract’s high school dropout rate I divided the number of high school dropouts by the total number of people in the tract, aged 16 to 19.
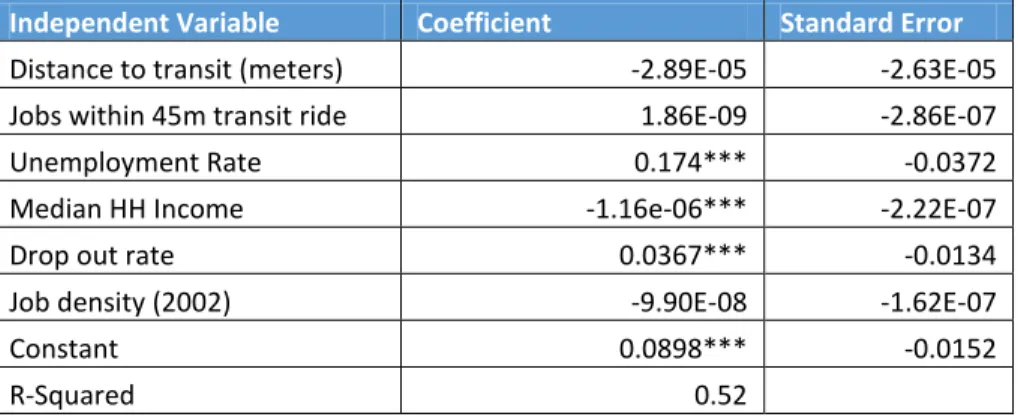
Table 1. Baltimore City – Effects on Unemployment of People with Physical Disabilities
Independent Variable Coefficient Standard Error Distance to transit (meters) -2.89E-05 -2.63E-05 Jobs within 45m transit ride 1.86E-09 -2.86E-07 Unemployment Rate 0.174*** -0.0372 Median HH Income -1.16e-06*** -2.22E-07 Drop out rate 0.0367*** -0.0134 Job density (2002) -9.90E-08 -1.62E-07
Constant 0.0898*** -0.0152
Note: *** p < 0.01; ** p < 0.05; * p < 0.1
Table 2. Baltimore City – Effects on Overall Unemployment Rate
Independent Variable Coefficient Standard Error Distance to transit (meters) -5.29E-05 -5.18E-05 Jobs within 45m transit ride 1.13e-06** -5.59E-07 Median HH Income -3.41e-06*** -3.60E-07 Drop out rate -0.0445* -0.0263 Job density (2002) -6.22e-07* -3.18E-07
Constant 0.222*** -0.0252
R-Squared 0.457
Note: *** p < 0.01; ** p < 0.05; * p < 0.1
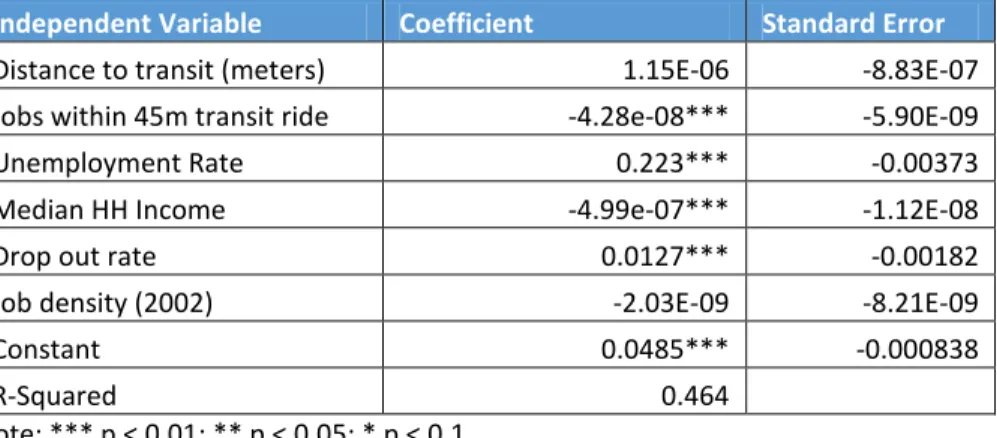
Table 3. 50 Largest Cities – Effects on Unemployment of People with Physical Disabilities
Independent Variable Coefficient Standard Error Distance to transit (meters) 1.15E-06 -8.83E-07 Jobs within 45m transit ride -4.28e-08*** -5.90E-09 Unemployment Rate 0.223*** -0.00373 Median HH Income -4.99e-07*** -1.12E-08 Drop out rate 0.0127*** -0.00182 Job density (2002) -2.03E-09 -8.21E-09
Constant 0.0485*** -0.000838
R-Squared 0.464
Note: *** p < 0.01; ** p < 0.05; * p < 0.1
Table 4. 50 Largest Cities – Effects on Overall Unemployment Rate
Independent Variable Coefficient Standard Error Distance to transit (meters) -1.44e-05*** -1.88E-06 Jobs within 45m transit ride 1.95e-07*** -1.25E-08 Median HH Income -1.38e-06*** -2.11E-08 Drop out rate 0.0397*** -0.00386 Job density (2002) -5.56e-08*** -1.75E-08
Constant 0.136*** -0.00142
R-Squared 0.327
Note: *** p < 0.01; ** p < 0.05; * p < 0.1
When we apply these variables to the overall unemployment rate in Baltimore City, the distance to transit stops is also insignificant (at the 95% confidence interval, p = 0.308). However, the number of jobs within a 45-minute commute is significant (p = 0.045). Median household income is significant (p = 0.000), but dropout rate (p = 0.092) and job density (p = 0.052) are not.
In Baltimore City, the distance to the nearest transit stop appears to have no significant effect on unemployment for either people with physical disabilities or able-bodied people.
When we expand to the 50 largest cities in the United States in the year 2000 (St. Louis ranked 50th in total population, with about 348,000 people), we see similar results. (Baltimore is included in the broader analysis as well.) For people with physical disabilities, the distance to the closest transit stop (p = 0.194) and the density of jobs within the tract (p = 0.805) are insignificant. However, the number of jobs within a 45-minute transit commute (p = 0.000), the dropout rate (p = 0.000), median household income (p = 0.000), and the overall unemployment rate (p = 0.000) are all significant. That model as a whole, however, only explains about 46% of the variation in the percentage of people with physical disabilities that are not employed.
When looking at those variables’ effects on the overall unemployment rate in the 50 largest cities, all are significant (p = 0.000 for all except job density, for which p = 0.001).
There are several limitations to this research. As Marston and Church (2002) acknowledge, the accessibility measurement used in this paper (distance from weighted population centroid to nearest transit stop)is problematic in that it fails to account for the intervening trip that the physically disabled person must traverse in order to reach the transit stop. In the case of this variable, the nearest transit stop for most population centroids is likely a bus stop; for a bus stop, then, sidewalk conditions and the steepness of the terrain, as well as endogenous barriers to the use of bus transit more generally (like weather), may affect how accessible this transit stop is and, therefore, transit’s utility to people with physical disabilities. And as we noted earlier, this study is not meant to establish whether there is a causal relationship between access to transit and the employment rates of people with physical
Discussion
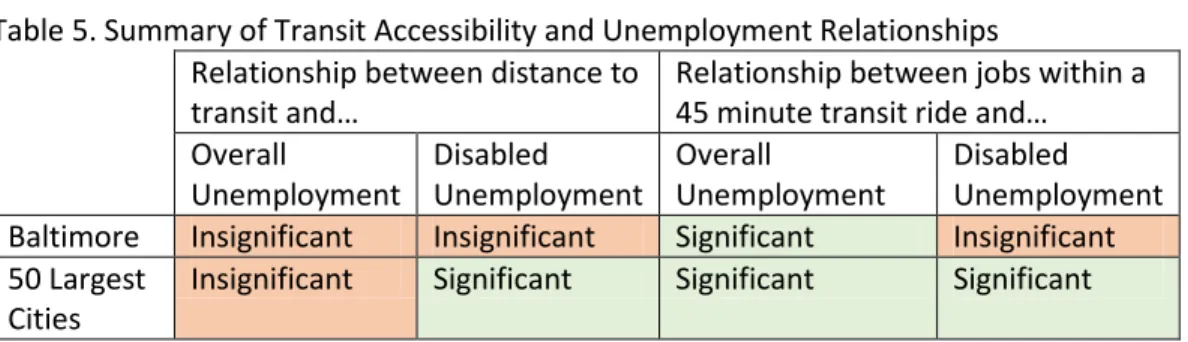
As we have just discussed, we have mixed results, as summarized in Table 5.
Table 5. Summary of Transit Accessibility and Unemployment Relationships Relationship between distance to
transit and…
Relationship between jobs within a 45 minute transit ride and… Overall
Unemployment
Disabled Unemployment
Overall
Unemployment
Disabled Unemployment Baltimore Insignificant Insignificant Significant Insignificant 50 Largest
Cities
Insignificant Significant Significant Significant
In this study, we are particularly interested in where the results in Baltimore vary from those
nationwide: why are the relationships between access to transit variables and employment of people with physical disabilities insignificant in Baltimore, but significant nationwide? In the maps below, we visualize some relationships between the disabled and indicators of economic well-being.3
Map 1.
In the year 2000, $17,050 was the poverty line for a family of 4.
In map 1, we see the percentage of the working population (ages 21-64) that is disabled overlaid median income. We see visual alignment between the incidence of disabled people of working age and the two lowest income buckets, reinforcing the fact that people with disabilities earn less.
Map 2.
A quarter mile, about 400 meters, is generally considered "walking distance" for able-bodied people.
Map 3.
We see the relationship presented in Map 2 mirrored in Map 3. The central business district has high numbers of jobs accessible by a 45-minute transit commute, while the outer portions of Baltimore City have relatively few jobs accessible within a 45-minute transit commute. Again we see a lack of
Map 4.
Map 5.
We may make some conjectures, then, regarding the lack of relationship between access to transit and the employment of people with physical disabilities in Baltimore, even as this relationship exists in urban areas across the country. First, Baltimore’s backbone of public transit is its bus fleet. Despite the federal requirement that all buses be wheelchair accessible, not all fleet vehicles are. There are also the
psychological effects of causing delays on a bus route by requiring the ramp and asking passengers to make way.
Implications for Further Study
While most of the literature to date has focused on the spatial mismatch hypothesis and whether access to transit can alleviate poverty, or increase employment for un- or under-employed people and victims of racial discrimination, this study begins the conversation about the connection between transit access and employment rates for a different vulnerable group: people with physical disabilities.
We have found in this study varying degrees of significance in the relationships between transit accessibility variables and unemployment for people with physical disabilities. In Baltimore, neither distance to the transit stop nor the number of jobs accessible within a 45-minute transit commute appear to have a significant association with employment rates for people with physical disabilities. In the 50 largest US cities, these two relationships are both significant. In the preceding section, we have discussed a few possible explanations for why this may be so, but there is additional research to be done.
While the distance to the nearest transit stop is not significant in explaining variation in employment for people with physical disabilities in Baltimore City or in the 50 largest cities in the United States, it is significant in explaining some of the variation in the overall unemployment rate in those 50 cities overall. Given that this is so and given the Bureau of Transportation Statistics survey results referenced earlier, further research should consider the actual practical accessibility of public transit services for people with physical disabilities. This should consider the condition of sidewalks, curb cuts, and streets between homes and transit stops, as well as the transit infrastructure used by the serving agency. Focusing this research in a case study city like Baltimore could yield some important findings. Given the remarkably high rates of unemployment for working-age people with physical disabilities in Baltimore, we should have the ability to readily observe changes in these rates.
Additionally, there is an opportunity to consider whether there is anything unique about Baltimore’s public transportation system or labor market such that employment around the turn of the century was not influenced by the distance to the nearest transit stop either for the disabled or for able-bodied people. We earlier referenced the limitations of Baltimore’s heavy and light rails systems; a systematic review of this data in cities with similar rail infrastructure may be beneficial to pursuing these ends.
Baltimore is also on the eve of revamping of its bus service to the city and surrounding areas (scheduled to occur in June 2017); a before-and-after study reviewing whether the new system influenced
Appendix
References
Alam,Bhuiyan Monwar. 2009. Transit Accessibility to Jobs and Employment Prospects of Welfare Recipients Without Cars: A Study of Broward County, Florida, Using Geographic Information Systems and an Econometric Model. Journal of the Transportation Research Board 2110, 78-86.
Badland, Hannah, Allison Milner, Rebecca Roberts, and Billie Giles-Corti. 2016. Are Area-Level Measures of Employment Associated with Health Behaviours and Outcomes? Social Indicators Research. DOI: 10.1007/s11205-016-1417-z.
Bureau of Transportation Statistics. 2002. Transportation Availability and Use Study for Persons with Disabilities, 2002. U.S. Department of Transportation.
Cervero, Robert, Onésimo Sandoval, and John Landis. 2002. Transportation as a Stimulus to Welfare-to-Work: Private Versus Public Mobility. Journal of Planning Education and Research 22:1, 50-63.
Church, R. L. and J.R. Marston. 2003. Measuring Accessibility for People with a Disability. Geographical Analysis 35:1, 83–96.
Coburn, Nancy. 1992. Guidelines for Improvements to Transit Accessibility for People With Disabilities. Hathi Trust.
EPA. 2014. Smart Location Database Userguide.
Handy, S. L., and D. A. Niemeier. 1997. Measuring Accessibility, An Exploration of Issues and Alternatives. Environment and Planning A 29, 1175–1194.
Jiwattanakulpaisarn, P., Noland, R. and Graham, D.J. 2010. Causal Linkages Between Highways and Sector-Level Employment. Transportation Research Part A, 44, 265-280.
Levine, Jonathan and Yaakov Garb. 2002. Congestion Pricing’s Conditional Promise: Promotion of Accessibility or Mobility? Transport Policy 9, 179-188.
National Council on Disability. 2005. The Current State of Transportation for People with Disabilities in the United States.
Sanchez, Thomas W. 1999. The Connection Between Public Transit and Employment. Journal of the American Planning Association 65:3, 284-296.
Social Explorer Tables (SE), Census 2000, U.S. Census Bureau and Social Explorer.
Steinmetz, Erika. 2006. “Americans with Disabilities: 2002 Household Economic Studies.” U.S. Census.
Yi, Chang. 2006. Impact of Public Transit on Employment Status Disaggregate Analysis of Houston, Texas.