ABSTRACT
Introduction: Millions of Americans depend on a loosely organized and variable safety net health care institutions and providers, which is described as fragile, strained for resources, and vulnerable to shifting social, political, and economic forces. A call to action has been made by many to increase and improve efforts to monitor the structure, capacity, and stability of the safety net. Efforts to do so have been short lived, fragmented, and inconsistent. This task falls within the responsibilities of public health agencies.
Objective: This scoping review aims to identify focused assessments of health care safety net capacity in order to inventory and qualitatively map the indicators and metrics used to assess capacity, and the methodologies or primary sources used to obtain relevant data. Its findings inform recommendations for public health officials, researchers and other stakeholders interested in assessing safety net capacity, or furthering research on this topic.
Methods: A search of PubMed, Scopus, and Web of Science was conducted to identify English-language articles published between 2000 and 2018. Digital Commons and select government websites were searched to identify relevant unpublished literature. Eligible studies included descriptive reports and focused inquiries assessing the safety net including its
Results: Thirty-one articles were included. Three were comprehensive assessments of
community safety nets; the rest were focused on specific facilities, providers, or services within the safety net. Indicators of capacity used were grouped into 12 categories: Workforce,
Infrastructure, Range of Services, Specialist Availability, Primary Care Availability, Medicaid Participation and Indigent Care, Health Information Technology Capacity, Enabling Services, Organizational Capacity, Sentinel Events, Disaster Preparedness, and General Capacity. A wide range of metrics were used to assess these indicators. Both primary and secondary data were frequently used, but they were infrequently used in conjunction. Surveys, key informant interviews, and site visits were the most frequently used strategies for collecting primary data. The Uniform Data System, Medicare/Medicaid claims data, administrative data, and the AMA Masterfile were the most frequently used sources of secondary data.
ACKNOWLEDGEMENTS
Special thanks are warranted for Dr. Cynthia Feltner*, my academic advisor who was
essential at all stages in the development and completion of this study.
Research Librarian, John Cyrus†, deserves the highest praise for his efforts above and beyond the scope that his position mandates, which were crucial in the development of the research strategy, and compilation of findings, and presentation of results.
Thanks also to Jennifer Early‡, who provided important insight into the context of this study, which was directional in determining the study objectives and questions. Thanks also for agreeing to act as second reader, and provide valuable feedback on this lengthy work.
Finally, thanks to Dr. Danny Avula§, who provided the impetus for this study, and
dedicated significant time and thought to my efforts, despite enormous responsibilities.
*
Cynthia Feltner, M.D., M.P.H., who served as my Master’s Paper advisor, is the is associate director of the
RTI-UNC Evidence-based Practice Center as well as an assistant professor in the Department of Medicine at RTI-UNC and director of the Health Care and Prevention track of the Public Health Leadership Program at the UNC Gillings School of Global Public Health.†
John Cyrus, M.L.I.S., is an assistant professor, and the research and education librarian at Virginia Commonwealth
University’s Tompkins-McCaw Health Sciences Library.‡
Jennifer Early, R.N., M.S.H.A., and Doctoral Candidate, is the director of Community-Engaged Research at Virginia
Commonwealth University’s Division of Community EngagementTABLE OF CONTENTS
LIST OF TABLES AND FIGURES………...……….vii
INTRODUCTION………..…………..…………1
Background………...1
Context of Study...……….4
Study Objectives………5
METHODS ……….……….5
Identifying Research Questions ………..6
Identifying Relevant Studies ………6
Selecting Studies for Review ………...………7
Data Extraction ………..8
Collating, Summarizing, and Reporting Findings ……….9
RESULTS ... 9
What examples exist of focused assessments of capacity? ...10
What indicators are evaluated/metrics measured? ...17
How was data collected... 27
DISCUSSION ... 34
Summary of Findings ...34
Limitations ...35
Implications and Recommendations ...37
BIBLIOGRAPHY ……….. 40
APPENDIX A: SEARCH TERMS AND SYNTAX...48
APPENDIX B: LIST OF PEER COUNTIES...50
APPENDIX C: CRITICAL APPRAISAL OF INCLUDED STUDIES...52
LIST OF TABLES AND FIGURES
Table 1 – Descriptive summary of studies...12
Table 2 – Indicators and metrics used to assess safety net capacity...21
Table 3 – Primary data collection strategies for assessing safety net capacity...29
Table 4 – Sources of secondary data to assess safety net capacity...32
Table 5 – Critical appraisal of observational cohort and cross-sectional studies...55
Table 6 – Critical appraisal of before-after studies without controls...57
Table 7 – Critical appraisal of case-series studies...57
Table 8 – Summary of data extracted from reviewed articles...58
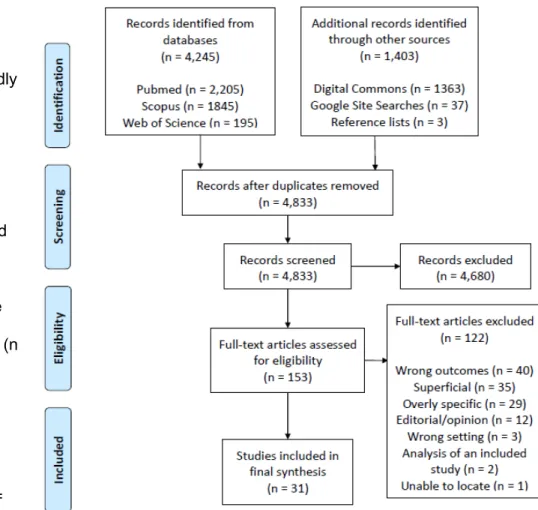
Figure 1 – PRISMA flowchart...10
Introduction Background
Although the 2010 passage of the Affordable Care Act reduced the numbers of the uninsured in the United States, 29 million people, or 9.0% of the population remained uninsured in 2017 (1). During the same time, 73 million people, or 25.6% of the population under 65 were enrolled in public insurance (1). Additionally, 41 million, or 28% of working age adults** with
insurance were considered to be underinsured†† in 2016, according to the Commonwealth Fund (2), and these numbers have been consistently rising. For many of these individuals, safety net health care organizations are the sole providers of primary and preventative care, urgent and emergency care, family planning services, substance abuse treatment, mental health care, and other essential health services (3).
The term “safety net” gives the false impression of a well-connected and organized system of providers and institutions. In reality, it is a highly localized, loose patchwork that is neither comprehensive nor well-integrated (4), and varies dramatically across the country, influenced by economic, political, and structural factors (5). While there is no clear and agreed-upon definition of the health care safety net, safety net providers are “distinguished by their commitment to provide access to care for people with limited or no access to health care due to their financial circumstances, insurance status, or health condition” (6) (p. 1). This study adopts the broad, yet widely accepted definition of safety net providers proposed by the Institute of Medicine (IOM): “Those providers that organize and deliver a significant level of health care and other health-related services to uninsured, Medicaid, and other vulnerable patients” (5) (p. 3). “Core health care safety net providers” include public hospitals, community health and migrant
** “Working age adults” are defined as individuals between 18 and 64 years of age.
health centers or clinics, and local health departments. But other types of institutions can also be included by this definition, such as teaching hospitals, rural health clinics, school-based health centers, Veterans and Indian Health Service facilities, family planning clinics, and some private clinics and hospitals that provide services to people regardless of their ability to pay (5).
The 2000 IOM report, America’s Health Care Safety Net: Intact but Endangered (5), described a safety net that is fragile, and frequently stressed for financial, infrastructural, human, and other resources. The report noted a significant paucity of reliable data to monitor the status and stability of the safety net, the services provided, and the capacity to meet the needs of the populations that depend on them. As a result, the IOM recommended that there be an effort at national, state, and county levels to improve the nation’s “capacity and ability to monitor the changing structure, capacity, and financial stability of the safety net” (5)(p. 10).
In response to this call to action, the Agency for Healthcare Research and Quality (AHRQ) and the Health Resources and Services Administration (HRSA) launched “The Safety Net Monitoring Initiative” (7) in 2002. This initiative aimed to assess the safety net broadly, and to provide local institutions with guidance to do so. It evaluated population characteristics, health status and needs, financial structures and stability, and institutional capacity. Although a
meaningful undertaking, budget constraints and shifting priorities brought the project to a close in 2004 (8). During its truncated operations, the initiative obtained data from 1999 or earlier, addressing 118 metrics to characterize the health care safety nets in 90 metropolitan areas (9) and 1,818 counties across 30 states and the District of Colombia (10). The HRSA also
published Tools for Monitoring the Safety Net, recommending strategies and tools to “assist state and local health officials, planners, and analysts in assessing the capacity and viability of their existing safety net providers” (11). This resource provides guidance for collecting
strategies for both primary and secondary data collection were also promoted.
While the term capacity is frequently used, and its assessment is a stated purpose of the HRSA initiative, it is not clearly defined in the published reports. For the current study, a
definition of capacity was adopted from health care operations management science (12): “Capacity is the maximum amount of output that a system can produce, with existing resources, in a given time period” (p. 230). A caveat of this definition is that capacity is a measurement of potential, since the system might not be used to its maximum extent. This distinguishes capacity from the use of services. Similarly, Felt-Lisk et al. (13) differentiates between “capacity” and “adequate capacity,” which is a system’s or provider’s ability meet the needs of a given
population. In this way, “capacity” can be conceptualized as exclusively describing the “supply side” of health care: the physical and human resources that are available to provide services. Conversely, the “demand side” of health care, i.e. population characteristics and needs, are not considered to describe capacity, but may be tied to metrics measuring the adequacy of
capacity. The author recognizes that if capacity is considered a potential value, then it cannot be measured directly, and therefore accepts that assessments of capacity will be proxy
measurements that serve as indicators of capacity, which include the supply-side resources and capabilities of safety net providers.
should support community-led efforts to inventory resources, assess needs, formulate collaborative responses, and evaluate outcomes for community health improvement and the elimination of health disparities” (p. 11). Numerous others have called attention to the
inadequacies and inconsistencies of existing data or monitoring initiatives to assess capacity, and the need for greater investment to do so (5,8,13,14,16,17).
This call to action aligns with recent evolutions in the scope of public health, termed “Public Health 3.0” (18,19). This movement calls on public health officials to fulfill the role of “Chief Health Strategists” to promote health in their communities, driving collective action by engaging a wide range of stakeholders; collecting and producing timely, locally relevant and actionable data, metrics, and analytics; and enhancing public health infrastructure through data-driven allocations of funding and resources. In fact, monitoring “the public’s ability to deal with needs by identifying available health resources” (20)(p. 2) is the second of three stated purposes for Community Health Assessments (CHA), an activity of public health agencies mandated for accreditation by the Public Health Accreditation Board (21). In the absence of a federal program to achieve this aim, such as that discontinued by the HRSA, the onus is on public health entities at the state and county levels, in collaboration with the academic community, and other sectors, to fulfill this duty. The ultimate aim of assessing safety net capacity is to improve access and health outcomes for vulnerable populations. This requires reliable data to direct policy makers and key stakeholders to ensure adequate capacity for the provision of needed services. This falls squarely within the duties of public health agencies. Context of Study
the context of changing demographics, and health system structures and financing. One result of this convening was an identified need for improved understanding and monitoring of local health resources and capacity. This study was undertaken in response to this need, with the intention of providing guidance to approach assessing safety net capacity.
Study Objectives
The primary objectives of this study are to identify focused assessments of health care safety net capacity in order to inventory and qualitatively map the indicators and metrics used to assess capacity, and the methodologies or primary sources used to obtain relevant data. The following research questions were derived to achieve these purposes:
1) In the published or unpublished literature, what examples exist of focused assessments of the health care safety net’s capacity to provide services to its population, and what levels of the safety net are assessed?
2) In these assessments, what indicators are evaluated, and by what metrics are they measured?
3) What methodologies are used to collect primary data, and what are the key sources of existing data used for secondary analysis?
The findings of this study are used to inform recommendations for public health officials, researchers and other stakeholders interested in assessing safety net capacity, or furthering research on this topic.
Methods
Several attributes of this study’s purposes supported a scoping review study design,
defined by Colquhoun et al. (24) as “a form of knowledge synthesis that addresses an
exploratory research question aimed at mapping key concepts, types of evidence, and gaps in research related to a defined area or field by systematically searching, selecting, and
explore the extent, range and nature of research on this topic, to summarize and disseminate its findings, and to identify gaps in the literature that might direct further research.
The author relied heavily on Arksey and O’Malley’s (25)five-step framework for scoping reviews, and incorporated the recommendations of Levac and colleagues (26)to the greatest extent feasible. While several members of the local educational, research, and public health community were involved with the study process, the author did not feel that the level of engagement fulfilled the intended purpose of “stakeholder consultation,” the framework’s optional sixth step. The proceedings of the framework’s five steps are described below. Identifying Research Questions
In order to achieve the stated objectives, and to maximize the usefulness of the study’s findings to key stakeholders, the author developed the above research questions in
collaboration with representatives of the local health department and its academic partners, and with input from academic advisors from the author’s home institution.
Identifying Relevant Studies
A similar search strategy was employed on June 5, 2018, to expand the search to unpublished works using Digital Commons (28), which includes “peer-reviewed journal articles, book chapters, dissertations, working papers, conference proceedings, and other original scholarly work” curated from a large network of academic institutions.
Finally, as the assessment of safety net capacity has been described as an appropriate role of local health departments, and a potential component of the CHA process, a structured approach was taken on June 10, 2018, to search a limited set of government websites for relevant reports. Although the findings of this study are intended to be broadly applicable, the context of its origins led the author use the County Health Rankings’ “Peer Counties Tool” (29) to generate a list of 33 counties similar to Richmond, Virginia in terms of demographic, social, and economic indicators. A list of these counties is presented in Appendix B. From this list, Google site search syntax was used to search keywords within corresponding government or local health department websites. A complete description of this syntax, and the search terms used, can also be found in Appendix A. The first 100 results of each search were screened for relevant articles. These government websites were also searched for the most recently
published CHA reports. Selecting Studies for Review
While the author was the primary reviewer, the research librarian (J.C.) was consulted where there was uncertainty regarding eligibility of some study designs. This included
discussions to clarify rationales and resolve disagreements on the selection of articles. Using Covidence (30), a systematic review software, all titles and abstracts were reviewed for general relevance. Eligibility criteria were refined post-hoc as familiarity of the literature developed, ensuing multiple rounds of title and abstract screening. Full-text articles of abstracts that met the refined eligibility criteria were reviewed again for relevance.
cross-sectional, cohort, or before-and-after studies with or without a control group, in which safety net capacity was measured as either the independent or dependent variable. Only articles
published in the year 2000 or later were considered eligible, using the call to action in the
aforementioned IOM report (5) as a benchmark. Only articles written in the context of the United States were considered relevant. While editorial or expert opinion pieces were instrumental in developing the conceptual foundations of this study, they were not included in the analysis. Articles that only superficially assessed safety net capacity, in which only very basic measures were considered or methodologies were poorly reported, were excluded.
Given that the definition of capacity used here is a potential value, proxy measures were considered relevant if they assessed the “supply side” of the safety net health system - the resources available to provide services to the safety net population. This is to be differentiated from studies that assessed “demand side” elements that would determine if capacity was adequate. Studies that assessed population characteristics, needs, or usage of the safety net system were then excluded. Studies assessing the financial stability were also considered ineligible, as the significant changes in our health system’s financial structures over the last eighteen years, including the passage of the ACA, would have made much of the literature on this topic irrelevant to current-day readers. Additionally, while financial stability is an important upstream determinant of capacity, this study focuses on more direct indicators of capacity. Data Extraction
For all included studies, relevant data was extracted and charted to address our
research questions. Data categories included the author, year, source, the purpose of the study, study design, its geographic level of analysis (e.g. national, regional, state, county, city, etc.), the contextual level of assessment within the safety net (e.g. comprehensive, facility type, etc.), the indicators and metrics of capacity used, whether the study collected primary data or
from the sources whenever possible, the author critically reviewed the data, and developed a consistent nomenclature with which to capture the observed themes. In particular, the indicators of capacity were reorganized and tabulated into thematic categories, with their associated metrics of analysis.
Additionally, articles were critically appraised using the National Institute of Health’s respective Study Quality Assessment Tools for observational cohort and cross-sectional studies; before-after studies; and case-series studies (9). A complete representation of these tools are presented in Appendix C.
Collating, Summarizing, and Reporting Findings
Following the refinement of the data, the results were analyzed both qualitatively and quantitatively. Descriptive analysis resulted in the tabulation of indicators evaluated, metrics used, and the methodologies of data collection and/or sources of data used for secondary analysis. From these results, the frequencies of use of each indicator category was analyzed, their respective metrics of evaluation compiled, and the data collection methodologies and/or primary sources were inventoried. These were translated into charts for accessible reference and use by relevant persons and agencies.
Results
Figure 1 diagrams the review and selection process. The searches of PubMed, Web of Science, and Scopus produced 3,429 unique articles. Additionally, 1,363 articles were retrieved from Digital Commons, and the grey literature search produced 37 articles. Three more articles were identified from reference lists. In total, 4,833 were included for title and abstract screening. Of these, 153 were selected for full text review, and 31 were included in the final syntheses. One article of the final selection was hand-picked from references, one was from Digital
the stated research questions in order.
What examples exist of focused assessments of the capacity of the health care safety net, and what levels of the safety net are assessed?
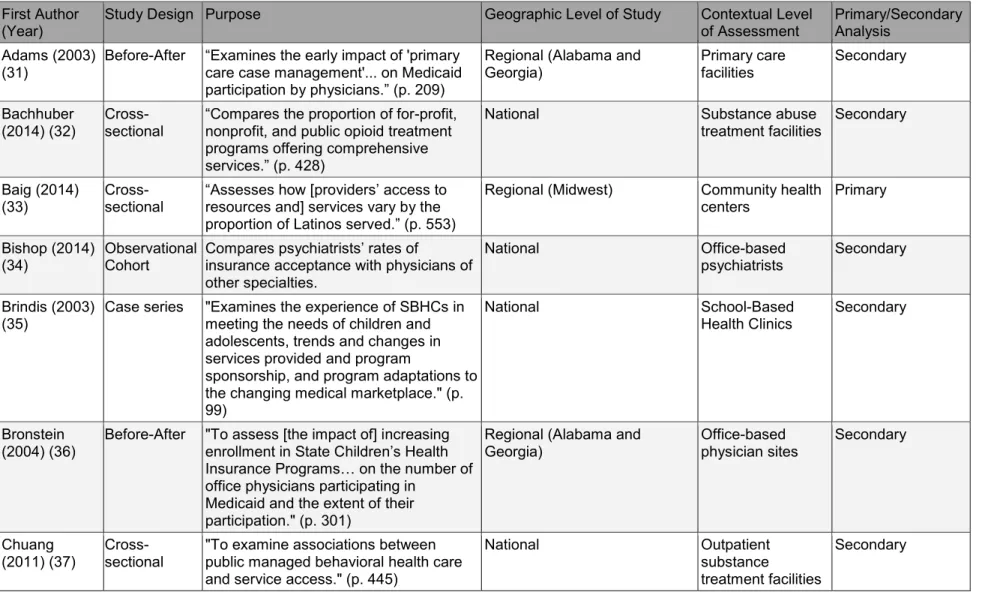
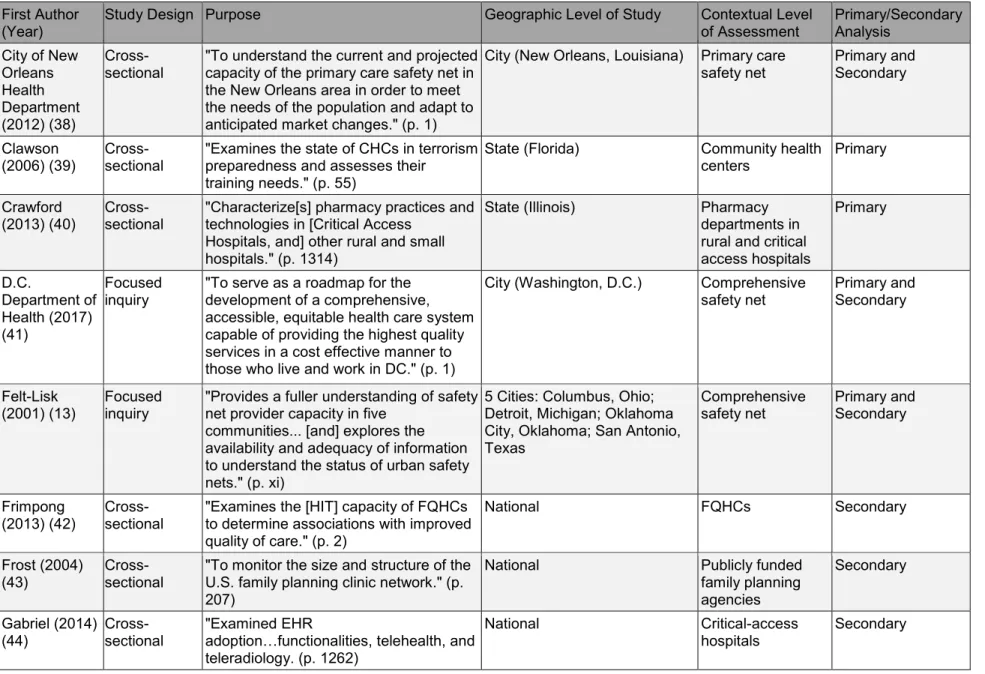
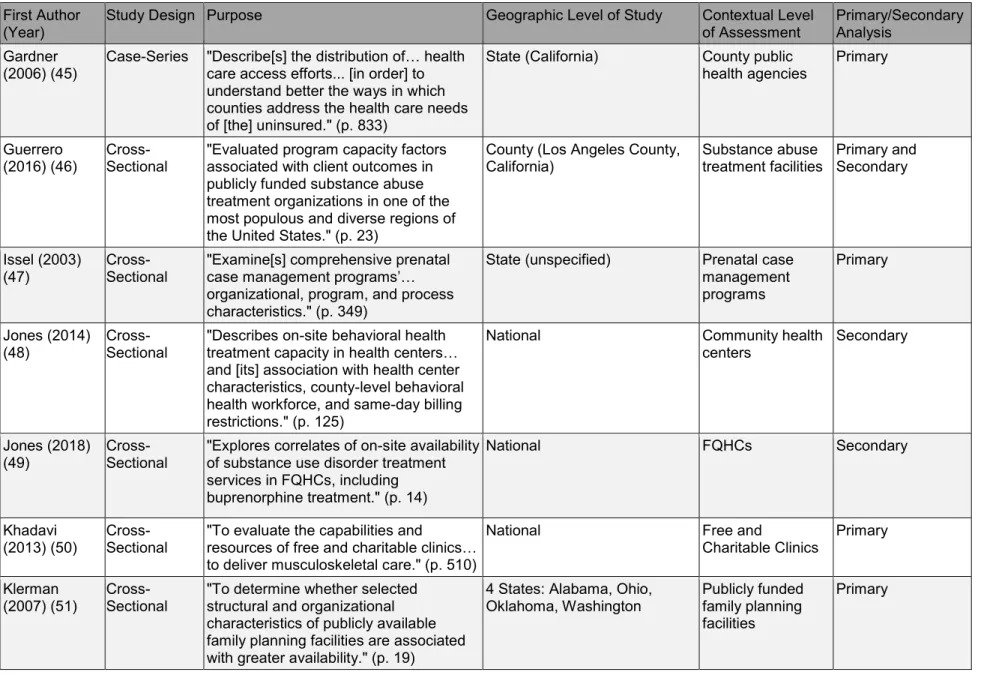
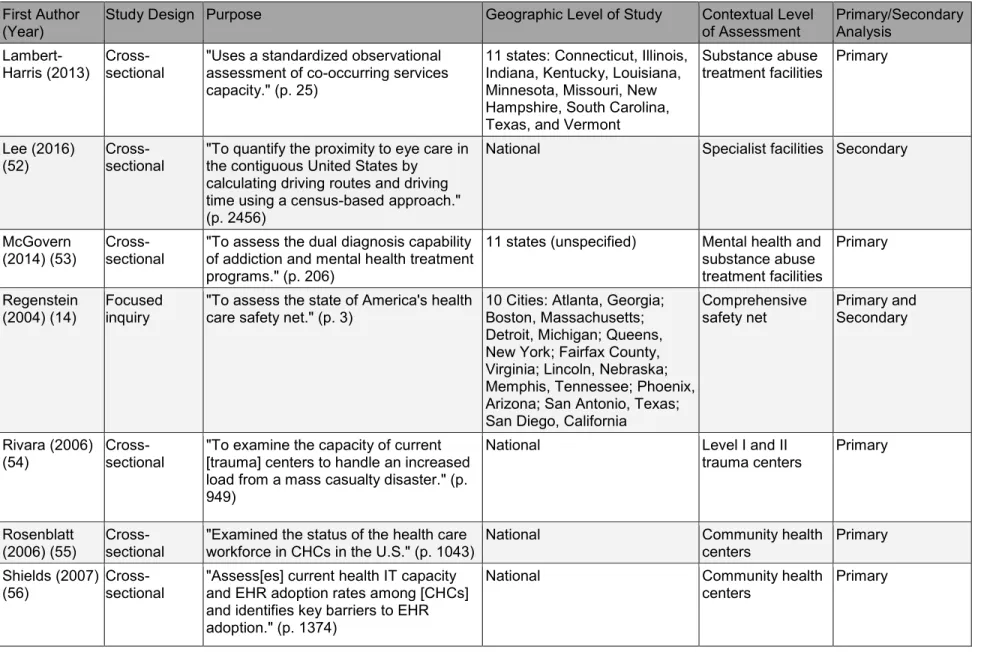
Table 1 presents a descriptive summary of the reviewed documents. For a more
complete representation of the data extracted for individual articles, refer to Appendix D. Of the 31 studies, three involved a comprehensive assessment of the safety net, all of which were found in the grey literature. Felt-Lisk, et al. (13) assessed the safety nets of five cities; the Department of Health in Washington, D.C. conducted a major assessment of its own safety net; Regenstein, et al., summarizes assessments of ten cities undertaken by Urgent Matters, a grant-funded initiative aimed at reducing Emergency Department overcrowding by improving safety net infrastructure. The remainder of the studies focused on a specific aspects of the safety net. These
included the primary care safety net, broadly defined (n = 3);
Community Health Centers (CHCs) (n = 5); Federally Qualified Health Centers
(FQHCs) (n = 2); free and charitable clinics (n = 1); county health departments (n = 1); school-based health centers (SBHCs) (n =
specialists (n = 3); substance abuse treatment facilities (n = 5); mental health treatment facilities (n = 1)‡‡; family planning facilities (n = 2); hospitals (n = 4)§§; and safety net facilities offering
prenatal case management services (n = 1). The studies vary in terms of geographical scope. The selected studies included assessments at the national (n = 14), regional (n = 3), state (n = 5), multi-state (n = 3), county (n = 1), city (n = 3), and multi-city level (n = 2).
‡‡ One study looks at both mental health treatment facilities and substance abuse treatment facilities.
Table 1. Descriptive summary of studies assessing safety net capacity. First Author
(Year) Study Design Purpose Geographic Level of Study Contextual Level of Assessment Primary/Secondary Analysis
Adams (2003)
(31) Before-After “Examines the early impact of 'primary care case management'... on Medicaid
participation by physicians.” (p. 209)
Regional (Alabama and
Georgia) Primary care facilities Secondary
Bachhuber (2014) (32)
Cross-sectional
“Compares the proportion of for-profit, nonprofit, and public opioid treatment programs offering comprehensive
services.” (p. 428)
National Substance abuse
treatment facilities
Secondary
Baig (2014)
(33) Cross-sectional “Assesses how [providers’ resources and] services vary by the access to
proportion of Latinos served.” (p. 553)
Regional (Midwest) Community health
centers Primary
Bishop (2014)
(34) Observational Cohort Compares psychiatrists’ rates of insurance acceptance with physicians of other specialties.
National Office-based
psychiatrists Secondary
Brindis (2003)
(35) Case series "Examines the experience of SBHCs in meeting the needs of children and adolescents, trends and changes in services provided and program
sponsorship, and program adaptations to the changing medical marketplace." (p. 99)
National School-Based
Health Clinics Secondary
Bronstein
(2004) (36) Before-After "To assess [the impact of] increasing enrollment in State Children’s Health Insurance Programs… on the number of
office physicians participating in Medicaid and the extent of their participation." (p. 301)
Regional (Alabama and
Georgia) Office-based physician sites Secondary
Chuang
(2011) (37) Cross-sectional "To examine associations between public managed behavioral health care and service access." (p. 445)
National Outpatient
substance
treatment facilities
Table 1. Descriptive summary of studies assessing safety net capacity. First Author
(Year) Study Design Purpose Geographic Level of Study Contextual Level of Assessment Primary/Secondary Analysis
City of New Orleans Health Department (2012) (38)
Cross-sectional "To understand the current and projected capacity of the primary care safety net in the New Orleans area in order to meet the needs of the population and adapt to anticipated market changes." (p. 1)
City (New Orleans, Louisiana) Primary care
safety net Primary and Secondary
Clawson
(2006) (39) Cross-sectional "Examines the state of CHCs in terrorism preparedness and assesses their training needs." (p. 55)
State (Florida) Community health
centers Primary
Crawford
(2013) (40) Cross-sectional "Characterize[s] pharmacy practices and technologies in [Critical Access Hospitals, and] other rural and small hospitals." (p. 1314)
State (Illinois) Pharmacy
departments in rural and critical access hospitals Primary D.C. Department of Health (2017) (41) Focused
inquiry "To serve as a roadmap for the development of a comprehensive, accessible, equitable health care system capable of providing the highest quality services in a cost effective manner to those who live and work in DC." (p. 1)
City (Washington, D.C.) Comprehensive
safety net Primary and Secondary
Felt-Lisk
(2001) (13) Focused inquiry "Provides a fuller understanding of safety net provider capacity in five communities... [and] explores the
availability and adequacy of information to understand the status of urban safety nets." (p. xi)
5 Cities: Columbus, Ohio; Detroit, Michigan; Oklahoma City, Oklahoma; San Antonio, Texas
Comprehensive
safety net Primary and Secondary
Frimpong
(2013) (42) Cross-sectional "Examines the [HIT] capacity of FQHCs to determine associations with improved quality of care." (p. 2)
National FQHCs Secondary
Frost (2004) (43)
Cross-sectional
"To monitor the size and structure of the U.S. family planning clinic network." (p. 207)
National Publicly funded
family planning agencies
Secondary
Gabriel (2014)
(44) Cross-sectional "Examined EHR adoption…functionalities, telehealth, and
teleradiology. (p. 1262)
National Critical-access
Table 1. Descriptive summary of studies assessing safety net capacity. First Author
(Year) Study Design Purpose Geographic Level of Study Contextual Level of Assessment Primary/Secondary Analysis
Gardner
(2006) (45) Case-Series "Describe[s] the distribution of… health care access efforts... [in order] to understand better the ways in which counties address the health care needs of [the] uninsured." (p. 833)
State (California) County public
health agencies Primary
Guerrero
(2016) (46) Cross-Sectional "Evaluated program capacity factors associated with client outcomes in publicly funded substance abuse treatment organizations in one of the most populous and diverse regions of the United States." (p. 23)
County (Los Angeles County,
California) Substance abuse treatment facilities Primary and Secondary
Issel (2003)
(47) Cross-Sectional "Examine[s] comprehensive prenatal case management programs’…
organizational, program, and process characteristics." (p. 349)
State (unspecified) Prenatal case
management programs
Primary
Jones (2014)
(48) Cross-Sectional "Describes on-site behavioral health treatment capacity in health centers…
and [its] association with health center characteristics, county-level behavioral health workforce, and same-day billing restrictions." (p. 125)
National Community health
centers Secondary
Jones (2018)
(49) Cross-Sectional "Explores correlates of on-site availability of substance use disorder treatment services in FQHCs, including
buprenorphine treatment." (p. 14)
National FQHCs Secondary
Khadavi
(2013) (50) Cross-Sectional "To evaluate the capabilities and resources of free and charitable clinics…
to deliver musculoskeletal care." (p. 510)
National Free and
Charitable Clinics Primary
Klerman (2007) (51)
Cross-Sectional
"To determine whether selected structural and organizational characteristics of publicly available family planning facilities are associated with greater availability." (p. 19)
4 States: Alabama, Ohio, Oklahoma, Washington
Publicly funded family planning facilities
Table 1. Descriptive summary of studies assessing safety net capacity. First Author
(Year) Study Design Purpose Geographic Level of Study Contextual Level of Assessment Primary/Secondary Analysis
Lambert-Harris (2013) Cross-sectional "Uses a standardized observational assessment of co-occurring services capacity." (p. 25)
11 states: Connecticut, Illinois, Indiana, Kentucky, Louisiana, Minnesota, Missouri, New Hampshire, South Carolina, Texas, and Vermont
Substance abuse
treatment facilities Primary
Lee (2016)
(52) Cross-sectional "To quantify the proximity to eye care in the contiguous United States by calculating driving routes and driving time using a census-based approach." (p. 2456)
National Specialist facilities Secondary
McGovern
(2014) (53) Cross-sectional "To assess the dual diagnosis capability of addiction and mental health treatment programs." (p. 206)
11 states (unspecified) Mental health and
substance abuse treatment facilities Primary Regenstein (2004) (14) Focused inquiry
"To assess the state of America's health care safety net." (p. 3)
10 Cities: Atlanta, Georgia; Boston, Massachusetts; Detroit, Michigan; Queens, New York; Fairfax County, Virginia; Lincoln, Nebraska; Memphis, Tennessee; Phoenix, Arizona; San Antonio, Texas; San Diego, California
Comprehensive safety net
Primary and Secondary
Rivara (2006)
(54) Cross-sectional "To examine the capacity of current [trauma] centers to handle an increased load from a mass casualty disaster." (p. 949)
National Level I and II
trauma centers Primary
Rosenblatt (2006) (55)
Cross-sectional
"Examined the status of the health care workforce in CHCs in the U.S." (p. 1043)
National Community health
centers
Primary
Shields (2007)
(56) Cross-sectional "Assess[es] current health IT capacity and EHR adoption rates among [CHCs] and identifies key barriers to EHR adoption." (p. 1374)
National Community health
Table 1. Descriptive summary of studies assessing safety net capacity. First Author
(Year) Study Design Purpose Geographic Level of Study Contextual Level of Assessment Primary/Secondary Analysis
Siegel (2009)
(57) Cross-sectional "To assess hospital crowding, capacity and patient flow…using the hospital
capacity assessment tool (HCAT)." (p. 714)
City (Washington, D.C.) Acute care
hospitals Primary
Tipirneni
(2016) (58) Cross-sectional "Examined primary care appointment availability and wait times for new Medicaid and privately insured patients before and after Medicaid expansion." (p. 427)
State (Michigan) Primary care
What indicators are evaluated, and by what metrics are they measured?
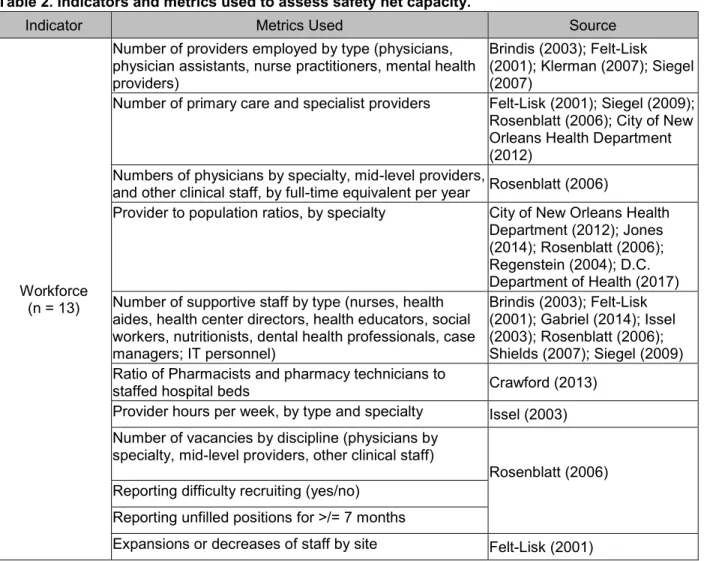
The indicators evaluated in the included studies were grouped into the following categories: Workforce, Infrastructure, Range of Services, Primary Care Availability, Specialist Availability, Enabling Services, Medicaid Participation and Indigent Care, Organizational Capacity, Health Information Technology (HIT) Capacity, Disaster Preparedness, Sentinel Events, and General Capacity. Figure 2 illustrates the frequencies by which the use of these indicator categories were observed in the reviewed studies. Table 2 provides an inventory of the metrics evaluated in the assessments of these respective indicators. The reader should note that these groupings are at times overlapping, as some metrics might reasonably be included in more than one category. Definitions and qualifications of these categories are described below.
Health Care Workforce was the most frequently assessed indicator (n = 13). In this category, only
assessments specific to health care personnel were included. Metrics in this category
included the absolute numbers of providers employed by type (e.g. physicians, mid-level providers) and specialty, as well as the absolute numbers of supportive staff (e.g. administrators, nurses, health aides, health educators, social workers, nutritionists, case Figure 2. Outcome map of indicator usage in safety net
managers, information technology [IT] personnel). The health care work force was also
measured in relative terms, such as by provider to population ratios, by specialty; or by ratios of providers to hospital beds. The work force was also measured in terms of hours of work such as by provider hours per week, by provider type and specialty. Conversely, “full time equivalents per year,” was calculated as the sum of the total hours worked by all providers over the course of a year divided by the number of hours considered to be full time by a given facility. Work Force was also assessed in terms of difficulty recruiting providers and health care staff. Measures of this included the numbers of vacancies by discipline, or administrator-reported difficulty recruiting providers or staff.
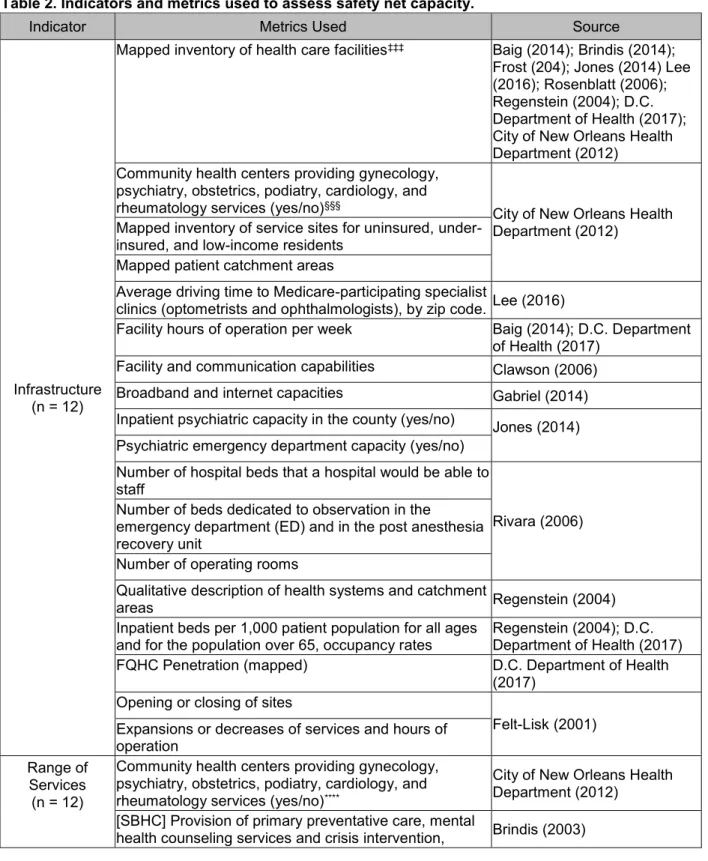
Infrastructural Capacity (n = 12) included assessments of physical resources and their availability. This was presented geographically, with mapped inventories of health care facilities, by type, services provided, and patient catchment areas. Conversely, it was also measured in terms of driving time. Resources were measured in terms of clinic exam rooms, hospital beds, or operating rooms. Changes in Infrastructural Capacity were measured in terms of site
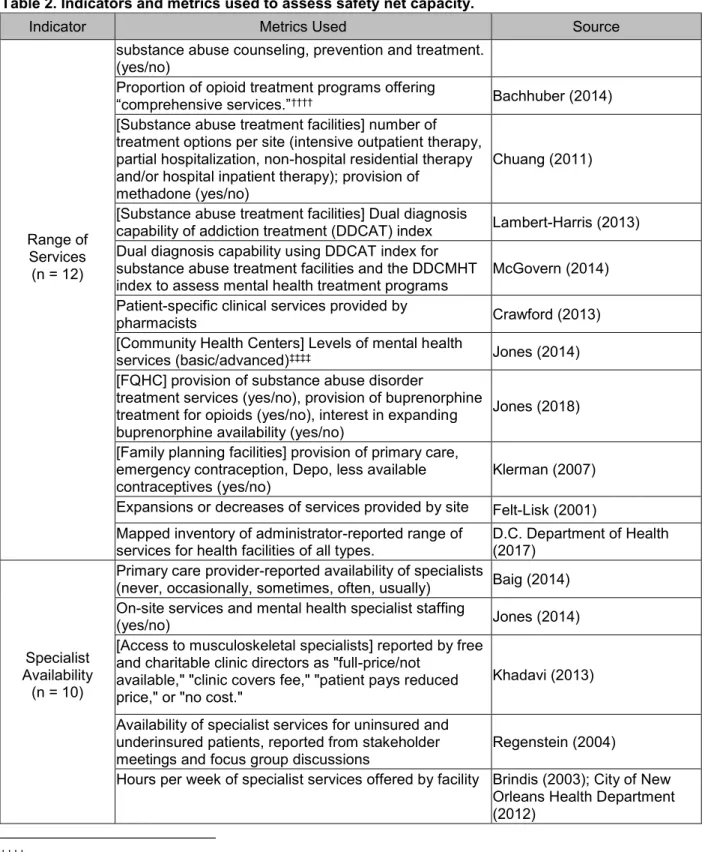
openings and closing over periods of time, and expansions or decreases in hours of operation. Range of Services included reports of the specific services provided by individual facilities. These included primary care, subspecialist, behavioral health and substance abuse services, and pharmacist services. Dual diagnostic capabilities of substance abuse and mental health treatment facilities was measured using the “Dual Diagnosis Capability in Addiction Treatment (DDCAT)” and “Dual Diagnosis Capability in Mental Health Treatment (DDCMHT)” indices, respectively, which are validated tools tailored for this specific purpose. These are intended to measure the capacity of these facilities to diagnose and manage both mental health and substance abuse disorders.
primary care providers was quantified. Availability was also gauged in terms of wait times for provider appointments, by week. Additionally, the availability of these services to uninsured and underinsured groups was reported qualitatively from stakeholder meetings and focus group discussions. This later metric was considered to be a measurement of both Availability and Medicaid Participation and Indigent Care.
Medicaid Participation and Indigent Care (n = 8) was the indicator category for
assessments of willingness or capability of providers and facilities to provide services to patients who receive public insurance benefits, are uninsured, or uninsured. Metrics assessing this indicator included the absolute numbers of facilities accepting Medicaid or uninsured patients within a community, the sizes of those facilities, the rates of acceptance of insurance by
providers or facilities, by payer type, and the site participation rate, calculated as the number of Medicaid-participating sites in a community divided by the total number of facilities within that community, by facility type.
HIT Capacity (n = 7) was the indicator category assessing health care facilities’ and organizations’ capabilities with regards to the use of electronic health records (EHR) and computer-based data systems, communication systems, and patient services (e.g. prescription ordering, patient-provider communications, and patient reminder systems). This was measured as reported usage and capabilities of these systems, defined in terms of discrete functionalities (e.g. computerized orders for prescriptions and tests, electronic lab results, maintains disease-specific registries). The Hospital Capacity Assessment Tool (HCAT) was a novel tool designed to comprehensively assess hospital capacity, which included a specific scale to grade hospital data collection and utilization capabilities. Additionally, HIT Capacity growth was measured in terms of facilities’ future plans for HIT Capacity expansions.
services like health educational programs, nutrition counseling, physical activity classes, cultural competency and language services, case management, behavior modification counseling, transportation or housing assistance, or programs to improve access and insurance coverage.
Organizational Capacity (n = 5) was a broad category that included assessments of health facilities’ and organizations’ capabilities to monitor and implement quality improvement efforts; assessments of management and efficiency; internal and external communications capabilities; and the extent of interagency connectedness within communities.
Sentinel events (n = 4) was an indicator of capacity adapted from Felt-Lisk et al. (13), which recognized that capacity as potential measure can be assessed by downstream metrics that suggest strains on capacity. These include instances that represent failures of system capacity to meet expressed demand. Metrics assessing this indicator include the use of EDs for non-urgent or “ambulatory-care sensitive (ACS)” conditions***, ED wait times, and the rate of ED
patients who leave without being seen. Regenstein et al. (14) used a specified “Emergency Department Use Profiling Algorithm” (59) that was developed and validated (60) to classify ED visits in terms of acuity and whether or not they would have been preventable or treatable with basic primary care. The D.C. Department of Health (41) measured the ACS admissions rate (percentage of ED visits that were for ACS conditions), and mapped them by patient zip code to demonstrate geographical areas were safety net capacity was most strained.
Assessments of Disaster Preparedness (n = 2) were found addressing two contexts: CHCs and Trauma Centers. The metrics assessing this category included whether or not facilities had implemented written disaster plans and policies, had trained their staff for disasters, and the infrastructural capacity of EDs and hospitals to manage large influxes of patients that might result from a natural or man-made disaster. This latter metric was measured
in terms of infrastructural capacity (ED and hospital beds, operating rooms, workforce, etc.) compared to the volume of patient encounters an hospitalizations on the previous July 4th-5th, as
this tends to be the busiest 24 hours of the year for these facilities.
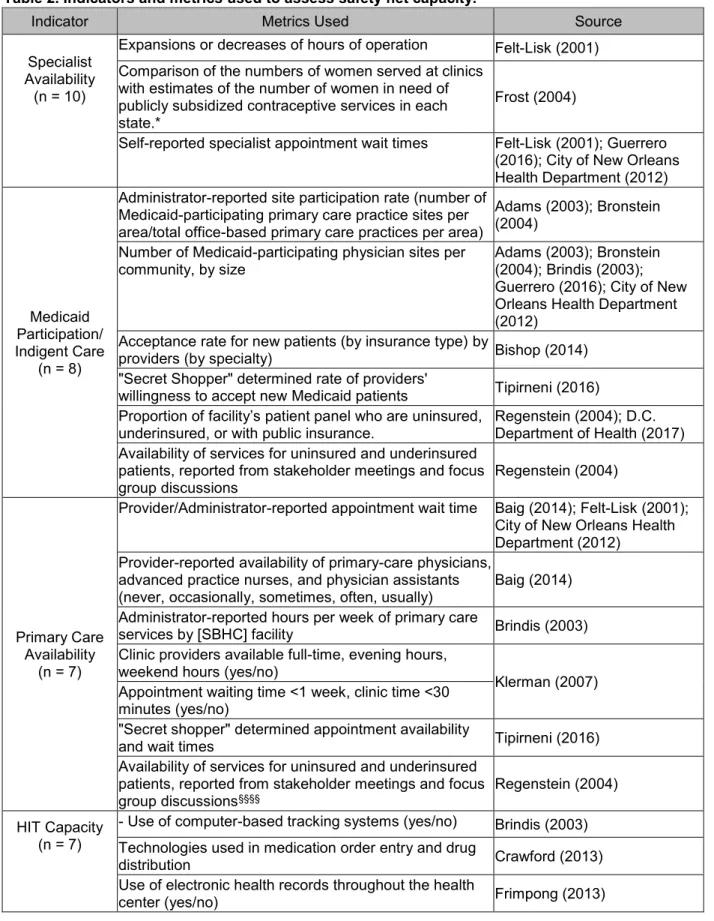
Finally, General Capacity (n = 1) was an indicator of overall perceptions by key informants of the capacity adequacy. It was measured in terms of provider and administrator reports of whether “capacity is adequate to meet demand,” whether there is excess capacity,††† and whether capacity is strained for specific services (asked as an open-ended question). Table 2. Indicators and metrics used to assess safety net capacity.
Indicator Metrics Used Source
Workforce (n = 13)
Number of providers employed by type (physicians, physician assistants, nurse practitioners, mental health providers)
Brindis (2003); Felt-Lisk (2001); Klerman (2007); Siegel (2007)
Number of primary care and specialist providers Felt-Lisk (2001); Siegel (2009);
Rosenblatt (2006); City of New Orleans Health Department (2012)
Numbers of physicians by specialty, mid-level providers,
and other clinical staff, by full-time equivalent per year Rosenblatt (2006)
Provider to population ratios, by specialty City of New Orleans Health
Department (2012); Jones (2014); Rosenblatt (2006); Regenstein (2004); D.C. Department of Health (2017) Number of supportive staff by type (nurses, health
aides, health center directors, health educators, social workers, nutritionists, dental health professionals, case managers; IT personnel)
Brindis (2003); Felt-Lisk (2001); Gabriel (2014); Issel (2003); Rosenblatt (2006); Shields (2007); Siegel (2009) Ratio of Pharmacists and pharmacy technicians to
staffed hospital beds Crawford (2013)
Provider hours per week, by type and specialty Issel (2003)
Number of vacancies by discipline (physicians by specialty, mid-level providers, other clinical staff)
Rosenblatt (2006) Reporting difficulty recruiting (yes/no)
Reporting unfilled positions for >/= 7 months
Expansions or decreases of staff by site Felt-Lisk (2001)
Table 2. Indicators and metrics used to assess safety net capacity.
Indicator Metrics Used Source
Infrastructure (n = 12)
Mapped inventory of health care facilities‡‡‡ Baig (2014); Brindis (2014);
Frost (204); Jones (2014) Lee (2016); Rosenblatt (2006); Regenstein (2004); D.C. Department of Health (2017); City of New Orleans Health Department (2012)
Community health centers providing gynecology, psychiatry, obstetrics, podiatry, cardiology, and
rheumatology services (yes/no)§§§
City of New Orleans Health Department (2012)
Mapped inventory of service sites for uninsured, under-insured, and low-income residents
Mapped patient catchment areas
Average driving time to Medicare-participating specialist
clinics (optometrists and ophthalmologists), by zip code. Lee (2016)
Facility hours of operation per week Baig (2014); D.C. Department
of Health (2017)
Facility and communication capabilities Clawson (2006)
Broadband and internet capacities Gabriel (2014)
Inpatient psychiatric capacity in the county (yes/no) Jones (2014)
Psychiatric emergency department capacity (yes/no) Number of hospital beds that a hospital would be able to staff
Rivara (2006) Number of beds dedicated to observation in the
emergency department (ED) and in the post anesthesia recovery unit
Number of operating rooms
Qualitative description of health systems and catchment
areas Regenstein (2004)
Inpatient beds per 1,000 patient population for all ages
and for the population over 65, occupancy rates Regenstein (2004); D.C. Department of Health (2017)
FQHC Penetration (mapped) D.C. Department of Health
(2017) Opening or closing of sites
Felt-Lisk (2001) Expansions or decreases of services and hours of
operation Range of
Services (n = 12)
Community health centers providing gynecology, psychiatry, obstetrics, podiatry, cardiology, and
rheumatology services (yes/no)****
City of New Orleans Health Department (2012)
[SBHC] Provision of primary preventative care, mental
health counseling services and crisis intervention, Brindis (2003)
‡‡‡
These included community health centers by type, hospitals, urgent care centers, family planning clinics,
behavioral health facilities, specialty care facilities, substance abuse treatment facilities, SBHSs, post-acute care facilities, hospital-based outpatient care facilities, diagnostic services, health insurance enrollment programs. §§§This metric was considered to apply to both Infrastructure and Range of Services.
Table 2. Indicators and metrics used to assess safety net capacity.
Indicator Metrics Used Source
Range of Services (n = 12)
substance abuse counseling, prevention and treatment. (yes/no)
Proportion of opioid treatment programs offering
“comprehensive services.”†††† Bachhuber (2014)
[Substance abuse treatment facilities] number of treatment options per site (intensive outpatient therapy, partial hospitalization, non-hospital residential therapy and/or hospital inpatient therapy); provision of
methadone (yes/no)
Chuang (2011)
[Substance abuse treatment facilities] Dual diagnosis
capability of addiction treatment (DDCAT) index Lambert-Harris (2013)
Dual diagnosis capability using DDCAT index for substance abuse treatment facilities and the DDCMHT
index to assess mental health treatment programs McGovern (2014)
Patient-specific clinical services provided by
pharmacists Crawford (2013)
[Community Health Centers] Levels of mental health
services (basic/advanced)‡‡‡‡ Jones (2014)
[FQHC] provision of substance abuse disorder
treatment services (yes/no), provision of buprenorphine treatment for opioids (yes/no), interest in expanding buprenorphine availability (yes/no)
Jones (2018)
[Family planning facilities] provision of primary care, emergency contraception, Depo, less available
contraceptives (yes/no) Klerman (2007)
Expansions or decreases of services provided by site Felt-Lisk (2001)
Mapped inventory of administrator-reported range of
services for health facilities of all types. D.C. Department of Health (2017)
Specialist Availability
(n = 10)
Primary care provider-reported availability of specialists
(never, occasionally, sometimes, often, usually) Baig (2014)
On-site services and mental health specialist staffing
(yes/no) Jones (2014)
[Access to musculoskeletal specialists] reported by free and charitable clinic directors as "full-price/not
available," "clinic covers fee," "patient pays reduced price," or "no cost."
Khadavi (2013)
Availability of specialist services for uninsured and underinsured patients, reported from stakeholder meetings and focus group discussions
Regenstein (2004)
Hours per week of specialist services offered by facility Brindis (2003); City of New Orleans Health Department (2012)
††††
“Comprehensive services” were defined as “communicable disease (HIV, sexually transmitted infections, and
viral hepatitis) testing, psychiatric services (screening, assessment and diagnostic evaluation, and pharmacotherapy), and social services support (assistance in applying for programs such as Medicaid)” (p. 428)Table 2. Indicators and metrics used to assess safety net capacity.
Indicator Metrics Used Source
Specialist Availability
(n = 10)
Expansions or decreases of hours of operation Felt-Lisk (2001)
Comparison of the numbers of women served at clinics with estimates of the number of women in need of publicly subsidized contraceptive services in each state.*
Frost (2004)
Self-reported specialist appointment wait times Felt-Lisk (2001); Guerrero
(2016); City of New Orleans Health Department (2012)
Medicaid Participation/ Indigent Care
(n = 8)
Administrator-reported site participation rate (number of Medicaid-participating primary care practice sites per area/total office-based primary care practices per area)
Adams (2003); Bronstein (2004)
Number of Medicaid-participating physician sites per
community, by size Adams (2003); Bronstein (2004); Brindis (2003);
Guerrero (2016); City of New Orleans Health Department (2012)
Acceptance rate for new patients (by insurance type) by
providers (by specialty) Bishop (2014)
"Secret Shopper" determined rate of providers'
willingness to accept new Medicaid patients Tipirneni (2016)
Proportion of facility’s patient panel who are uninsured, underinsured, or with public insurance.
Regenstein (2004); D.C. Department of Health (2017) Availability of services for uninsured and underinsured
patients, reported from stakeholder meetings and focus
group discussions Regenstein (2004)
Primary Care Availability
(n = 7)
Provider/Administrator-reported appointment wait time Baig (2014); Felt-Lisk (2001); City of New Orleans Health Department (2012)
Provider-reported availability of primary-care physicians, advanced practice nurses, and physician assistants (never, occasionally, sometimes, often, usually)
Baig (2014)
Administrator-reported hours per week of primary care
services by [SBHC] facility Brindis (2003)
Clinic providers available full-time, evening hours, weekend hours (yes/no)
Klerman (2007) Appointment waiting time <1 week, clinic time <30
minutes (yes/no)
"Secret shopper" determined appointment availability
and wait times Tipirneni (2016)
Availability of services for uninsured and underinsured patients, reported from stakeholder meetings and focus
group discussions§§§§
Regenstein (2004)
HIT Capacity (n = 7)
- Use of computer-based tracking systems (yes/no) Brindis (2003)
Technologies used in medication order entry and drug
distribution Crawford (2013)
Use of electronic health records throughout the health
center (yes/no) Frimpong (2013)
Table 2. Indicators and metrics used to assess safety net capacity.
Indicator Metrics Used Source
HIT Capacity (n = 7)
Computerized capabilities for 15 functions, grouped into 3 categories (yes/no): routine use of technology, for notes, medications, test, and clinical prompts; computerized process for patient registries; and computerized process for tracking test and reminder/alerts.
IT support for EHR implementation and technical
support (yes/no)***** Gabriel (2014)
Use of electronic medical records (yes, partially, no, don't know)
Shields (2007) Minimal EHR functionalities (Electronic patient
demographics, Computerized orders for prescriptions, Computerized orders for tests, Electronic lab results, Electronic clinical notes)
Additional IT capacities (Maintains one or more disease-specific registries, Maintains patient registries as part of
HRSA’s Health Disparities Collaborative)
Has plans for installing new EHR or replacing system within three years
HCAT Scale (Hospital data collection/utilization) Siegel (2009)
Administrator-reported capabilities of data systems Felt-Lisk (2001)
Enabling services (n = 6)
Provider-reported availability of diabetes educators, physical activity classes, nutrition counseling, group
counseling Baig (2014)
Provider-reported availability of language interpretation services (on-site and off-site interpreters, bi/multilingual staff, ancillary services available in multiple languages) Administrator-reported translation services, self-reported cultural competency, translated educational materials (yes/no)
Klerman (2007)
[SBHC] Case management, substance abuse counseling, learning problems and support, group counseling and peer support, grief counseling, classroom behavior modification, gang prevention programs (yes/no)
Brindis (2003)
Characteristics of prenatal case management programs Issel (2003) Assistance for transportation, housing, and child care
(yes/no) Chuang (2011); Klerman (2007)
County-wide inventory of programs designed to improve
access to care for the uninsured Gardner (2006)
Whether counties had implemented or was proposing to launch a variety of coverage and service expansions
(yes/no) Gardner (2006)
Organizational ‘‘Extent of interagency network’’††††† Clawson (2006); Issel (2003)
*****
This metric was considered to apply to both HIT Capacity and Workforce.
Table 2. Indicators and metrics used to assess safety net capacity.
Indicator Metrics Used Source
Capacity
(n = 5) Nine item scale assessing effective leadership
Guerrero (2016) Organizational readiness for change measured using
the TCU Organizational Readiness for Change Scale
(ORC-D4)‡‡‡‡‡
Key informant-reported management and efficiency Felt-Lisk (2001)
Key informant-reported difficulty in exchange of relevant and timely information between physicians and
institutions.
City of New Orleans Health Department (2012)
Sentinel Events (n = 4)
Patients left ED without being seen Siegel (2009)
Provider estimates of ED waiting times
Felt-Lisk (2001) ED use for non-urgent care
"Emergency department use profiling algorithm"§§§§§ to
analyze ED records and classify visits as "non-emergent, primary care treatable; "non-emergent, primary care treatable; emergent, preventable/avoidable; emergent, non-preventable/non-avoidable; or other visits not classified according to emergent or non-emergent status."
Regenstein (2004)
Ambulatory Care Sensitive Admissions rate (mapped percentage of ED visits and hospitalizations that were for ACS conditions, by zip code)
D.C. Department of Health (2017)
Disaster Preparedness
(n = 2)
Written disaster plan, policies, and agreements (yes/no)
Clawson (2006) Preparedness training (yes/no)
Infrastructural capacity compared to the number of ED visits and inpatient census during the previous July
4-5th. Rivara (2006)
General Capacity (n = 1)
Percent of providers reporting that "capacity is adequate to meet demand."
Felt-Lisk (2001) Percent of providers reporting that "excess capacity"
(whether they could see more patients with existing resources).
Percent of providers reporting strained capacity for specific services (primary care, dental, behavioral health, pharmacy).
‡‡‡‡‡
These tools can be found in the source document.
What methodologies are used to collect primary data, and what are the key sources of existing data used for secondary analysis?
Of the 31 reports included in this study, 61% (n = 19) collected primary data, 55% (n = 17) used secondary data from various sources, and 16% (n = 5) used both primary and secondary data for the assessment of safety net capacity. The report that follows will first address the methods used for primary data collection (Table 3), followed by a review of the sources identified for secondary analysis (Table 4).
Surveys were the most frequently used strategies for primary data collection (n = 15). Surveys of providers, staff, administrators, or executive officers were administered via mail, email, by phone, or written during site visits or interviews. They were used to address a range of topics related to all 12 described indicator categories, including workplace characteristics, resources, staffing and recruitment patterns, accessibility of care for patients, infrastructure, preparedness, and technology capacity.
Key informant interviews (n = 7) included interviews with knowledgeable personnel including county health officials, hospital CEOs and CFOs, and health department directors, providers, representatives from advocacy groups, consumers, and other community leaders that could offer an overall view of the safety net. These strategies were employed to obtain
information on topics similar to those of surveys. Additionally, they provided more descriptive and qualitative information on the care provided to safety net groups, efficiency, management and staffing, root causes of access barriers and health-system related issues, and general health system needs and resources. They were also used to identify planned or ongoing initiatives to expand health system capacity, and to confirm or refine information collected by other means. Site visits (n = 8) also provided investigators with similar information, as well as more detailed information regarding structure and financing of facilities, organizations, and health systems.
systems and facilities, government agencies, community members, and other non-provider institutions with vested interests in their communities’ health care safety net. These provided information that incorporated input from both the health care side and the community regarding needs, resources, health system structures and finances, access and barriers to care, priorities, and availability.
A “secret shopper” simulated patient methodology was employed by one study (58), in which a scripted caller requested sham appointments from health care facilities, randomizing their insurance status to validate provider-reported acceptance rates of Medicaid and private insurance, and determine appointment wait times.
Several specific assessment tools were identified for the collection of primary data. The HCAT, developed and employed by Siegel et al. (57), incorporated interviews and written surveys of hospital CEOs, quality improvement directors, and ED administrators to specifically assess hospital capacity by a number of metrics.
The DDCAT and DDCMHT(61,62), assess the capacity of substance abuse and mental health treatment facilities, respectively, to diagnose and manage both mental health and substance abuse disorders. These tools incorporated surveys of program directors and clinical staff, site visits, and structured interviews of clinic staff to obtain relevant information.
Siegel et al. (57) developed a comprehensive survey assessing HIT capacity at the community level drawing from existing national surveys that include the National Ambulatory Medical Care Survey (NAMCS) (63), The Medical Group Management Association (MGMA) Center for Research Survey of Health IT (64), and The Community Clinics Initiative (CCI) (65).
Table 3. Primary data collection strategies for assessing capacity.
Methodology Topics of Assessment Sources
Survey****** (n = 15)
- Workplace characteristics and
resources
- Organizational and program
characteristics
- Staffing and workforce
characteristics
- Recruitment patterns and challenges
- Accessibility of specialist care for
clinic patients
- Availability and scope of services
- Terrorism readiness and
preparedness needs
- Trauma center capacity
- Technology capability and use
- Inventory of enabling programs
Baig (2014); Clawson (2006); Crawford (2013); D.C. Department of Health (2017); Gardner (2006); Guerrero (2016); Issel (2003); Khadavi (2013); Klerman (2007); Lambert-Harris (2013); McGovern (2014); Rivara (2006); Rosenblatt (2006); Shields (2007); Siegel (2009)
Key Informant Interviews††††††
(n = 7)
- To characterize the range and scope
of regional safety net services
- Identification of safety net providers
and facilities
- Descriptions of care provided to
safety net groups
- Emergency department capacity and
status
- Financial information of facilities
- Information on the efficiency,
management, staffing, and information systems of safety net organizations.
- Identify initiatives related to health system capacity
- Root causes of access barriers,
no-show rates, limited acceptance of Medicaid-insured patients by private providers, and related health system issues.
- Confirmation and refinement of
quantitative data findings
- General health systems resources
and needs
- Key needs and priorities of safety net
providers
City of New Orleans Health Department (2012); D.C. Department of Health (2017); Felt-Lisk (2001); Gardener (2006);
Lambert-Harris (2013); McGovern (2014); Siegel (2009)
Site Visits (n = 8)
- Descriptions of care provided to
safety net groups
- Availability of Services for safety net
populations
- Emergency department use and
City of New Orleans Health Department (2012); D.C. Department of Health (2017); Felt-Lisk (2001); Guerrero (2016);
Lambert-Harris (2013); McGovern (2014); Regenstein (2004); Siegel (2009)
******These include surveys of county health officials, health facility administrators, clinical directors, executive officers, providers, and other supportive staff.
Table 3. Primary data collection strategies for assessing capacity.
Methodology Topics of Assessment Sources
capacity
- Structure and financing
- Information on the efficiency,
resources, management, staffing, and information systems of safety net organizations.
- Key needs and priorities of safety net
providers
Stakeholder/Focus Group Discussions (n = 3)
- Structure and financing of the safety
net
- Availability of Services
- Emergency department usage and
capacity
- Needs and priorities of the
community members and safety net providers
- General health systems resources
and needs
City of New Orleans Health Department (2012)
Felt-Lisk (2001); Regenstein (2004)
"Secret Shopper" - Simulated patient to validate reported willingness of providers to accept new Medicaid patients
Tipirneni (2016)
Specific Assessment Tools
Hospital Capacity Assessment Tool (HCAT) ‡‡‡‡‡‡
- Health system capacity
- ED utilization
- Availability of specialized services
- Quality improvement activities
- To help to identify the root causes of
hospital crowding across a region.
Siegel (2009)
DDCAT Index§§§§§§
- Dual diagnostic capabilities of
substance abuse treatment facilities
- Program structure
- Program milieu
- Assessment of practices, treatment
practices, continuity of care, staffing, and training.
Lambert-Harris (2013); McGovern (2014)
DDCMHT Index*******
- Dual diagnostic capabilities of mental
health facilities
- Program structure
- Program milieu
- Assessment of practices, treatment
practices, continuity of care, staffing,
McGovern (2014)
‡‡‡‡‡‡
The HCAT includes interviews and written surveys of hospital CEOs, quality improvement directors, and ED
administrators.§§§§§§
The Dual Diagnosis Capability in Addiction Treatment (DDCAT) Index includes surveys of program directors
and clinical staff, site visits, and structured interviews of clinic staff.Table 3. Primary data collection strategies for assessing capacity.
Methodology Topics of Assessment Sources
and training.
Health HIT Capacity Survey adapted
from elements of the NAMCS†††††††
survey, MGMA Survey of Health IT,‡‡‡‡‡‡‡ and the CCI survey
instruments§§§§§§§
- Rates of EHR adoption,
functionalities, and use
- Barriers to health IT adoption
- Health IT staffing patterns
Shields (2007)
Twenty-six data sources were extracted from the studies that were used for secondary analysis. The most frequently used sources of data include the HRSA’s Uniform Data System (UDS) (n = 6), Medicaid/Medicare claims data (n =4), direct requests for facility administrative data (n = 4), and the American Medical Associations’ (AMA) Masterfile (n = 3). These, and the other identified sources are inventoried below in Table 4, with descriptions of the information extracted for the studies’ purposes.
The UDS (68) collects information from federally funded CHCs nation-wide. The data extracted from the UDS in the articles reviewed pertained to staffing, patient volume and
characteristics, financial information, payer mix, and clinical quality and performance measures. Medicaid or Medicare claims data, available through the U.S. Centers for Medicare & Medicaid Services (CMS) (69), was used to find information regarding the numbers of physician sites providing care to Medicaid or Medicare-covered individuals, the number of visits by
patients on Medicaid, by facility, and detailed information on Medicaid payments to facilities. Investigators requested administrative data directly from health care facilities to determine service information, geographical distribution of patient populations, information on ED usage, uncompensated and charity care, payer mix, infrastructural capacity, wait times and
†††††††
The National Ambulatory Medical Care Survey (NAMCS)
financial information.
The AMA Masterfile (70) provides data on the physician workforce, and was used in these studies to extract data on the counts of primary care physicians and specialists at the zip-code level.
Table 4. Sources of data for secondary analysis to assess safety net capacity.
Source Information extracted Sources
AMA Masterfile Counts of primary care physicians (internists,
pediatricians, general, family practice, and obstetricians/gynecologists) at the zip-code level.
Adams (2003); Bronstein (2004); City of New Orleans Health Department (2012) American Community
Survey Information on the low-income patient population by zip code. City of New Orleans Health Department (2012) Commonwealth Fund
National Survey of Federally Qualified Health Centers
Organizational level measures, including access to care, coordination of care across settings,
engagement in quality improvement and reporting, HIT adoption, and the ability to serve as patient-centered medical homes.
Frimpong (2013)
The Community Clinics Initiative (CCI)
[California-specific]
HIT capacity, including EHRs, patient registries, practice management systems, networks and connectivity, hardware, software, and staffing
Shields (2007)
County Health Rankings Provider-to-patient ratios by specialty City of New Orleans
Health Department (2012) D.C Department of
Behavioral Health [D.C.-specific]
Capacity and other health-related data is compiled
from DC’s Department of Behavioral Health. D.C. Department of Health (2017)
D.C. Hospital Association and the D.C. Home Health Association [D.C.-specific]
Data detailing infrastructural capacity of Hospitals and Home Health facilities in D.C. (e.g., hospital beds, long-term care beds, nursing home beds, and assisted living slots, etc.)
D.C. Department of Health (2017)
Direct requests for administrative data
- Service information from a variety of facilities
- Geographical information on hospital patient
populations
- Information on ED usage for Ambulatory Care
Sensitive conditions
- Records on uncompensated and charity care,
infrastructural capacity, ED wait times and financial information
D.C. Department of Health (2017); Felt-Lisk (2001); Frost (2004); Regenstein (2004)
Health Information Management Systems Society (HIMSS) Survey
Information on EHR implementation and capabilities (broadband and Internet infrastructure, current and planned health IT capabilities, health IT support, challenges associated with EHR implementation, and participation in federal assistance programs)
Gabriel (2014)
HRSA Area Resource
File - Data on hospitals (range of services) per 100,000 population
- Information on county-level capacity and
utilization of health services