ORIGINAL ARTICLE
Lease Characteristics, Agency Costs, and Tax Considerations
Kun-chih Chen1, Wuchun Chi2, Gerald Lobo3, Kevin Ow Yong41 National Taiwan Universit, Roosevelt Rd., Taipei City 106, Taiwan, [email protected] 2 Department of Accounting, National Chengchi University, Taipei, Taiwan, [email protected] 3 University of Houston, C.T. Bauer College of Business, Houston, TX 77204-6021, [email protected] 4 Peking University, HSBC Business School, Xili, Shenzhen, China,518055, [email protected]
Abstract: We examine the determinants that influence managers’ decision as to whether a lease is structured as a
financing lease or an operating lease. Specifically, we find that firms with higher marginal tax rates, lower credit ratings, and more severe agency problems are more likely to use both operating leases and financing leases. However, tax considerations and debt capacity have little effect on which of the two types of lease is chosen. More importantly, we find that differences in kinds of agency problemsare reflected in the choice of the type of lease. Our study provides a better understanding of the extent of risks and benefits associated with the use of leased assetsand contributes to the discussion of impending revisions to lease accounting rules by standatd-setting bodies.
Keywords: Lease accounting, taxes, agency costs
1. Introduction
Prior research has focused on the lease decision as a lease-versus-buy decision (e.g., Beatty et al. 2010[1]), and has thus
left unstudied the implications of differences in economic factors for a firm’s decision whether to structure a lease contract as an operating lease ora financing lease.We examine whether economic differences between operating leases and financing leases influence thechoice between these two types of lease arrangements. More specifically, we examine the implications oftax concerns, debt, and agency costsonthechoice of lease structure.
There are conflicting motivations for structuring a lease as an operating lease versus as a financing lease. First, from a financing standpoint, financing leaseshave economic characteristics that fall between operating leases and debt. When compared with debt, financing leases maybe cheaper or easier to obtain because of the ease with which the lessor can repossessthe leased asset should the lesseeface bankruptcy. Second, from a tax perspective,firms have anincentive to structure leases as financing leasesrather than as operating leases because they cantake advantage of the tax savings from deductible interest expenses. By contrast, from a financial reporting perspective, firms have an incentive to structure leases as operating leases instead of as financing leasesin order to keep these obligations off the balance sheet and thus reduce the appearance of risk. However, to structure a lease as a financing lease imposes less flexibility on the lessee.
Conventional wisdom suggests that leases are structured primarily as operating leases (as opposed to financing leases) because managers are keen to avoid reporting debt on the balance sheet (e.g., AAA FASC 2011[2]).
Hence,existing accounting rules that permit leases to be classified as either operating or financing leases are subject to
Copyright © 2018 Kun-chih Chenet al.
doi: 10.18686/fm.v3i1.1061
This is an open-access article distributed under the terms of the Creative Commons Attribution Unported License
(http://creativecommons.org/licenses/by-nc/4.0/), which permits unrestricted use, distribution, and reproduction in any medium, provided the original work is properly cited.
significant criticism because firms can structure lease contracts to achieve certain desired accounting outcomes (e.g., Reither 1998[3]). For example, a 2005 report by the US Securities and Exchange Commission (SEC) showed that US
public firms hold as much as $1.25 trillion in operating lease commitments that do not appear on balance sheets.
Revision of lease accounting rules is a prominent issue on standard-setters’ agendas. In recent years, the US Financial Accounting Standards Board (FASB) and the International Accounting Standards Board (IASB)have jointly proposed a change to existing lease accounting rules. The proposed change seeks to eliminate the requirement for lessees to classify their leases either as financing leases or operating leases (ED/2013/6[4]). The proposed exposure draft
uses a “right-of-use” approach such that the corresponding assets and liabilities arising from almost all lease contracts are recognized in the financial statements. Specifically, the “right-of-use” approach aims to achieve consistent and comparable financial reporting when accounting for leases. Standard-setters also believe that this approach will eliminate some of the major weaknesses of existing lease accounting rules and reduce substantial misclassification of some lease contracts.
Prior lease accounting research has examined whether investors are able to understand the economic implications of off-balance sheet operating leases when assessing the firm’s risk (e.g., Imhoff, Lipe and Wright 1991[5]; Ely 1995[6];
Ge, Imhoff and Lee 2008[7]). This stream of research provides evidence regarding how investors perceive the economic
implications of operating leases versus financing leases. In contrast to this stream of research, we provide evidence of the economic determinants of firms’ decision to structure a lease as an operating lease versus a financing lease. This research question is important because recent empirical studies on lease classification suggest that investors are able to correctly assess the economic implications of the use of operating leases as financing vehicles that do not appear on balance sheets (e.g., Dhaliwal, Lee and Neamtiu 2011[8]; Bratten, Choudhary and Schipper 2013[9]). Hence, it is not
clear that managers are motivated to structure leases as operating leases solely to hide debt from the balance sheet. We conjecture that there are other economic determinants besides accounting classification that drive the decision to structure a lease contract as an operating lease or as a financing lease. Specifically, we examine whether firms with a higher tax rate are more likely to have financing leases than operating leases due to the differenttax benefits arising from the different lease structures. We also examine whether financially constrained firms prefer financing or operating leases. Lastly, we investigatewhether firms with higher agency costswill structure more of their leases as operating or as financing leases.
We use two proxies based on financial statements, drawn from prior lease accounting research, to measure the firm’s propensity to lease. The first measure is a balance sheet measure of the extent of capitalized operating leases (e.g., Dhaliwal et al. 2011[8]; Bratten et al. 2013[9]). Consistent with prior studies, we capitalize a firm’s operating leases using
their rental expenses over the next five years, as provided in the firm’s lease footnote disclosure. The second measure is an income statement measure of the propensity to lease. We construct this measure using a firm’s operating lease expenses divided by total capital costs, defined as the sum of operating lease payments, depreciation expenses, and the opportunity cost of net plant, property and equipment (PPE) (Eisfeldt and Rampini 2009[10]).
Based on our balance sheet measure, we find that firms use fewer operating leases and fewer financing leases when their marginal tax rate is higher. We also find that financially constrained firms are more likely to structure leases as operating leases. Additionally, we find that firms with higher agency costs have a higher proportion of operating leases. These results hold when the extent of a firm’s agency costs is measured through cash holdings, dividend policy, and over investment. However, we do not observea positive association between financial reporting quality and a firm’s propensity to use operating leases.
We find mixed results based on our income statement based lease measure. Firms with a high tax rate, low credit ratings, and low cash holdings tend to have more operating leases. On the other hand, the opposite result holds for
financing leases. Finally, we reconstruct our lease measure using the firm’s relative propensity to use operating leases versus financing leases. Based on this relative lease measure, we find that the marginal tax rate and credit ratings have little effect on the choice of financing leases versus operating leases. Second, the decision to structure a lease contract as a financing lease or as an operating lease is affected by different aspects of the agency problem. Compared with financing leases, firms with lower financial reporting quality and higher capital expenditure are more likely to use operating leases, while firms that pay no dividends and hold more cash are less likely to use operating leases.
We contribute to the existing literature by documenting how economic differences arising from lease characteristics influence firms’ choice of type of lease. We also believe our study will be of interest to regulators and standard setters because our findings provide some insights into the different factors that influence the structuring of leases as either operating or financing leases. Thus, our study provides a better understanding of the extent of risks and benefits associated with the use of leased assets.
The remainder of the paper proceeds as follows. Section 2 develops the hypotheses. Section 3 describes our data and measurement of variables. Section 4 presents the main results and other additional analyses. Section 5 concludes.
2. Literature Review and Hypotheses Development
2.1 Lease Accounting
Leases are classified as either operating leases or financing leases under existing accounting rules specified in SFAS 13 or IAS 17. Specifically, current lease accounting standards classify lease transactions as either financing leases or operating leases depending on whether the risks and rewards incident to ownership of the leased assets have been substantially transferred to the lessee. However, existing lease accounting rules are subject to criticism because it is unclear to what extent managers will structure lease contract arrangements to achieve certain desired accounting outcomes. Hence, existing accounting rules might lead to substantial misclassification for some lease contracts. For example, lease contracts that are viewed as financing leases in-substance by investors might be classified as operating leases in the financial statements.
Revision of lease accounting rules is a prominent issue on standard setters’ agenda. In that regard, the US Financial Accounting Standards Board (FASB) and the International Accounting Standards Board (IASB) have jointly proposed a change to existing lease accounting rules. The proposed change seeks to eliminate the requirement for lessees to classify their leases either as financing leases or as operating leases (ED/2013/6[4]). The proposed exposure draft uses a
“right-of-use” approach such that the corresponding assets and liabilities arising from almost all lease contracts are recognized in the financial statements. Specifically, the “right-of-use” approach aims to achieve consistent and comparable financial reporting when accounting for leases. It may also eliminate some of the major weaknesses of existing lease accounting rules (e.g., AAA FASC 2011[2]).
2.2 Hypothesis Development
The focus of our study is on how tax concerns, debt, and agency costs play a role infirms’ decision to structure a lease arrangement as an operating lease or as a financing lease. Compared with the perceived implications when a lease contract is classified either as an operating lease or a financing lease in the financial statements, extant research does not examine the determinants that influence the decision to structure a lease as an operating lease versus a financing lease.
Prior research has examined whether tax concerns drive managers toward the lease versus buy decision. Specifically, Graham et al. (1998)[11]find that high tax rate firms are less likely to take on more leases than debt because
they save more tax when they take on debt and incur tax deductible interest expense. In contrast, low tax rate firms are more likely to take on leases than debt because they save less tax when they take on more debt. What remains unclear is
whether other determinants impact the decision to structure a lease contract as an operating lease versus a financing lease.
We extend this stream of research by examining whether differences in the tax benefits between financing leases and operating leases drive the lease structuring decision. The effect of tax on financing leases is not obvious because financing leases are considered as debt on the balance sheet (i.e., they generates tax-deductible interest expense). Hence, we examine whether firms with a higher tax rate are more likely to have financing leases than operating leases due to the differing tax benefits arising from the structure of the lease arrangement. Our first hypothesis, in null form, is as follows.
H1:Tax considerations do not influence the choice of operating lease versus financing lease.
Prior research find sevidence suggesting that firms with little debt capacity prefer to lease rather than to initiate asset acquisitions (e.g., Sharpe and Nguyen 1995[12]; Eisfeldt and Rampini 2009[10]). The ability of the lessor to
repossess an asset is viewed as a major benefit of leasing.Hence, this ability to repossess allows a lessor to extend more credit than that the lender would be willing to base on secured lending. For example, the US bankruptcy code distinguishes leasing from secured lending. Specifically, it is easier for a lessor to repossess the leased asset than for a secured lender to repossess the collateral. Consequently, this feature makes leasing more valuable to financially constrained firms (Eisfeldt and Rampini 2009[10]).
We therefore expect that firms with less debt capacity or closer to bankruptcy are more likely to take on more leases. However, the effect of debt capacity on operating lease versus financing lease is less clear. On the one hand, it is possible that the lessor may not want to provide long term leases(as financing leases) because of perceived credit risk. Alternatively, the lessee may not have sufficient liquidity or solvency to assure the lessor that the firm is able to sustain an extended stream of long-term rental payments. On the other hand, it is also possible that financially constrained firms may prefer financing leases because they areviewed as more cost-effective than operating leases. Thus, we express our second hypothesis, in null form, as follows.
H2: Financially constrained firms and financially unconstrained firms do not differ in their choice of operating lease versus financing lease.
Initiating a lease contract involves a separation of ownership and control, which is costly to both parties due to the cost of agency problems (Alchian and Demsetz 1972[13], Eisfeldt and Rampini 2009[10]). We examine whether agency
costsinfluence the choice betweenoperating leasesand financing leases. For example, Beatty et al. (2010)[1] find that
firms with higher information asymmetry and thus more severe agency problems are more likely to lease rather than to purchase new assets. However, the authors do not examine between whether the leases are structured as operating or financing leases.
On the one hand, the longer time period imposed on the lessee in a financing lease might mitigate concerns that the lessee will subject the asset to excessive wear and tear. On the other hand, managers of firms with higher agency costs might be inclined to structure their lease contracts as operating leases to take these obligations off-balance sheet. We express our third and final hypothesis, as follows.
H3:Firms with high and low levels of agency costs do not differ in their choice of operating lease versus financing lease.
2.3 Data, Measures, and Descriptive Statistics
Financial reporting data used in this study are taken from COMPUSTAT. Our empirical analysis spans the fiscal years 1974 to 2010. It begins in 1974 because this is the first year when data for both operating leases and financing leases are available. We obtain credit ratings data from S&P (through WRDS), and marginal tax rate data from Professor John
Graham. Both credit ratings and marginal tax rate are crucial variables for our tests; however, due to data limitations, the inclusion of these two variables greatly decreases our sample size.
Following extant research, we use two measures to estimate the firm’s propensity to use different kinds of leases.These measures capture different aspects of the propensity to lease and are based on different assumptions. The first measure of the propensity to lease is a balance sheet based measure. From the balance sheet perspective, the propensity to lease can be measured as the capitalized lease amount divided by total assets or market value (e.g., Graham et al. 1998[11], Dhaliwal et al. 2011[8], Bratten et al. 2013[9]). In this paper, we follow prior studies and capitalize
operating leases at a 10% annual rate,using the firm’s five year rental expenses disclosed in its lease footnote.The second measure of the propensity to lease is an income statement based measure. From the income statement perspective, the propensity to lease can be measured as lease expenses divided by total capital costs (Sharpe and Nguyen 1995[12], Eisfeldt and Rampini 2009[10]), where total capital costs is defined as the sum of rental payments,
depreciation expense, and opportunity cost of net PPE (Sharpe and Nguyen 1995[12]). The “as if” lease expense for
financing leases is then calculated as total capital costs less rental payment and times the proportion of capital lease obligation out of total assets.
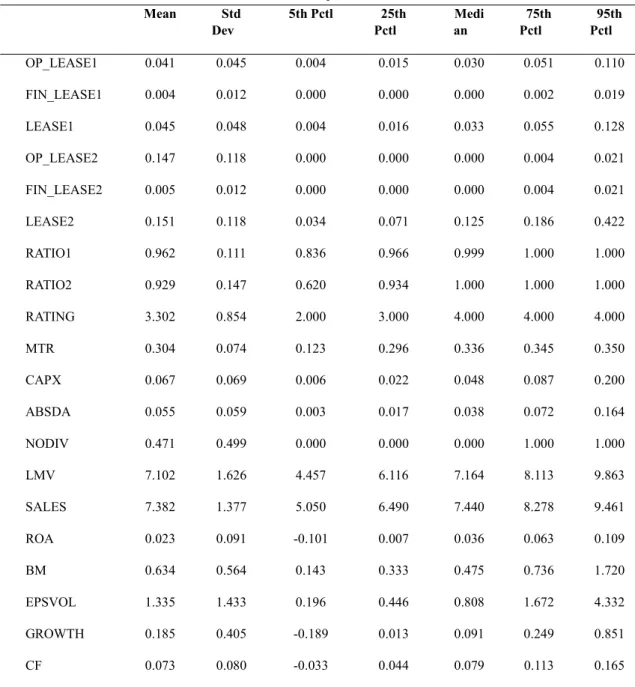
Table 1 reports the descriptive statistics of our sample. The mean operating leases (financing leases) on the balance sheet is 4.1 percent (0.4 percent). The mean operating lease expenses (finance lease expenses) as a proportion of total capital costs is 14.7 percent (0.5 percent). The mean operating leases as a proportion of total leases is 96.2 percent and the mean operating lease expenses as a proportion of total capital expenses is 92.9 percent.
Regarding our other variables, we find that the mean marginal tax rate is 30.4 percent. The firm’s mean credit rating is 3.302. The mean proportion of the firm capital expenditure to total assets amount to 6.7 percent. The mean absolute discretionary accruals is 5.5 percent. The average ROA is 2.3 percent and the firm’s mean book-to-market ratio is 0.634. The average sales growth is 18.5 percent. Finally, the mean firm’s cash flow is 7.3 percent to total assets.
Table 2 reports the correlation matrix of the various lease variables that we use in our empirical analyses. We report these correlations to ascertain the construct validity of our various lease variables. As expected, OP_LEASE1 is positively correlated with OP_LEASE2. The Pearson (Spearman) correlation coefficient is 0.653 (0.755), statistically significant at 0.01 level. Likewise, FIN_LEASE1 is positively correlated with FIN_LEASE2. The Pearson (Spearman) correlation coefficient is 0.995 (0.999), statistically significant at 0.01 level. Finally, we find that operating leases are positively correlated with finance leases on the balance sheet. The Pearson (Spearman) correlation coefficient is 0.159 (0.137), statistically significant at 0.01 level. On the other hand, we find that operating lease expenses are only weakly correlated with financing lease expenses. The Pearson (Spearman) correlation coefficient is 0.011 (0.033).
In order to observethe time trend in the lease decision, we plot two graphs based on the monetary value of leases and the proportion of firms using financing leases (dclo >0) in the COMPUSTAT universe over the last 40 years. We observe a steady increase in the magnitude of both operating leases and financing leases. The difference is quite small in 1978 ($46 billion capitalized operating lease and $39 billion financing lease obligations). The capitalized operating leases increased at a much faster rate to $545 billion in 2010 while the financing leases increased at a slower rate to $122 billion in 2010.
We also find that the proportion of firms in the COMPUSTAT universe that use financing leases is decreasing over time. Since reaching its peak of 39% (2163 firms) in 1979, the proportion has decreased to 25% (1,669 firms) in 2010. Combining the results from these two graphs, we observe that while the number of firms that initiate financing leases have decreased,the magnitude of financing leases, at the firm level,has increased. This finding is consistent with the argument that financing leases play an important role as an alternative financing vehicle for a certain subset of firms.
3. Models and Results
We use the following regression model to test our hypotheses:
LEASEi,t= a1+ a2MTRi,t+ a3RATINGi,t+a4ABSDAi,t+ a5CAPXi,t+a6NODIVi,t
+a7CFi,t+a8EPSVOLsi,t+a9GROWTHi,t+ a10SALESi,t+a11LMVi,t
+a12ROAti,t +a13BMi,t+ ei,t (1)
where LEASE represents the various lease variables that we measure. Specifically, we use the following lease variables in our empirical analyses; OP_LEASE1 is the capitalized operating leases divided by the sum of total assets and capitalized operating leases; FIN_LEASE1 is financing leases (dclo) divided by the sum of total assets and capitalized operating leases; LEASE1 is the sum of OP_LEASE1 and FIN_LEASE1. OP_LEASE2 is the rental payment divided by the sum of rental payment, opportunity cost of PPE, and depreciation; FIN_LEASE2 is one minus OP_LEASE2 times capital lease (dclo) divided by the sum of rental payment, opportunity cost of PPE, and depreciation. LEASE2 is the sum of OP_LEASE2 and FIN_LEASE2. RATIO1 is OP_LEASE1 /(OP_LEASE1 + FIN_LEASE1); RATIO2 is OP_LEASE2 /(OP_LEASE2 + FIN_LEASE2).
To measure the various determinants that affect a firm’s propensity to structure their leases as operating versus financing leases, we use the firm’s marginal tax rate to proxy for tax considerations. Specifically, MTR is the marginal tax before interest calculated based on Graham et al. (1998). We use RATING to proxy for financially constrained firms, where RATING, the credit rating of the company, equals 1 for ratings of AAA to AA- (or A1+ for commercial paper),2 for ratings of A+ to A- (or A1 for cp), 3 for ratings of bBB+ to BBB- (or A2 for cp),and 4 for ratings of BB+ to D (or below A2 for cp).
We use four different measures to proxy for different aspects of the firm’s agency costs: financial reporting quality, cash holdings, dividend paying behavior, and capital expenditure level.Poor financial reporting quality is associated with high information asymmetry which may lead to severe agency problems. Thus, we proxy for financial reporting quality using ABSDA, measured as the absolute value of discretionary accruals calculated based on the modified Jones model (Dechow et al. 1995[14]). High cash holdings together with no dividend payment are also considered as signs of
greater agency problems. Thus we use the following variables: CF is the cash flow of the firm measured as (ib+dp)/ta, and NODIV is a dummy variable that equals one if the firm pays no dividend during that fiscal year. Finally, over investment, as captured by high capital expenditure level, may also be an indication of agency problems. To proxy for this aspect of the agency problem, we use CAPX which is the capital expenditure divided by total assets.
We also include several firm characteristics in our regression analyses. Specifically, we include sales, market value, sales growth, profitability, earnings volatility, and book-to-market ratio. SALES is log of total sales. LMV is market value of the firm, measured as log of prcc_f*csho. ROA is return on assets, measured as income before extraordinary items divided by total assets (ib/ta). BM is book-to-market ratio (ceq/ (prcc_c*csho) ). EPSVOL is the standard deviation of epspx over the past five years. GROWTH is sales growth, measured as change in sales divided by sales from last year. Finally, we control for year and industry fixed effects, as changes in macroeconomic conditions and industry specific characteristics may also affect the firm’s propensity to lease.
Table 3 shows the results for lease propensity based on the balance sheet perspective. In general, we find results consistent with prior studies. That is, firms are less likely to lease (-0.024, t=-6.68) when their marginal tax rate is higher (e.g., Graham et al. 1998[11]) but are more likely to lease (0.004, t=10.39) when they are financially constrained
(e.g., Eisfeldt and Rampini 2009)[10]. Turning to the decision of whether to structure their lease contracts as operating or
financing leases, we find that firms are less likely to use operating leases(-0.018, t=-5.41) and financing leases (-0.006, t=-4.64) when their marginal tax rate is higher. Also, we find that firms are more likely to use operating leases (0.004, t=10.59) when their credit rating is lower. Finally, we find that the firm’s credit ratings have no effect on the propensity
to structure leases as financing leases (0.000, t=1.33).
With respect to agency problems, we find that the coefficients on the four measures of a firm’s agency problems are generally consistent,except for absolute discretionary accruals. Specifically, we find that firms with more cash (0.004, t=8.52), firms that pay no dividends (0.001, t=2.16),and firms with higher level of investment (0.049, t=12.51) are more likely to have more operating leases than other firms. In contrast, the coefficient on ABSDA is -0.028(t=-7.68). On the other hand, we find that firms with different agency costs are indifferent to structuring their lease contracts as financing leases.The only exception is cash holding. The coefficient on CF is 0.004 (t=8.53), statistically significant at the 0.01 level.
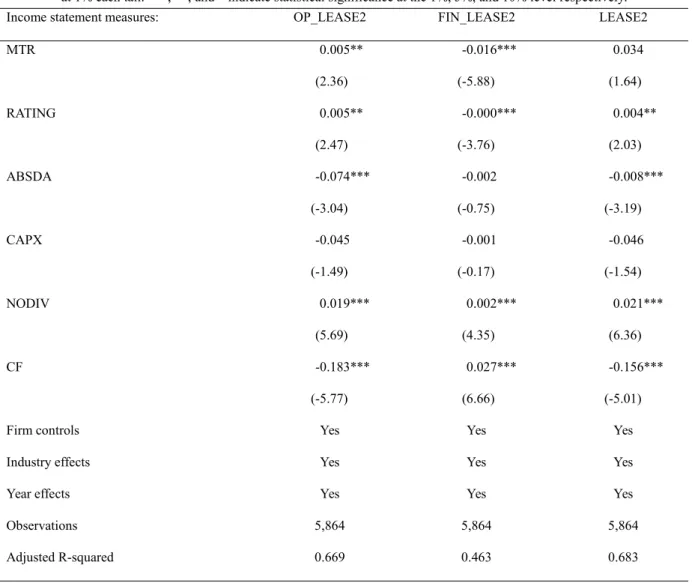
Table 4 reports the results for lease propensity based on the income statement perspective. Consistent with prior research, we find that financially constrained firms are more likely to lease than to buy (0.004, t=2.03). We also find that low credit ratings are positively associated with operating leases but negatively associated with financing leases. The coefficient on OP_LEASE2 is 0.005 (t=2.47), whereas the coefficient on FIN_LEASE2 is -0.000 (t=-3.76), both statistically significant at the 0.01 level. Likewise, we find that firms’ marginal tax rates are positively associated with operating leases but negatively associated with financing leases. The coefficient on OP_LEASE2 is 0.005 (t=2.36), whereas the coefficient on FIN_LEASE2 is -0.016 (t=-5.88), both statistically significant at the 0.05 level or lower.
We obtain mixed results for our empirical analyses that examine the association between the propensity to lease and the different aspects of the firm’s agency problems. We find that firms paying no dividend are more likely to have more operating leases (0.019, t=5.69) and financing leases (0.002, t=4.35), both statistically significant at the 0.01 level.On the other hand, we find that firms with high discretionary accruals and low cash holdings tend to have more operating leases. The coefficient on ABSDA is -0.074 (t=-3.04) and the coefficient on CF is -0.183 (t=-5.77), both statistically significant at the 0.01 level.In contrast, we obtain conflicting results for the propensity to structure a lease contract as a financing lease. Firms with high cash initiate more financing leases (0.027, t=6.66). However, we do not a significant association between FIN_LEASE2 and ABSDA or CAPX.
Table 5 reports the regression results based on the firm’s relative propensity to use operating leases versus financing leases. RATIO1 is the firm’s propensity to structure its leases as operating leases based on the balance sheet perspective, whereas RATIO2 is the firm’s propensity to structure its leases as operating leases based on the income statement perspective. Based on these measures, we find that differing marginal tax rates and credit ratings seem to have little effect on the choice of financing lease versus operating lease. On the other hand, we find that the decision to structure a lease contract as a financing lease versus an operating lease is affected by different aspects of the agency problem. Compared with financing leases, firms with lower financial reporting quality and higher capital expenditure are more likely to use operating leases while firms that pay no dividends and hold more cash are less likely to use operating leases. Specifically, the coefficient on ABSDA is 0.074 (t=4.40) and the coefficient on CAPX is 0.194 (t=10.32), whereas the coefficient on NODIV is -0.012 (t=-4.79) and the coefficient on CF is -0.207 (t=-9.29) when we useRATIO1. We find similar but weaker results for RATIO2.
4. Conclusion
Lease accounting rules are due for overhaul; however, prior studies have not specifically investigated the choice between operating leases versus financing leases from the managerial perspective. We believe this perspective, combined with that of the users of financial statements, provides a more complete picture of the issues surrounding lease accounting.
We find that tax considerations, debt capacity,and agency costs affect managers’ decision whether to structure their lease contracts as operating leases or as financing leases. Managers are more inclined to structure their leases as
operating leases when they are financially constrained. In contrast, they tend to lease less when the firm’s marginal tax rate is high. We also find that firms with more serious agency problems are more likely to take on operating leases. Finally, we find that the decision to structure a lease contract as an operating lease versusa financing lease varies with different aspects of the firm’s agency problems.
We believe our study will be of interest to regulators and standard-setters, especially in view of impending changes to the lease accounting rules. Our findings provide some insights into the different factors that influence the structuring of leases as either operating or financing leases. Overall, our study contributes to a better understanding of the extent of risks and benefits associated with the use of leased assets.
Figure 1: Time-trend analysis of the two types of leases (amount in $ million)
TABLE 1: Descriptive Statistics
Mean Std
Dev 5th Pctl Pctl25th Median Pctl75th Pctl95th
OP_LEASE1 0.041 0.045 0.004 0.015 0.030 0.051 0.110
FIN_LEASE1 0.004 0.012 0.000 0.000 0.000 0.002 0.019
LEASE1 0.045 0.048 0.004 0.016 0.033 0.055 0.128
OP_LEASE2 0.147 0.118 0.000 0.000 0.000 0.004 0.021
FIN_LEASE2 0.005 0.012 0.000 0.000 0.000 0.004 0.021
LEASE2 0.151 0.118 0.034 0.071 0.125 0.186 0.422
RATIO1 0.962 0.111 0.836 0.966 0.999 1.000 1.000
RATIO2 0.929 0.147 0.620 0.934 1.000 1.000 1.000
RATING 3.302 0.854 2.000 3.000 4.000 4.000 4.000
MTR 0.304 0.074 0.123 0.296 0.336 0.345 0.350
CAPX 0.067 0.069 0.006 0.022 0.048 0.087 0.200
ABSDA 0.055 0.059 0.003 0.017 0.038 0.072 0.164
NODIV 0.471 0.499 0.000 0.000 0.000 1.000 1.000
LMV 7.102 1.626 4.457 6.116 7.164 8.113 9.863
SALES 7.382 1.377 5.050 6.490 7.440 8.278 9.461
ROA 0.023 0.091 -0.101 0.007 0.036 0.063 0.109
BM 0.634 0.564 0.143 0.333 0.475 0.736 1.720
EPSVOL 1.335 1.433 0.196 0.446 0.808 1.672 4.332
GROWTH 0.185 0.405 -0.189 0.013 0.091 0.249 0.851
CF 0.073 0.080 -0.033 0.044 0.079 0.113 0.165
TABLE 2: Correlation Matrix
This table presents the correlations among the lease variables used in the empirical analyses. Pearson (Spearman) correlations are found above (below) the diagonal. The variables are defined in Table 1.
OP_LEA
SE1 FIN_LEASE1 OP_LEASE2 FIN_LEASE2 RATIO1 RATIO2
OP_LEASE1 1.000 0.159 0.653 0.070 0.010 0.079
(0.001) (0.001) (0.001) (0.001) (0.001)
FIN_LEASE1 0.137 1.000 0.050 0.995 -0.678 -0.717
OP_LEASE2 0.755 0.048 1.000 0.011 0.165 0.097
(0.001) (0.001) (0.439) (0.001) (0.001)
FIN_LEASE2 0.034 0.999 0.033 1.000 0.093 0.017
(0.012) (0.001) (0.018) (0.001) (0.210)
RATIO1 0.074 -0.975 0.090 -0.980 1.000 0.851
(0.001) (0.001) (0.001) (0.001) (0.001)
RATIO2 -0.050 -0.987 0.063 -0.980 0.987 1.000
(0.001) (0.001) (0.001) (0.001) (0.001) TABLE 3: Regression Analyses – Balance Sheet Measures
This table reports the results of our regressions using balance sheet based lease measures. The variables are defined in Table 1. Industry dummy based on two digit SIC code and year dummy are also controlled in all the regressions. All variables are winsorized
at 1% each tail. ***, **, and * indicate statistical significance at the 1%, 5%, and 10% level respectively.
Balance sheet measures: OP_LEASE1 FIN_LEASE1 LEASE1
MTR -0.018*** -0.006*** -0.024***
(-5.41) (-4.64) (-6.68)
RATING 0.004*** 0.000 0.004***
(10.59) (1.33) (10.39)
ABSDA -0.028*** -0.008*** -0.035***
(-7.68) (-5.81) (-9.20)
CAPX 0.049*** 0.001 0.051***
(12.51) (0.71) (11.97)
NODIV 0.001** -0.000* 0.000
(2.16) (-1.66) (1.45)
CF 0.040*** 0.013*** 0.053***
(8.53) (7.23) (10.50)
Firm controls Yes Yes Yes
Industry effects Yes Yes Yes
Year effects Yes Yes Yes
Observations 24,388 24,388 24,388
TABLE 4: Regression Analyses – Income Statement Measures
This table reports the results of our regressions using income statement based lease measures. The variables are defined in Table 1. Industry dummy based on two digit SIC code and year dummy are also controlled in all the regressions. All variables are winsorized
at 1% each tail. ***, **, and * indicate statistical significance at the 1%, 5%, and 10% level respectively.
Income statement measures: OP_LEASE2 FIN_LEASE2 LEASE2
MTR 0.005** -0.016*** 0.034
(2.36) (-5.88) (1.64)
RATING 0.005** -0.000*** 0.004**
(2.47) (-3.76) (2.03)
ABSDA -0.074*** -0.002 -0.008***
(-3.04) (-0.75) (-3.19)
CAPX -0.045 -0.001 -0.046
(-1.49) (-0.17) (-1.54)
NODIV 0.019*** 0.002*** 0.021***
(5.69) (4.35) (6.36)
CF -0.183*** 0.027*** -0.156***
(-5.77) (6.66) (-5.01)
Firm controls Yes Yes Yes
Industry effects Yes Yes Yes
Year effects Yes Yes Yes
Observations 5,864 5,864 5,864
Adjusted R-squared 0.669 0.463 0.683
TABLE 5: Regression Analyses – Ratio Measures
This table reports the results of our regressions using ratio based lease measures. The variables are defined in Table 1. Industry dummy based on two digit SIC code and year dummy are also controlled in all the regressions. All variables are winsorized at 1%
each tail. ***, **, and * indicate statistical significance at the 1%, 5%, and 10% level respectively.
Relative measures: RATIO1 RATIO2
MTR 0.003 0.193***
(0.18) (7.17)
RATING -0.001 0.003
(-0.55) (1.35)
(4.40) (-1.10)
CAPX 0.194*** 0.470***
(10.32) (12.32)
NODIV -0.012*** -0.030***
(-4.79) (-6.93)
CF -0.207*** -0.071*
(-9.29) (-1.76)
Firm controls Yes Yes
Industry effects Yes Yes
Year effects Yes Yes
Observations 24,388 5,864
Adjusted R-squared 0.163 0.507
References
1. BBeatty A, Liao S , Weber J, 2010, Financial Reporting Quality, Private Information, Monitoring, and the Lease-versus-Buy Decision. Accounting Review, 85(4): 1215–1238.
2. American Accounting Association (AAA) Financial Accounting Standards Committee (FASC), 2011, A Perspective on the Joint IASB/FASB Exposure Draft on Accounting for Leases. Accounting Horizons 25: 861–871.
3. Reither C L, 1998, What are the Best and Worst Accounting Standards? Accounting Horizons 12: 283–292. 4. International Accounting Standards Committee Foundation, 2013, Exposure Draft ED/2013/6 Leases London U.K.
5. Imhoff E, Lipe R C, Wright D W, 1991, Operating Leases: Impact of Constructive Capitalization. Accounting Horizons, 5: 51
–63.
6. Ely K, 1995, Operating Leases Accounting and the Market’s Assessment of Equity Risk. Journal of Accounting Research. 33: 397–415.
7. Ge W G, Imhoff, L Lee. 2008. Is Recognition for Operating Leases Necessary? Working paper University of Washington. 8. Dhaliwal, D, H. S. Lee, and M. Neamtiu 2011. The Impact of Operating Leases on Firm Financial and Operating Risk. Journal
of Accounting, Auditing, and Finance 26: 151–197.
9. Bratten, B., P. Choudhary, and K. Schipper. 2013. Evidence that market participants assess recognized and disclosed Items similarly when reliability is not an issue. The Accounting Review 88: 1179-1210.
10. Eisfeldt A L, and Rampini A A, 2009, Leasing, Ability to Repossess, and Debt Capacity. Review of Financial Studies 22: 1621
–1657.
11. Graham J R, Lemmon M, Schallheim J S, 1998, Debt, leases, taxes, and the end ogeneity if corporate tax status. Journal of Finance 53: 131–162.
12. Sharpe S A, Nguyen H H, 1995, Capital Market Imperfections and the Incentive to Lease. Journal of Financial Economic. 39: 271–294.
13. Alchian A, Demsetz H, 1972, Production, Information Costs, and Economic Organization. American Economic Review 62: 777
–795.