1
Perceptions of Attractiveness, Discrimination, and Racial Bias
Cassius Modisana Hossfeld
Honors Thesis Department of Sociology
University of North Carolina at Chapel Hill 2016
4/18
Approved:
2
TABLE OF CONTENTS
Abstract 3
Introduction 3
Literature Review 5
Methods and Data 13
Results 20
Discussion 32
Conclusion 37
3 ABSTRACT
How might one’s attractiveness shape the discrimination they receive, and how might this relationship be affected by racial bias? The purpose of this study is to explore the relationship between perceived attractiveness and perceptions of discrimination, and how this relationship is the same or different for whites and blacks. In this research, I examine the link between these variables, and try to uncover a possible relationship that might exist. To do this, I used survey data from the Add Health dataset, from the Carolina Population Center, by coding response questions into cumulative index variables and interpreting the results. The results suggest that there is indeed a negative relationship between attractiveness and discrimination. Furthermore, the results indicate racial bias might exist by muting the strength of this relationship for black respondents, as no association between the variables exists when measuring this group.
INTRODUCTION
We all have a different formula for what generates our picture-perfect “attractive” person, because of both innate and cultural factors. Some people like blonde hair, some people like curly hair. Some people like tall and skinny, some people like short and plump. Some even like a good beard, and others like clean shaven. And some would simply prefer a white person, or a black person, or an Asian person. Due to globalization, we are all having to interact more and more with people of different cultures and races -- people that simply look different from us.
4
I went about examining this question through looking at data from a comprehensive longitudinal study of adolescents called Add Health. This survey began in 1995; it offers such a wide array of questions, I was able to select and analyze the data provided by the respondents. This has been helpful in so far as providing me with a quality sample size and large number of response questions to choose from. My hypothesis before the data was analyzed was that people would generally have more negative interactions with people of lower attractiveness levels, implying that they would be more discriminatory if a person is less attractive. More clearly stated: as someone is more attractive, they should experience less discrimination, or that their perception of people’s discrimination towards them is lower than among attractive people.
People’s prejudice and racialized discrimination are hard to ignore, but how will these be shaped as more and more people of different groups are forced into situations where they must examine one another’s depths, experiences, and beliefs in a non-prejudicial way? How do we recreate the concept of attractiveness when we are forced to leave our sphere of homogenous look alikes, and deal with people who look very different from us? And further, how do we as a people judge others, based on the way they look? These are some of the questions I examined through this project.
5
questions regarding the perception of discrimination. To define discrimination, both generally and racially, I will use a definition that is similar and applicable to both. General discrimination can be defined as a behavior that results in differential treatment towards a group based on a characteristic, while racial discrimination can be defined as differential treatment towards individuals based on race (Pager & Shepherd, 2008).
LITERATURE REVIEW
Research shows that society consistently provides preferential treatment to those deemed attractive. The research in this paper is focused mainly on the ways in which attractiveness shapes people’s views of each other, and more specifically, how attractiveness determines one’s discriminatory behavior against another. This is important research because it addresses some of the reasons why people are biased against one another, based on many deep issues, particularly race. Through understanding these biases, I believe that we as a society will be able to more easily identify our discriminatory behavior towards each other, and hopefully be more
responsible in our behaviors (especially when it comes to racial discrimination). However, this research is limited. Yet, this is paralleled with understanding some of the broader scope
6
Literature on Discrimination and Preferential Treatment
Discrimination is both a behavior and an experience, and everyone does both every day. In some ways it is a social process exacted to organize people and their behavior into groupings, so that everybody is more easily identifiable. Discrimination has been around throughout human history. However, there are different kinds of discrimination (e.g., racial discrimination as opposed to gender discrimination). A more general version of discrimination (from the sociological perspective) suggests that we discriminate along the lines of status (who has higher or lower status). In society we tend to associate those with higher status as being “better ([more] esteemed and competent)” (Ho, et. al., 2015)and discriminate against those based on a “range of status characteristics”. This is similar to racial discrimination, as race is a status characteristic (Ridgeway, 2014). Furthermore, when discussing race as a status characteristic, it should be noted that there is a hierarchy between racial groups, whereas darker skin is considered a lower status characteristic, and lighter skin is considered a higher status characteristic.
According to many scholars, racial discrimination right now exists in the form of color blind racism. The definition of this form of institutional discrimination can be described as racial discriminatory practices that are “subtle, institutional, and apparently non-racial”(Bonilla-Silva 2010, 3). This means that racial practices are no longer “overt”, but instead done in ways to quietly reproduce traditional social orders (Bonilla-Silva, 2003; Mazella & Feingold 1994). Color blind racism is a form of institutional discrimination, meaning that it is “embedded in important social institutions” (Pincus, 1996). This is different from the form of individualized discrimination being tested here, however, institutional forms of discrimination are manifested in individual, daily acts people experience and are often associated with individual forms of
7
Both general and racial discriminatory practices occur through the means of one judging another person’s “status characteristics”. A status characteristic is “a characteristic of an actor that has two or more states that are differentially evaluated in terms of honor, esteem, or desirability, each of which is associated with distinct moral and performance expectations” (Berger, Rosenholtz, & Zelditch, 1980: 482). So for race, the status characteristic being judged would be skin color, while for discrimination as a whole it could be anything as subtle as smell, the way one walks, or the perception of attractiveness. Many of the theories on racial
discrimination (as it relates to attractiveness) discuss judging skin color as a basis for discrimination. This work suggests that “in a racial hierarchy that privileges whites at the expense of blacks, white phenotypic characteristics are deemed more attractive than black phenotypic characteristics”(Reece, 2015). Furthermore, using the concept drawn upon in Racial Formations, we should consider race as a “master category”, in the sense that it predominates other factors influencing discriminatory practices. So this should suggest to us that attractiveness might have a diluted effect on discrimination when the target of discrimination is member to a lower status racial group (Omni & Winant, 2015).
Literature on Attractiveness
8
their own perception of beauty. Each marginal shift then pushes them away from the collective perception, making their preference somewhat unique.
There is much literature describing attractiveness as both biological, and cultural. For example, facial attractiveness is heavily influenced by symmetry (Rhodes, 1998); a perception of attractiveness that is more biologically based. Through our inherent ability to determine facial symmetry, we distinguish those with more of it as increasingly attractive. The biological foundation here parallels the concept of genetic fitness. Genetic fitness describes the appeal associated with the phenotypic characteristics of the surviving offspring produced by an actor (the traits that get passed down through offspring, and how appealing they are to the rest of the animals in your social order) (Jiang, Bolnick, & Kirpatrick, 2013). The genetic fitness is the appeal associated with these traits, and how many of these traits you carry (a genetically fit person carries more “attractive” traits, for example). In the biological world, one is predisposed to find some phenotypic features more pleasing, such as the symmetrical face. It is also generally a universal thing for people to give preference to tall people, or men with a lot of hair on their head. There are many phenotypes we all suggest preference to every day without realizing it, simply acting upon inherent biological cues. The tricky thing is deciphering between biological and social cues though, because they are constantly shaping one another. The question then is not which set of preferences are founded in biology and which set is founded in social behavior, but how they shape each other to form preference.
9
shapes the perception of attractiveness. There is a phrase Homo Economicus (loosely meaning “economics creates economics”, or “economics does economics”). Accordingly, sociology does biology and biology does sociology just as much as they do themselves. What is meant here is that these modes of thought create and recreate each other, and a good medium for us to understand this process lies within our perception of attractiveness. The kids are acting upon a social cue in judging other kids’ phenotypes, and they are acting upon the phenotypes just the same by calling other kids “weird” (a social cue).
Attractiveness, Status, and Discrimination
10
attractiveness and discrimination, helping us in understanding how people might discriminate (or choose companions) based on attractiveness the next step is to understand how we might relate racialized discrimination to our perceptions of attractiveness.
Theory of Racial Hierarchy
Much of the literature suggests that minority status has a negative effect on a mainstream view of attractiveness (Lewis, 2010; Ho, & Roberts, 2015; Reece, 2015). Going back to the quote: “in a racial hierarchy that privileges whites at the expense of blacks, white phenotypic characteristics are deemed more attractive than black phenotypic characteristics” (Reece, 2015:1), it is suggested that a mainstream perspective makes it more advantageous for one’s attractiveness to be fairer skinned. But could this be conceptually related to the notion of
competency? It could be that due to the lower racial status of blacks in society (or the lower value of darker skin as a status characteristic), blacks are viewed as less competent, and therefore simply less attractive. My hypothesis (in so far as what the relationship between attractiveness and racialized discrimination will be) is that because of racial bias towards blacks, attractiveness has less of an effect on the experience of discrimination, whereas for whites, attractiveness has a greater effect of reducing discrimination.
11
seems to note that our views of colorism are similar to those in Central and South America, whereas the lighter, more European features one might have, the more attractive one is perceived as being: “Eurocentric standards of beauty reign supreme in the United States, placing increased value on features typically associated with whiteness such as light skin and straight hair” (Reece, 2015). It appears that mainstream views of attractiveness follow the hierarchical totem, with fair European features at the top, and dark African features at the bottom. But this is strictly along phenotypical lines. The notion that each racial group evaluates each racial group differently is very important to mention here: “racial essentialism, both dispositional and experimentally induced led to the categorization of Black-White multiracial individuals as black, but only among individuals evaluating black people more negatively than white people. These findings demonstrate how fundamental cognitive and motivational biases interact to influence the categorization of multiracial individuals”(Ho & Roberts, 2015). Each demographic group evaluates each minority group
differently, some more negatively than others, so it is conceptually important to keep in mind that status characteristics are measured very differently between groups. This is supported by findings suggesting that while Black South African men look for color in a potential mate; White, Scottish men look for shape cues (Coetzee, Vinet, et al. 2014). Different groups measure different status characteristics differently, which is important to note when testing populations.
12
previously thought. This study did indeed challenge the notion that fairer skin is more often attractive to people, a theory that seems very prevalent throughout much of the literature relating to
attractiveness and race.
Summary
Much of the literature referenced in this section used a different series of variables than the ones I am using, however, I have attempted to condense them all into a summary form so that they may be applicable to the variable set I am using (all of the referenced literature did indeed use either attractiveness, or discrimination as a variable however, if not both). An example of this is the relationship between two studies used to describe facial attractiveness. Facial attractiveness is measured in large part by the symmetry of a person’s face (this is more pronounced for men than for women) (Rhodes, 1998). The symmetry is noted to possibly suggest mate quality. This differs only slightly from a study suggesting that (amongst males) more dominant facial features are considered more attractive and therefore lead to more preferential treatment (Muller, & Mazur, 1996). Difference in the use of variables in the literature has been a challenge, however, I have tried to utilize the slightly different operationalizations of the variables mentioned in each study so that they may help to create the bigger picture relationship between attractiveness and perceived discrimination.
The gap in the literature I have found is that of relating the concepts of attractiveness with general discrimination, and using that to make a point about racialized discrimination’s
13
METHODS AND DATA
To understand the relationship between attractiveness and discrimination, I used the Add Health data set from the UNC Population Center. This data set is a comprehensive, longitudinal study of adolescents, taking place intermittently from 1995 to 2008. The research design used for this project was a survey design. The sampling methods used in this comprehensive survey were stratified random sampling methods, using a random sample of high schools across the United States. A school was included in the list of possible samples if it had “an 11th grade and a minimum of 30 students”. The urbanicity of these schools ranged from urban, suburban, and rural. The demographic variables I used from this data set were useful because so many people from each demographic were surveyed, allowing me to get a big picture understanding of some of these groups. For example, 355 black males, 1,481 white males, 881 black females, and 2,180 white females were surveyed in the study. This made it much easier in not having to worry about the sample sizes of my data. The survey consisted of a range of questions concerning variables within a person’s personal sphere. This included questions concerning one’s
14
and whites with whites, or not. It is important to know this information because possible racial bias could be occurring, for example, if a white interviewer is judging black respondents as attractive less often. Instead, there will be no assumption about the interviewer’s race.
The questions I focused on were involved with understanding a person’s features,
perception of their relationships with other people, perception of themselves, and their perception of attractiveness. The Response Questions I used from the data set are listed below, along with the recoding of these variables from their original classification. The response questions in the boxes are coded. The codings are linked to the formal Add Health questions as follows. Codings and Related Questions
Code Question
1 ATT How physically attractive is the respondent? 2 ALITY How attractive is the respondent’s personality? 3 GROOM How well-groomed was the respondent? 4 UN People unfriendly to you
5 DIS You felt that people disliked you 6 ACC You feel socially accepted
7 RES In your day to day life how often do you feel you have been treated with less respect or courtesy than other people?
8 RACE Indicate the race of the sample member/respondent from your own observation (not from what the respondent said)
9 B Black (coded 1 when respondent is black, coded 0 when respondent is white 10 WH White (coded 1 when respondent is white, coded 0 when respondent is black) 11 GEND Is {NAME} male or female?
12 PA Perceived Attractiveness (ATT + ALITY + GROOM) 13 PD Perceived Discrimination (UN + DIS + ACC + RES)
14 .a Missing
15
Attractiveness and Discrimination as Independent and Dependent Variables
One independent (attractiveness) and one dependent (discrimination) variable were used in this project. I measured attractiveness in terms of physical attractiveness (coded “att”), personality attractiveness (coded “ality”), and grooming (coded “groom”). These were then coded together to create the index variable “PA” (perceived attractiveness). I measured
discrimination in terms of people’s unfriendliness towards one (coded “un”), people’s disliking of one (coded “dis”), people’s social acceptance of one (coded “acc”), and people’s perceptions of feeling respected (coded “res”). These were also coded together in an index variable labeled “PD” (perceived discrimination). These index variables were cross tabulated, and provided the relationship “PA * PD”. I created these index variables in order to form a weighted sum for the response questions I was measuring. So for example, in creating the index variable “PA”, I was able to informally sum together the results for the attractiveness response questions into an index, which I could then use to measure its relationship with the dependent variable. This index helps me to, in a way, re-operationalize what I want to find when I discuss attractiveness, in so far as that I can include the response options regarding personality attractiveness and grooming.
16
included in the independent index variable was grooming. Grooming is related to the habits one has in maintaining their appearance, and can (as some of the data showed) have a drastic
influence on people’s perceptions of one’s attractiveness.
The response questions matched with the dependent index variable “PD” were chosen based on the same conditions as above, but with one additional one. The response questions had to be focused on the respondent’s perceptions of people’s discrimination towards them, and not others. There were two response questions used throughout the project, but were dropped later on, that dealt with the respondents perceptions of discrimination in a social setting
(discrimination they witness, but might not experience). However, these response questions ended up being too unrelated to the four which were included, causing them to be dropped. The four included are all perceptions of people’s discrimination towards the respondent, or, the discrimination the respondent reports feeling. This was more in line with the research question, because it pertained to how one might perceive the treatment they receive as an identifying member of a particular race (white or black).
Moderating Variables
The moderating variables race and gender were used to isolate demographic groups, to determine whether there might be any relationship between the independent and dependent variables based on these two factors. Race was coded “race” (n=4,897), and had two
17
female, coded “f” (n=3,061). Mainly for the purposes of time, the racial categories white and black were the only ones used from the dataset. Asian and Hispanic were available options, however, and I would like to go back and possibly add these groups into the data for future research. However, right now both the dataset and the literature provided only discuss the experiences and responses of whites and blacks.
Recoding of Response Options
18
last big set of recoding I worked on were the Likert scale response options labeled “Strongly disagree”, “Disagree”, “Neither agree nor disagree”, “Agree”, “Strongly agree”. I recoded them to collapse “Strongly disagree” with “Disagree”, and “Strongly agree” with “Agree”. This was beneficial to the point of (like the others) reducing a high number of values at the center response questions, and spreading out the answers in a way that it was more easily recognizable to
distinguish between whether the respondents agreed or disagreed.
The three response questions coded “att”, “ality”, and “groom”, were recoded to collapse the response options “Average”, “Very attractive”, and “Attractive” together, as well as “Very unattractive” and “Unattractive” together (in the case of response question “groom”, the recoding was labeled with groom variables). This was done because a majority of the interviewers did not rate the extremities of the attractiveness response options terribly frequently, tending to lean in the middle towards the option “average”. Doing this allowed the data to become clearer, as it became easier to distinguish between whether someone indicated the simple dichotomy of attractive or unattractive. I also ran crosstabs with both the coded and un-coded versions of the attractiveness response questions, seeing how this might affect statistical significance and the relationship between variables. Ultimately, I chose to use the coded versions listed above, so as in order to more simply categorize people’s perceptions.
Rationale for Response Questions Used
19
for doing this was in order to have an objective interpretation of the respondents’ attractiveness, so that in the study I could measure attractiveness against other variables. The interviewer interpretations of the respondent’s attractiveness was hopefully as unbiased as possible so that it could be representative of others beliefs. The questions I used to measure discrimination, coded “un”, “dis”, “acc”, and “res”, were useful in measuring the respondents’ perceptions of
discrimination presented towards themselves, as well as discrimination they have witnessed in the public sphere. Utilizing both of these criteria has been helpful in figuring out the respondents (based on the characteristics they were measured by, such as attractiveness or race) perception of discrimination in different atmospheres, and providing a more in-depth look at how
discrimination might pervade itself throughout society (although it may not be indicative of discriminations pervasiveness in greater society). I was also interested in measuring
attractiveness and the perceived discrimination of respondents based on their race and gender, so using the recoded response questions “race” and “gend” I was able to see how these statuses shaped the relationship between attractiveness and discrimination.
STATA Cross tabulations
20 Response Question Matrix for Cross Tabulations
Perceived Attractiveness “PA” Perceived Discrimination “PD”
Physical Attractiveness
People unfriendly to you Felt people dislike you Feel socially accepted Treated with less respect Personality Attractiveness
People unfriendly to you Felt people dislike you Feel socially accepted Treated with less respect Grooming
People unfriendly to you Felt people dislike you Feel socially accepted Treated with less respect
All of these Response Questions were recoded and tabulated/cross tabulated together to get results. The way in which I conceptualized these response questions was by comparing my independent variable response questions (the left hand side attractiveness questions) with my dependent variable response questions (with the left hand side discrimination response questions) in the table above. I cross tabulated each individual relationship of the response questions, in order to create a bigger picture in relating attractiveness and discrimination, and then I isolated race and gender to create the picture that these variables (using an “if” function on the STATA log file”) might ultimately present. The findings of these results is discussed in the following section.
RESULTS
21
outcomes, measuring the relationships between the variables I categorized as representing attractiveness, with those I categorized as measuring discrimination.
Attractiveness and General Discrimination
In the process of completing my data collection and summarizing it, I began to work on a few separate but related research questions. The first, overarching, umbrella research question I developed is: What is the relationship between attractiveness and the perception of
22 Statistical Significance and Relationship of Variables
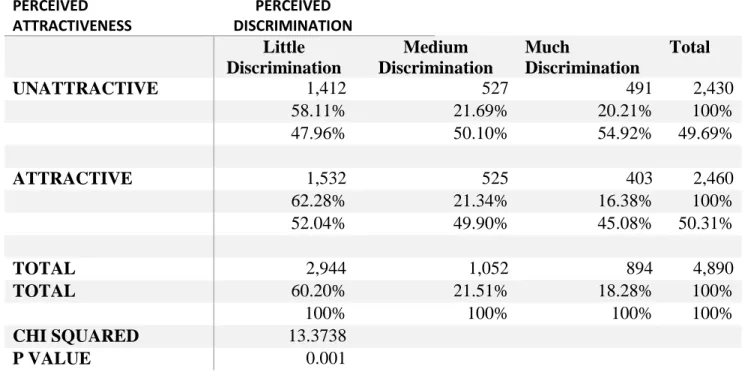
Table 1: “Relationship between Attractiveness and Discrimination” (Complete Working
Sample) PERCEIVED ATTRACTIVENESS PERCEIVED DISCRIMINATION Little Discrimination Medium Discrimination Much Discrimination Total
UNATTRACTIVE 1,412 527 491 2,430
58.11% 21.69% 20.21% 100%
47.96% 50.10% 54.92% 49.69%
ATTRACTIVE 1,532 525 403 2,460
62.28% 21.34% 16.38% 100%
52.04% 49.90% 45.08% 50.31%
TOTAL 2,944 1,052 894 4,890
TOTAL 60.20% 21.51% 18.28% 100%
100% 100% 100% 100%
CHI SQUARED 13.3738
P VALUE 0.001
Basically, the way in which this table has been constructed is by testing the association between attractiveness and perceived discrimination. Using the response questions pertaining to each variable, I coded them to collapse together under the variables being tested, that way I could cumulatively look at them under each variable. For example, the response questions for
23
percentages of the table express the percent (and numerical number below) of people who dichotomously fell under the categories of either being discriminated against or not, as well as being judged as attractive or not.
What we can see in Table 1 is a beginning to the story to understanding the relationship between attractiveness and perceived discrimination. At surface, it appears an inverse
relationship does exist (meaning that as one’s appearance improves, their perception of
discrimination from other’s decreases). When looking at the table, one thing of interest was that the relationship between grooming behavior and perceived discrimination was pronounced, possibly indicating that one’s grooming is a very influential marker in determining
attractiveness. For example, it could be that the more one appears to groom themselves, people consider them more attractive, leading to a decrease in the discrimination they experience and report.
My original hypothesis for the relationship between attractiveness and perceived
discrimination was that there would be a statistically significant negative association between the two, and this has in some ways turned out to be true. The data suggests that there is indeed a negative relationship between the two, and the results did turn out to be statistically significant, with a p-value of .001 and Chi Squared value of 13.3738. The relationships that had a
24
one is, the less discrimination they receive. A greater percentage of respondents who felt
discrimination were consistently considered more unattractive by the interviewer, while a greater percentage of respondents who felt less discrimination were considered more attractive by the interviewer. This supports my original hypothesis and the literature by suggesting that
attractiveness has an association with less feelings of being discriminated against. Attractiveness, Discrimination, and Racial Bias
The second research question I would like to develop is: What is the effect racial bias might have on the relationship between attractiveness and discrimination? To answer this
question, I ran the same STATA cross tabs with the condition of race of the respondent coded in. By doing this, I was able to determine the relationship between attractiveness and perceived discrimination separately for blacks and whites, to determine how the relationship between attractiveness and discrimination might be shaped by race. Using the same response questions, I recreated two similar tables to measure the results for both black and white respondents.
25
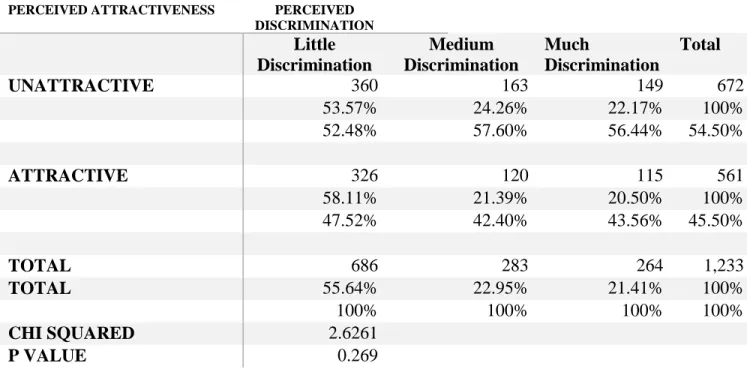
Table 2: Relationship between Attractiveness and Discrimination for Black Respondents
PERCEIVED ATTRACTIVENESS PERCEIVED DISCRIMINATION Little Discrimination Medium Discrimination Much Discrimination Total
UNATTRACTIVE 360 163 149 672
53.57% 24.26% 22.17% 100%
52.48% 57.60% 56.44% 54.50%
ATTRACTIVE 326 120 115 561
58.11% 21.39% 20.50% 100%
47.52% 42.40% 43.56% 45.50%
TOTAL 686 283 264 1,233
TOTAL 55.64% 22.95% 21.41% 100%
100% 100% 100% 100%
CHI SQUARED 2.6261
P VALUE 0.269
Table 3: Relationship between Attractiveness and Discrimination for White Respondents
PERCEIVED ATTRACTIVENESS PERCEIVED DISCRIMINATION Little Discrimination Medium Discrimination Much Discrimination Total
UNATTRACTIVE 1,052 364 342 1,758
59.84% 20.71% 19.45% 100%
46.59% 47.33% 54.29% 48.07%
ATTRACTIVE 1,206 405 288 1,899
63.51% 21.33% 15.17% 100%
53.41% 52.67% 45.71% 51.93%
TOTAL 2,258 769 630 3,657
TOTAL 61.74% 21.03% 17.23% 100%
100% 100% 100% 100%
CHI SQUARED 11.8989
26
As seen in the tables above, a higher percentage of attractive whites felt less
discrimination. While a higher percentage of attractive blacks felt more discrimination. These two tables paint a picture of how race shapes how attractiveness associates with discrimination, by noting the differences between white and black respondents in their perception of being discriminated against, based on their attractiveness. The relationships between these two variables in regards to whites and blacks varies statistically as well. For blacks, the end result was that there was no statistical relationship between the two variables, with a p-value of .0269, and a Chi Squared value of 2.6261. While for whites, a relationship between the two variables did exist, in that there was a p-value of .003, and a Chi Squared value of 11.8989. Although there are large numbers of blacks, this difference may also be due to smaller sample sizes among blacks.
What we begin to see here are the different relationships attractiveness and discrimination have based on race. Ultimately, the biggest point to note is the difference in numerical number of attractive blacks vs. that of attractive whites (the numerical number is proportionally higher for whites). While whites have a higher percent of attractive respondents answering “little
discrimination”, blacks appeared to have a higher jump from unattractive to attractive answering “little discrimination”. One relationship I would like to make note of is the relationship between the response question coding of “personality attractiveness” and the discrimination questions. Personality attractiveness seemed to rarely have a negative relationship (attractiveness goes up, discrimination goes down) with discrimination for blacks (although the relationship for blacks was not statistically significant), while the opposite is true for whites. For whites, the
27
discrimination, and this appears to be the most notable difference between the two groups in regards to their relationships with perceived discrimination and attractiveness.
Attractiveness and Racialized/Gendered Discrimination
My next set of results centers on the relationship between attractiveness for different race and gender groupings. In finding the results to this relationship, I added the isolation of gender as a feature in cross tabulating the attractiveness/discrimination variables, along with race. The way in which this section was broken down was into four different groupings, Black males, white males, black females, and white females. The reason for adding this isolated gender variable was in order to provide a broader scope of the relationship between attractiveness and discrimination. This broader picture developed in helping to decipher how attractiveness and racialized
discrimination are related, as some of these processes are embedded in gender more so than race, and being able to isolate these incidents helps in creating that broader picture.
28
Table 4: Relationship between Attractiveness and Discrimination for Black Male
Respondents
PERCEIVED
ATTRACTIVENESS
PERCEIVED DISCRIMINATION
Little Discrimination Medium Discrimination
Much
Discrimination
Total
UNATTRACTIVE 266 113 107 486
54.73% 23.25% 22.02% 100%
53.85% 57.65% 57.22% 55.42%
ATTRACTIVE 228 83 80 391
58.31% 21.23% 20.46% 100%
46.15% 42.35% 42.78% 44.58%
TOTAL 494 196 187 877
TOTAL 56.33% 22.35% 21.32% 100%
100% 100% 100% 100%
CHI SQUARED 1.1359
P VALUE 0.567
Table 5: Relationship between Attractiveness and Discrimination for White Male Respondents
PERCEIVED
ATTRACTIVENESS
PERCEIVED DISCRIMINATION
Little Discrimination Medium Discrimination
Much
Discrimination
Total
UNATTRACTIVE 605 237 206 1,048
57.73% 22.61% 19.66% 100%
45.76% 49.48% 55.38% 48.23%
ATTRACTIVE 717 242 166 1,125
63.73% 21.51% 14.76% 100%
54.24% 50.52% 44.62% 51.77%
TOTAL 1,322 479 372 2,173
TOTAL 60.84% 22.04% 17.12% 100%
100% 100% 100% 100%
CHI SQUARED 11.1274
29
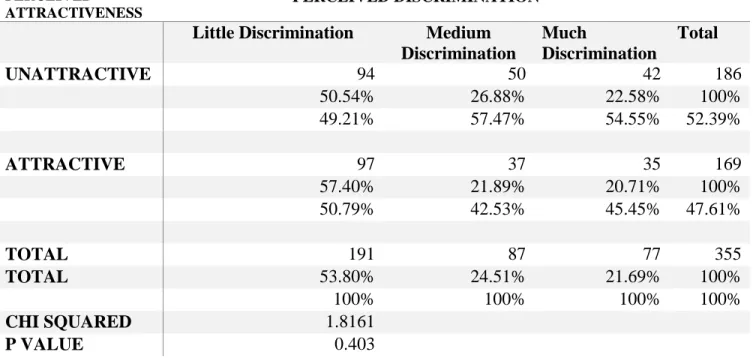
Table 6: Relationship between Attractiveness and Discrimination for Black Female Respondents
PERCEIVED ATTRACTIVENESS
PERCEIVED DISCRIMINATION
Little Discrimination Medium Discrimination
Much
Discrimination
Total
UNATTRACTIVE 94 50 42 186
50.54% 26.88% 22.58% 100%
49.21% 57.47% 54.55% 52.39%
ATTRACTIVE 97 37 35 169
57.40% 21.89% 20.71% 100%
50.79% 42.53% 45.45% 47.61%
TOTAL 191 87 77 355
TOTAL 53.80% 24.51% 21.69% 100%
100% 100% 100% 100%
CHI SQUARED 1.8161
P VALUE 0.403
Table 7: Relationship between Attractiveness and Discrimination for White Female Respondents
PERCEIVED ATTRACTIVENESS
PERCEIVED DISCRIMINATION
Little Discrimination Medium Discrimination
Much
Discrimination
Total
UNATTRACTIVE 445 125 136 706
63.03% 17.71% 19.26% 100%
47.75% 43.55% 52.71% 47.80%
ATTRACTIVE 487 162 122 771
63.16% 21.01% 15.82% 100%
52.25% 56.45% 47.29% 52.20%
TOTAL 932 287 258 1,477
TOTAL 63.10% 19.43% 17.47% 100%
100% 100% 100% 100%
CHI SQUARED 4.5708
30
The results coming from these four relationships create a picture similar to what was seen in Tables 2 and 3 discussing the relationships between attractiveness and perceived
discrimination for blacks and whites as a whole. As seen here in Tables 4 and 5, the relationship between attractiveness and perceived discrimination is less frequently negative for black males than for white males. However, what we can also see is that even amongst whites, white women less frequently display a negative relationship between the two variables than white men do. If we look at Table 5 describing white men, more often attractive white males received a higher percentage of “little discrimination”. The relationship between the two variables was more statistically significant as well, with a p-value of .004, and a Chi Squared value of 11.1274 for white males. For table 4 (black males) the picture was a bit different. Statistically speaking, there was no real relationship, with a p-value of .567, and a Chi Squared value of 1.1359. But when looking at the table, and the discrepancy between those who were attractive and their perceptions of discrimination with those who were unattractive, attractive black males less frequently felt “little discrimination” and more frequently felt “much discrimination”.
31
however, they were extremely close. The p value for Table 7 was .102, while the Chi Squared value was 4.5708. This indicated that even though no relationship existed between the two variables for these two groups, the relationship was stronger than for black males and females, which is likely a function of sample size. Also, the results in Table 7 suggested that of the four demographic groupings white females had the second highest proportion of attractive people saying they felt little discrimination, and the second lowest proportion of people saying they felt much discrimination, both behind only white men.
This spectrum from white men and women to black men and women is interesting, as they appear to diverge in some ways. One theory as to why this could have occurred is based on the racial hierarchy of attractiveness described in the literature. The racial hierarchy described whites as being considered more attractive “at the expense of blacks”, and we could be witnessing this pattern occur here. This could exist whereas white males and females were simply more often considered attractive (than whites being considered unattractive), as opposed to blacks who were more often considered unattractive, in contrast to being considered attractive. What this could imply is that because blacks are considered unattractive more often (a lower percent of the population is even deemed attractive), they are not treated as attractive, and therefore do not reap the benefits of being attractive because they are not considered as such. Whereas for whites, they are more often considered attractive, and in such they are able to more frequently reap the rewards for peoples consideration of their “attractiveness” (attractiveness, remember, is just a set of phenotypic characteristics found desirable by a population).
32
females it was very close). It should be noted again that white males were the only group to relay a statistically significant relationship between people’s perceptions of their attractive and their own perceptions of being discriminated against.
DISCUSSION
The results I found describe a relative similarity between demographic groups in regards to their relationships with attractiveness and discrimination. For all groups combined, what I found was that there is indeed a relationship between perceived attractiveness and perceived discrimination, and that relationship is that the more attractive one is, the less discrimination they are expected to receive. Although, the results in this relationship were quite marginally small (the differences between unattractive and attractive respondents who felt little-much discrimination). The significance held for this relationship, but there was little difference in the percent of people who were unattractive and felt “little discrimination”, and those who were attractive and felt “little discrimination” (just a 4% difference). The greatest difference was of those who were unattractive and attractive and said they felt “much discrimination” (a 9% difference). The relationship differed a bit when controlling for race, however. The statistically significant inverse relationship for whites contrasted to that of the relationship for blacks, which was inverse, but where no statistical significance was found. When examining this by race and sex, white men were the only group to experience a statistically significant relationship between the two variables, while black men, black women, and white women did not. Blacks did have smaller sampling sizes in comparison with whites however, which could explain the lack of statistical significance for this group.
33
Kunin & Rodin 1982). These articles suggest that there may be a relationship between attractiveness and preferential treatment, which is supported by the results in this paper. The literature on racial bias might have suggested that when race and another status characteristic are matched against one another, race would trump (Lewis 2010; Reece 2015; Ho & Roberts 2015; Omi & Winant 2015). This implies that people’s perceptions of one’s race would trump their opinions of a person’s attractiveness. For example, the idea goes that if a white person is
34
representational measures for expressing racial bias in observing attractiveness) by people and therefore would limit the discrimination whites receive altogether while increasing it for blacks. This does not explain the entirety of the results, however, but only provides some explanation to the numerical values of blacks and white’s attractiveness and why the discrepancies between perceptions of the respondent’s attractiveness by race might have existed.
Strengths and Weaknesses
A notable strength of this project has been the use of the Add Health dataset in making my findings. This has been helpful in providing me with a large sample size (4,890 participants), which allows my findings a greater level of generalizability (the more participants, the greater likelihood in gaining statistically significant findings). This, along with being able to incorporate the response questions from the dataset, has hopefully helped my findings provide greater
representation of the general public, which hopefully allows this study to be more generalizable.
35
literature on the relationship between the variables and different sexes could help isolate possible forms of gender discrimination, which would hopefully give some greater perspective on
racialized discrimination as well, ultimately helping to form a greater correlation between attractiveness and generalized discrimination as a whole (generalized discrimination including both gender and racialized forms). Another limitation that this project has been presented with, that would have helped tremendously if the information were more readily available, is the race of the interviewers. This would have been great to know in so far as being able to test for racial bias in the interviewer thumbnail sketch when the interviewers are judging the attractiveness of the respondents. What could have been uncovered here, possibly, is a connection between interviewers racial bias against blacks and their ratings of attractiveness, in the sense that white interviewers were more likely to rate blacks (even those who are attractive) as unattractive more often due to racial bias. Even though this hypothesis was not tested in the paper, a quick glance at the frequency of attractiveness for both groups shows that more blacks were rated as
“unattractive/very unattractive” than “attractive/very attractive” (672 rated unattractive to 571 rated attractive), while more whites were rated as “attractive/very attractive” than those rated “unattractive/very unattractive” (1,758 rated unattractive to 1,899 rated attractive). If true, this could suggest that attractive blacks experience more discrimination simply because they are not even seen as attractive by a majority of white society, so any reward they could reap for their attractiveness would be nullified by the racialized perception by whites that they are unattractive.
Implications
36
1996), and the findings from this project could be supporting the idea. That being said, it is possible that it can be noted that being unattractive is simply a tax on life outcomes in a way. Being unattractive means that someone (or a group of people) may treat you differently, or with more discrimination. Being attractive, from the findings, only has a statistically significant relationship with reducing discrimination for white males, and appears to do little for them at that. The little affect attractiveness has on discrimination for the population at large seems to be imprinted onto the affect it has on whites, which is similarly small (these are the only two groups with a statistically significant relationship).
Another perspective to consider when understanding these results is the concept of homophily mentioned earlier in this paper (McPherson & Lovin, 2001). Homophily suggests that actors consistently choose other actors with similar sociodemographic, behavioral, and
37
biological process. I think this is important to note because it can help to provide a different approach to understanding racial bias, and the processes that create/recreate its existence.
CONCLUSION
In this research, I sought to test a possible association between attractiveness and discrimination. Furthermore, I looked to discover how racial bias might affect this relationship. Literature discussing the relationship between status and attractiveness suggested that one’s attractiveness and the discrimination one receives should be negative. Furthermore, literature discussing the effect race might have on how people gauge the attractiveness of others suggested that those there is a racial hierarchy to attractiveness, whereas the darker one is the less attractive they might be considered. More literature on racial theory, discussing race as being a master category of judgment, might provide insight on the relationship between race and attractiveness so far as ones status is immediately affect by a person’s race (assuming a relationship between status and attractiveness does indeed exist). Ultimately, the results suggested a negative, observable relationship between ones attractiveness and the amount of discrimination they felt they received. However, this relationship only held for the general population and whites (who, not coincidentally, make up a majority of the population being studied). For black respondents, the relationship between attractiveness and discrimination was not observed, possibly indicating racial bias in the form of a hierarchy of attractiveness. It is difficult to measure this lack of
association for blacks as racial bias however, as the results for this group would be explained less so by the racial theories presented, and more so by a simple lower numerical count in sample size. Future research on this subject could include understanding concepts of group
38
39 REFERENCES
Berger, Joseph & Rosenholtz, Susan & Zelditch, Morris. 1980. “Status Organizing Processes”. Annual Sociology Review.
Bonilla-Silva, Eduardo. 2010. Racism without Racists. Rowman and Littlefield Publishers. Coetzee, Greeff, Stephen, & Perrett. 2014. “Cross cultural agreement in facial attractiveness
preferences: The role of ethnicity and gender”. PLoS ONE.
Dion, Karen & Bersheid, Ellen. 1974. “Physical Attractiveness and Peer Perception among Children”. Sociometery.
Ho, Arnold & Roberts, Steven. 2015. “Essentialism and Racial Bias Jointly Contribute to the Categorization of Multiracial Individuals”. Psychological Science.
Jiang, Yuexin, Bolnick, Daniel & Kirpatrick, Mark. 2013. The American Naturalist. The University of Chicago Press.
Joshi, K. & Rai, S.N., 1989. “Effect of Physical Attractiveness and Social Status upon Interpersonal Attraction.” Psychological Studies, 34(3), 193-197.
Kunin, Carla & Rodin, Miriam. 1982. The Interactive Effects of Counselor Gender, Attractiveness, and Status. Journal of Clinical Psychology.
Lewis, Michael. 2011. “Who is the Fairest of them All: Race, Attractiveness and skin color sexual dipmorphism” Personality and Individual Differences 50(2), 159-162.
Mazella, Ronald & Feingold, Alan. 1984. “The Effects of Attractiveness, Race, Gender, and SES on Mock Juries”. Journal of Applied Social Psychology.
40
Muller, Ulrich & Mazur, Allan. 1996. “Facial Dominance of West Point Cadets as a Predictor of Later Military Rank”. Social Forces 74(3) 823-850.
Omi, Michael & Winant, Howard. 2015. Racial Formations in the United States. Routledge. Pager, D. & Shepherd, H. 2008. “The Sociology of Discrimination: Racial Discrimination in Employment, Housing, Credit and Consumer Markets.” Annual Review of Sociology, 1:34: 181-209.
Pincus, F., 1996. “Discrimination Comes in Many Forms: Individuals, Institutional, and Structural.” American Behavior Scientist, 40 (2): 186-194.
Reece, Robert. 2015. “What are you Mixed With? The Effect of Multiracial Identification on Perceived Attractiveness.” Review Black Political Economy. 1-9.
Rhodes, Gillian. 1998. Facial Symmetry and the Perception of Beauty. Psychonomic Bulletin. Ridgeway, L., Cecilia. 2014. “Why Status Matters for Inequality”. American Sociological