Cytokine Profiles in Obese African Americans following Influenza Vaccination By
Hussein Ahmad Ahmad
Honors Thesis
Department of Nutrition-Gillings School of Global Public Health University of North Carolina
2015
Advisor: Melinda A. Beck
ACKNOWLEDGMENTS
ABSTRACT
Obesity is one of modern day’s most serious public health concerns, costing billions of dollars and claiming millions of lives every year. In addition to being a co-morbidity for significant health concerns and diseases, obesity has been proven to have significant negative effects on the effectiveness of vaccination for the influenza virus. The influenza virus is responsible for killing more than 5% of those who contract it. This study looks at IL-6 and CRP, inflammation cytokines, to look at the whether increased
serum levels of IL-6 and CRP in subjects with higher BMI values result in reduced responses to vaccination. Results showed that there was no significant correlation
between IL-6 levels and CRP levels and response to vaccination. Obese subjects did have higher levels of these cytokines than literature values for healthy weight individuals. Older individuals and high responders to the vaccination were both linked to lower levels of IL-6 within the serum. Although no significant results were found, this study should be
TABLE OF CONTENTS
Chapter 1: Introduction………5
1.1Obesity……….………..5
1.2Influenza Virus……….………..6
1.3Influenza Vaccine……….…...7
1.4Obesity and Influenza Vaccine……….…….…………9
1.5C-Reactive Protein………..…………...9
1.6Interleukin-6………...10
Chapter 2: Specific Aims and Hypotheses……….13
Chapter 3: Methods………14
3.1 Study Design ………...14
3.2 Serum Collection……….15
3.3 Hemagluttination Inhibition Assay for Serum Samples………..15
3.4 ELISA for IL-6 and CRP……….16
3.5 Data Analysis………...19
Chapter 4: Results………..20
4.1 Demographics of the Study Population………...20
4.2 Cytokine Levels in Serum (IL-6 and CRP)………..21
Chapter 5: Discussion………28
5.1 Conclusions ……….28
5.2 Limitations and Recommendations for Further Studies………..29
CHAPTER 1: INTRODUCTION 1.1 Obesity
Obesity has quickly become one of America’s most predominant public health concerns. More than one third, or a total of 78.6 million U.S. adults are obese while 2 out of three adults are considered to be overweight or obese. Since the early 1960s, the prevalence of obesity among adults more than doubled, increasing from 13.4 to 35.7 percent in U.S. adults age 20 and older.1
Obesity is a multifaceted disorder associated with an excessive amount of fat dispersed throughout the body. Excess body fat increases the likelihood of health problems and diseases such heart disease, stroke, high blood pressure, certain types of cancer, and type 2 diabetes. Furthermore, the obesity epidemic costs the United States more than $148 billion a year, with medical costs for obese individuals being $1,429 higher than those of healthy weights. In addition to being a cosmetic and physical concern, obesity may also result in social and psychological concerns.
Obesity can be determined through skinfold tests, waist circumference measures, bioelectric impedance, underwater weighing, or most commonly through the calculation of an individual’s body mass index (BMI).3
An individual’s BMI is calculated by dividing one’s weight in kilograms by their height squared in meters. According to the Centers for Disease Control and Prevention (CDC), an adult with a BMI lower than 18.5 is classified as underweight, an adult with a BMI between 18.5 and 24.9 is classified as healthy weight, an adult with a BMI between 25.0 and 29.9 is classified as overweight, and an adult with a BMI 30.0 and above is classified as obese. The most obvious
limitation to this practice is that BMI makes no distinction between the weight of adipose fat and the weight of muscle. Individuals with developed muscles commonly have much higher BMIs and may be incorrectly diagnosed as overweight or obese.
1.2 Influenza Virus
Influenza is one of the most commonly spread infectious viruses, affecting between 5 and 20% of affected Americans every year.8
Influenza is a serious illness that can lead to hospitalization or even death. Symptoms of influenza include fever, runny nose, coughing, sore throat, muscle aches, fatigue, and headaches. Flu virus transmission or “flu season” most commonly occurs in the fall and winter seasons. Populations
humans and some animals. Influenza A is composed of 8 RNA segments and is classified into subtypes that depend on which hemmagglutinin (HA) protein and neuraminidase (NA) protein rests on the viral surface. Furthermore, there are 18 hemagglutinin subtypes and 11 neuraminidase subtypes.10
These hemmagglutinin and neuraminidase subtypes make up the name of each flu virus. The letters and numbers stand for specific
components of the virus that set it apart from others.14
In the case of H3N2, the virus has hemagglutinin type 3 (H3) and neuraminidase type 2 (N2), constituents that occur on the
surface of the virus.
The influenza virus is especially potent because it changes so rapidly through antigenic drift and antigenic shift.11
Antigenic drift is a mechanism for variation by viruses that involves the accumulation of mutations in the HA and NA viral genes that alter the antibody-binding sites so that the mutated viruses escape from antibodies generated from the unmutated virus. Although the changes may be miniscule, the new virus may not be recognizable by immune cells, making rapid transmission much more likely. Antigenic drift occurs in both influenza type A and influenza type B viruses. Antigeneic shift is a much more exceptional phenomenon and occurs when a new viral strain forms from two different HA and NA proteins to produce a new strain.11
1.3 Influenza Vaccine
immune system to quickly respond and destroy the virus or agent when it comes into contact.
Everyone 6 months of age or older should get the yearly flu vaccine as early in the flu season as possible. The flu vaccination is usually offered by September but is
continually available through the end of the flu season.8
Since it takes almost two weeks after vaccination for antibodies to develop in the body that protect against the influenza virus infection, it is recommended that people get vaccinated as early as possible so that they are protected before influenza begins spreading in their community.11 A flu vaccine is needed on an annual basis because the body’s immune response from vaccination declines over time and because flu virus changes every year, meaning a previous year’s vaccine will not suffice. Flu vaccines are manufactured in advance based on predictions of the upcoming season’s strain. For the 2010-2011 year, the seasonal trivalent flu virus was composed of two subtypes of type A influenza and one subtype of type B influenza.12 There is still a possibility of getting the flu even after getting vaccinated. Factors that affect the ability of the flu vaccine to protect a person include the health status and age of the person being vaccinated. Additionally, the vaccine can only be effective if the viruses used to make the vaccine match those circulating.8
After vaccination, the immune system responds to the antigens in the vaccine to destroy the virus. This stimulates memory B and T cells to recognize the antigen and quickly respond to the influenza strain upon later contact. Antigen-specific B
lymphocytes that were induced during the original exposure remain in the body so that cells can quickly remove the infection once it returns.9
1.4 Obesity and Influenza Vaccination
Obesity has been determined to be associated with impaired immune response to influenza vaccination.13
An ongoing prospective observational study at the University of North Carolina studied any potential links between a higher BMI and immune response to the influenza vaccine in human samples. Data from the first two years of the study revealed that obese and healthy weight individuals increased their IgG antibodies specific for the vaccine one month after vaccination. Conversely, the obese population had a greater decline in antibody titers than the healthy weight population one-year post-vaccination13. This decline in antibody titers in the obese population demonstrates that
the obesity may have a diminished the immune response to the influenza vaccine.
Obese individuals showed decreased CD8+ T cell activation and a lower amount of functional proteins in comparison to healthy weight individuals. Additionally, diet-induced obese mice have greater mortality rates to influenza infection and decreased innate immune response in comparison to healthy weight mice.13
1.5 C-Reactive Protein
C-Reactive Protein (CRP) is a critical component of the immune system produced by the liver and released into the blood after infection, tissue injury, or another source of inflammation. CRP is a complex set of proteins that was discovered in 1930 as a native protein and member of the small pentraxins family5
macrophages and adipocytes. Infections, tissue injury, and inflammatory diseases cause the release of IL-6 among other cytokines that simulate the production of CRP by the liver. Serum CRP levels rise within two hours of inflammation by up to a 50,000-fold amount.4
With a consistent half-life of 48 hours, CRP levels are influenced by the rate of production and therefore often used a screening for inflammation.
Genetic and lifestyle factors affect the amount of CRP an individual creates. Those who smoke, fail to exercise adequately, or have high blood pressure tend to have high levels of CRP.4 Lean and athletic individuals of healthy weight tend to have lower levels of CRP in comparison. Genetic factors play an overbearing role in the variation of CRP levels as serum levels are inherited from parents and grandparents to children. Increased levels of CRP result in increased levels of inflammation, a vital process for warding off bacteria, wound healing, and for many critical processes for survival. Recent research has revealed that too much inflammation in some circumstances can have adverse effects, predominantly on the blood vessels that carry oxygen and nutrients
throughout the body.5
Atherosclerosis (the process that leads to cholesterol accumulation
in the arteries) is essentially an inflammatory disorder of the blood vessels, just as
arthritis is an inflammatory disorder of the bones and joints. Studies have also revealed
blood markers that reflect the inflammatory process are elevated among individuals at
high risk for future heart disease. Until recently, available markers of inflammation were
not suitable for use in physicians’ offices but CRP is very stable and easy to measure.
1.6 Interleukin 6
stimulate immune response to trauma, infection, or other tissue damage that leads to inflammation and the secretion of IL-6. IL-6 is capable of crossing the blood-brain barrier and beginning synthesis of prostaglandin E2 in the hypothalamus to increase the body’s temperature. IL-6 may also be secreted by macrophages in response to pathogen
associated molecular patterns. These patterns bind to pattern recognition receptors in the innate immune system to induce intracellular signaling cascades that result in
inflammatory cytokine production.
As a myokine, or a cytokine produced from muscle, IL-6 levels are elevated in response to muscle contraction. Therefore, it is significantly elevated with exercise and appears before other cytokines in the circulation. IL-6 signals through a type 1 cytokine receptor complex composed of the IL-6R alpha chain and the signal-transducing gp130 component.
The secretion of IL-6 is regulated by several physiologic and pathologic factors: hormones, cytokines, diet, physical activity, stress, hypoxia, and others. IL-6 plays a role in stimulating autoimmune and inflammatory processes in diseases such as depression, atherosclerosis, arthritis, diabetes, and some cancers. It is produced by many body cells such as adipose and liver cells but it is important to note that adipose tissue accounts for around 30% of IL-6 production. IL-6 release is related to adipose cells size and
resultantly increased in obesity. Elevated levels of IL-6 also induce insulin resistance in liver and adipose cells by reducing the expression of insulin resistance substrate-1 (IRS-1)6
in adipose cells, further extending both the signaling and effector sections of insulin resistance.
CHAPTER 2: SPECIFIC AIM AND HYPOTHESIS Specific Aim: To measure the levels of IL-6 and CRP in obese African-American females and look for correlations between said levels and BMI, age, and vaccine response.
CHAPTER 3: METHODS
3.1 Study Design
The subjects in this study were chosen from participants in an ongoing and prospective observational study at the University of North Carolina Family Medicine Center in Chapel Hill, NC. The parent study enrolled participants at least 18 years of age who were scheduled to receive the 2010-2011 inactive, trivalent seasonal flu vaccine. Participants were excluded if they had the following criteria: pregnant or breastfeeding women, self-reported use of immunomodulator or immunosuppressive drugs in the last 4 weeks, acute febrile illness, diseases such as HIV, hepatitis C, and cancer, and a history of hypersensitivity to any influenza vaccine components,
Informed consent, height, weight and baseline blood samples were collected from each participant at enrollment. They were then injected with one dose of the 2010-2011 trivalent inactive (0.5 mL Fluzone (Sanofi Pasteur, Swiftwater, PA, USA)
A/California/7/2009 (H1N1)-like, A/Perth/16/2009 (H3N2)-like, and B/Brisbane/60/2008 (Victoria lineage)-like antigens) directly into their deltoid muscle. Participants returned to the UNC Family Medical Center 25-35 days after administration of the vaccine to collect a post-vaccination blood sample. Serum and peripheral blood mononuclear cells were isolated in both blood samples after collection. For this study, 19 total serum samples were used from African American women that did not smoke and that did not have diabetes. Ages ranged from 20 to 77 years old and BMIs fell between 30 and 61.4.
3.2 Serum Collection
Serum was collected before receiving the vaccine and then again 25-30 days after receiving the vaccine. Pre- and post-vaccine blood draws were collected at the UNC Family Medicine Center in Chapel Hill, NC. Blood samples were collected into a vacutainer tube and then allowed to clot at room temperature for 30-60 minutes before being refrigerated at 4°C. The blood samples were then centrifuged at 800 x g for 10
minutes at 4°C using the IEC Centra MP4R. Following the centrifugation, 0.5 mL of the serum was aliquoted into 1.2 mL serum tubes and then stored in a freezer at a
temperature of -80°C.
3.3 Hemagglutination Inhibition Assay
The hemagglutination inhibition assay is used to measure flu-specific antibody
levels in blood serum. Serum antibodies to the hemmagglutinin surface glycoprotein
(HA) interfere with the virus’s ability to attach to red blood cells in this assay.
Hemagglutination of the red blood cells is inhibited when antibodies are present at a
sufficient concentration to bind the virus and prevent attachment to the red blood cells.
Serial dilutions of serum are added to a known concentration of virus and red blood cells.
The HAI titer is the highest dilution of serum that prevents hemagglutination. If the
serum contains no antibodies that recognize the influenza strain HA, then red blood cell
hemagglutination will be observed in all serum dilutions.
The HAI process began by treating the serum to be tested with
samples were cooled after being heat inactivated at 56°C for 1 hour and then 6 parts of physiological saline were added. The samples were frozen for 4 hours before use. The influenza stock virus was diluted to 8 HAU/50 ul and turkey RBCs were diluted to a concentration of 1% solution. Serial dilutions of test serum were added in duplicate to the wells of 96-well round bottom plates. Virus and RBCs were added to each well. Positive
controls, negative controlT, and back titrations of the virus (to confirm virus
concentration prior to performing the HAI) were also added to each plate.
Hemagglutination was then read after 30 minutes at room temperature. If serum antibody
is present, hemagglutination of the RBC will be inhibited. The HAI titer is the reciprocal
of the last dilution of serum that completely inhibits hemagglutination.
3.4 Enzyme-Linked Immunosorbent Assay (ELISA) for Interleukin 6 (IL-6) and C-reactive protein (CRP)
was added to the wells and color developed in proportion to the amount of CRP or IL-6 bound in the primary step. The color development was then stopped and the intensity of the color was measured by measuring the optical density using a microplate reader to determine the amounts of CRP and IL-6. A standard curve was created for each experiment and then the results were compared to each respective standard curve. The standard curve was created by plotting the mean absorbance for each standard on the y-axis against the concentration on the x-y-axis, and then drawing curve of best fit through the points on the graph. This color change signal was measured with an ELISA plate reader by measuring the absorbance at 450 nm. Increased enzyme activity (detected by a darker color reaction and higher optical density reading) was directly correlated with CRP or IL-6 concentration.
The ELISA procedures took one full day and were run concurrently. For the CRP assay, 100 μL of Assay Diluent and 50 μL of the standard or sample were added before being incubated for 2 hours. Each well was then aspirated and washed four times before adding 200 μL of CRP conjugate to each well and incubating for 2 hours at room temperature. The wash process was then repeated and 200 μL of substrate solution was added before incubated for 30 minutes at room temperature. 50 μL of stop solution were added and then the optical density of each well was recorded using a microplate reader. For the IL-6 assay, all the steps were similar except 100 μL of the standard or sample were added before the initial incubation. Additionally, the last incubation step after adding the substrate solution was 20 minutes rather than 30 minutes.
Specific Details for Analysis CRP and IL-6 levels in Serum using ELISA: Materials
Plate covers/sealers
Multi-channel precision pipettors with disposable plastic tips Plate Reader
Reagents
CRP Conjugate 21 mL of monoclonal antibody against CRP conjugated to horseradish peroxidase with preservatives
CRP Standard 50 ng of recombinant human CRP in a buffered protein base with preservatives
Assay Diluent RD1F 6 mL of a buffered protein base with preservatives Calibrator Diluent RD1F 21 mL of a buffered protein base with preservatives Wash Buffer Concentrate 21 mL of a 25-fold concentrated solution of buffered
surfactant with preservatives
Color Reagent A 12 mL of stabilized hydrogen peroxide Color Reagent B 12 mL of stabilized chromogen
Stop Solution 6 mL of 2 N sulfuric acid Human Serum Serum samples of participants Table 1. Reagents used during CRP ELISA.
IL-6 Conjugate 21 mL of polyclonal antibody specific for human IL-6 conjugated to horseradish peroxidase with preservatives IL-6 Standard 1.5 ng of recombinant human IL-6 in a buffered protein
base with preservatives then lyophilized
Assay Diluent RD1W 11 mL of a buffered protein base with preservatives Calibrator Diluent RD5T 21 mL of a buffered protein base with preservatives Calibrator Diluent RD6F 21 mL of animal serum with preservatives
Wash Buffer Concentrate 21 mL of a 25-fold concentrated solution of buffered surfactant with preservatives
Color Reagent A 12 mL of stabilized hydrogen peroxide Color Reagent B 12 mL of stabilized chromogen
Human Serum Serum samples of participants Table 2. Reagents used during IL-6 Elisa
3.5 Statistical Analysis
CHAPTER 4: RESULTS 4.1 Demographics of the Study Population
The 17 participants were obese African-American females who were non-diabetic, did not smoke, and had a BMI over 30. African-Americans were the focus of this study because they are an understudied population. Participants of this study were broken down into two different categories on three occasions based on their BMI, age, and response rates to HAI titers of the H3N2 Perth virus. Low obese BMI was defined as
≤35 and high obese BMI as >35. Low age was defined as ≤50 and high age as >50. A low response to the H3N2 titer was defined as ≤240 and high response was defined as >240.
Participant-ID Age BMI Gender Race Diabetes Smoking
03-602-02 59 30.4 Female aa no No
03-971-02 42 35.0 Female aa no No
03-681-02 46 38.8 Female aa no No
03-738-02 42 52.4 Female aa no No
03-783-02 26 36.6 Female aa no No
03-817-02 64 31.8 Female aa no No
03-934-02 53 33.8 Female aa no No
03-633-02 54 38.6 Female aa no No
03-815-02 57 30.3 Female aa no No
03-978-02 54 34.1 Female aa no No
03-939-02 77 31.5 Female aa no No
03-948-02 23 54.7 Female aa no No
03-733-02 48 38.5 Female aa no No
03-714-02 51 41.1 Female aa no No
03-804-02 63 36.1 Female aa no No
03-552-02 37 61.4 Female aa no No
03-671-02 20 36.5 Female aa no No
Table 3. Demographics of the participants in this study. All the participants were African-American women with BMIs between 30.4 and 61.4 kg/m^2 . The average age of the participants was 48 and the average BMI was 38.9.
High Age Group Low Age Group Low BMI Group High BMI Group Low HAI Group High HAI Group
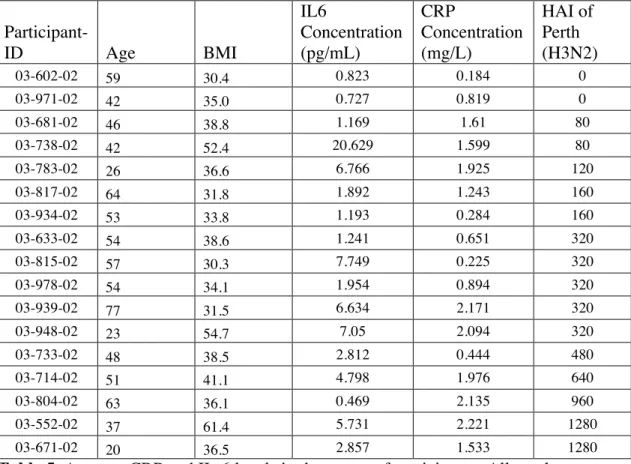
4.2 Cytokine Levels in Serum (IL-6 and CRP)
Participant-ID Age BMI
IL6 Concentration (pg/mL) CRP Concentration (mg/L) HAI of Perth (H3N2)
03-602-02 59 30.4 0.823 0.184 0
03-971-02 42 35.0 0.727 0.819 0
03-681-02 46 38.8 1.169 1.61 80
03-738-02 42 52.4 20.629 1.599 80
03-783-02 26 36.6 6.766 1.925 120
03-817-02 64 31.8 1.892 1.243 160
03-934-02 53 33.8 1.193 0.284 160
03-633-02 54 38.6 1.241 0.651 320
03-815-02 57 30.3 7.749 0.225 320
03-978-02 54 34.1 1.954 0.894 320
03-939-02 77 31.5 6.634 2.171 320
03-948-02 23 54.7 7.05 2.094 320
03-733-02 48 38.5 2.812 0.444 480
03-714-02 51 41.1 4.798 1.976 640
03-804-02 63 36.1 0.469 2.135 960
03-552-02 37 61.4 5.731 2.221 1280
03-671-02 20 36.5 2.857 1.533 1280
Table 5. Average CRP and IL-6 levels in the serum of participants. All results were derived from the ELISA plate reader.
Mean IL6 (pg/mL) CRP (mg/L) HAI for H3N2 Low BMI 4.742714286 1.094857 85.714
High BMI 4.1295 1.4344 624
Table 6. Average IL6 and CRP values for the low and high BMI groups.
The data was taken from the plate reader and then analyzed using Prism’s
Graph 2. The CRP serum levels (in mg/L) for the low obesity and high obesity groups were 0.8314 ± 0.2697, n=7 and 1.619 ± 0.1944, n=10, respectively. There was no significant difference to conclude a link between BMI and CRP serum levels., as the p-value was 0.6598.
There seems to be a trend in this data towards higher levels of CRP in the high BMI group. Statistical significance is not reached though because of a limited number of subjects.
Graph 6. The CRP serum levels (in mg/L) for the low and high age groups were 1.531 ± 0.2174, n=8 and 0.9490 ± 0.2736, n=8, respectively. There was no significant difference to conclude a link between age and CRP serum levels., as the p-value was 0.5593.
CHAPTER 5: DISCUSSION 5.1 Conclusions
A subset of obese, non-diabetic, non-smoking African American women were investigated in this study to better understand factors that contribute to the variation in responses to the influenza vaccination. The original hypothesis stated that increased levels of IL-6 and CRP in subjects with a high BMI would be correlated with a lower response to vaccination. Obese individuals typically have higher levels of inflammation, and consequently, higher levels of IL-6 and CRP. Adipocytes serve as not only a means of storage for body energy but also as endocrine organs with metabolic roles that regulate the body’s physiology. Enlarged adipocytes in obese individuals promote inflammation through the recruitment of macrophages and the release of factors that also prompt insulin resistance.15
This study confirmed that obese individuals had higher
concentrations of IL-6 and CRP compared to healthy weight individuals. It is important to note though that increasing obesity did not lead to an increase of in inflammatory markers within this study. This lack of significance may be attributed to the limited and non-diverse sample size, with respect to varying obesity.
Overall, no significant link was found between increasing obesity and response to the influenza vaccine. Once an individual reaches obesity, or a BMI over 30, the levels of inflammation rates more or less taper off and become stagnant. Increases in obesity have not been shown to increase inflammation at the rate at which an individual approaching obesity would. Both IL-6 and CRP serum levels were deemed independent of body mass index. Both IL-6 and CRP serum levels were higher in these obese subjects than the normal levels for healthy weight people, which average below 1.0 mg/L.16
group had an average level of 1.09 mg/L and the high BMI group had an average level of 1.43, further signifying that increased weight increases CRP levels. Increased body weight results in higher rates of inflammation so these results make sense. Normal IL-6 levels are between 1-2 ug/mL.17
The lower BMI group had an average of 4.74 ug/mL of IL-6 in their serum while the high BMI group had an average of 4.12 ug/mL. These results are consistent with obese individuals having higher serum levels. The fact that the lower weight group had larger values than the higher way group may be a result of a rather limited sample size.
The results from this experiment confirmed that there was statistically significant data to show a link between IL-6 serum levels and a response the HAI titer for the H3N2 virus. The higher response group had lower IL-6 serum levels and the lower response group had high IL-6 serum levels. IL-6 is a cytokine that serves a variety of immune functions in response to acute illness or injury. As a pro-inflammatory cytokine, IL-6 is involved in activating inflammatory pathways. If IL-6 levels are low, then the body does not require any inflammation and is in a generally healthy state. Additionally, a
significant difference was found to support a link between IL-6 serum levels and age. Younger subjects had higher IL-6 serum levels than older subjects.
CRP is produced by the liver and rises when there is inflammation throughout the body. Its purpose is to activate the complement system, which helps antibodies clear pathogens from organisms, by attaching to dead cells after IL-6 is released. Surprisingly this particular study established links between age, HAI response, or BMI for CRP serum levels. These unforseen results may have been attributable to the small sample size.
This study had multiple limitations that may have skewed or produced inaccurate data. The CRP and IL-6 ELISA kits were both expired at the time of the experiment. This may have resulted in degraded standard and stopping solutions, and as a result produced inaccurate data outcomes for the subjects. Additionally the kits mays have lost a
significant amount of sensitivity in the process. A degraded standard would have compared sample values to an incorrect value while a degraded stopping solution may have lost its effectiveness in stopping the reaction after the substrate was added because of a decreased concentration. This ineffective stopping reagent would have resulted in overvalued concentrations of IL-6 and CRP in the samples. This limitation could be avoided in future experiments by procuring new ELISA kids ahead of time to ensure all products and solutions create accurate data.
Another limitation of the experiment is that procedural mistakes may have occurred in the ELISA process. Four ELISA experiments were conducted concurrently, increasing the potential risk of error. Meticulous following of protocol is essential to ensuring accurate results. The subject samples were dispersed throughout the lab and had to be acquired in a timely manner before beginning the experiment. This resulted in the samples being thawed and refrozen on multiple occasions before being processed in the ELISA. The freezing and thawing process affects the levels of cytokines in the plasma. In future experiments, it is imperative that ELISA experiments are run immediately after the serum is collected.
REFERENCES
1. Key Facts about Obesity. [Internet]. Atlanta (GA): Center for Disease Control and Prevention; [2013 Sep 29] Accessed March 7, 2015.
<http://www.cdc.gov/obesity/data/adult.html>
2. Kitahara CM, et al. Association between Class III Obesity (BMI of 40–59 kg/m)
and Mortality: A Pooled Analysis of 20 Prospective Studies. PLOS Medicine.
[July 8, 2014]. Accessed April 7, 2015.
3. Forhan, Mary, and Ximena Ramos Salas. "Inequities in Healthcare: A Review of Bias and Discrimination in Obesity Treatment." Canadian Journal of Diabetes (2010): 205-09. Print. Accessed April 7, 2015.
4. Bassuk, Shari S., Nader Rifai, and Paul M. Ridker. "High-sensitivity C-reactive Protein." Current Problems in Cardiology (2003): 439-93. Print. 8 April 2015. 5. Ridker, P. M. "High-Sensitivity C-Reactive Protein as a Predictor of All-Cause
Mortality: Implications for Research and Patient Care." Clinical Chemistry
(2008): 234-37. Print. 8 April 2015.
6. Despres, Jean-Pierre. “Treating the Patient with low HDL –cholesterol: Are we chasing the Right Target?” University Laval. 2007. Print. 8 April 2015.
7. Martin, Klabusay, Kohutova Viera, Coupek Petr, Nenickova Marie, and Tesarova Eva. "Simultaneous Analysis of Cytokines and Co-stimulatory Molecules
Concentrations by ELISA Technique Andof Probabilities of Measurable
8. Key Facts about Influenza (Flu) & Flu Vaccine. [Internet]. Atlanta (GA): Center for Disease Control and Prevention; [2013 Sep 26,. Accessed March 7, 2015. <http://www.cdc.gov/flu/keyfacts.htm>
9. How Flu Spreads. [Internet]. Atlanta (GA): Center for Disease Control and Prevention; [2013 Sep 12] Accessed March 7, 2015.
<http://www.cdc.gov/flu/about/disease/spread.htm>
10.Types of Influenza Viruses. [Internet]. Atlanta (GA): Center for Disease Control and Prevention; [2014 Jan 15] Accessed March 7, 2015.
<http://www.cdc.gov/flu/about/viruses/types.htm>
11.Key Facts about Influenza (Flu) & Flu Vaccine. [Internet]. Atlanta (GA): Center for Disease Control and Prevention; [2013 Sep 26,. Accessed March 7, 2015. <http://www.cdc.gov/flu/keyfacts.htm>
12.Fiore, Anthony. "Seasonal Influenza Vaccines." Microbiology and Immunology
333 (2009): 43-82. Print. 5 April 2015.
13.Sheridan, PA, Paich HA et. al. 2012. Obesity is associated with impaired immune response to influenza vaccination in humans. International Journal of Obesity [Print]. 36: 1072-1077. 8 April 2015.
14. "How Is the Flu Virus Named." Tampa Bay 1 Jan. 2009. Print. 6 April 2015. 15.Greenberg, Andrew, and Martin Obin. "Obesity and the Role of Adipose Tissue in