The Impact of Obesity Reversal on Breast Cancer-Promoting Chronic Inflammation: The Role of Diet Type and Gut Microbiota
Meghana Shamsunder
Honors Thesis Department of Nutrition
Gillings School of Global Public Health University of North Carolina at Chapel Hill
April 27, 2016
Approved by:
Abstract
Introduction: Obesity is growing epidemic and risk factor for the development of breast cancer. Studies conducted to date have not shown a consistent relationship between weight loss and the risk of cancer development however there has been an increasing focus on calorie restriction diets and intermittent energy restriction diets and their impact on breast cancer progression. We aimed to improve the understanding of how different energy restriction diets affect obesity-associated, tumor-promoting inflammation in breast cancer and the role of gut microbiota in this inflammation.
Methods: Female C57BL/6 mice were randomized onto control diet (n = 20) and diet induced obesity diet (n = 80). At week 15, the diet induced obesity (DIO) group was randomized to four different groups: mice that remained on DIO diet, a high-carb calorie restriction diet, a low-carb calorie restriction diet, and an intermittent energy restriction diet. At week 25, mice were injected with a mixture of E0771 cells. Three to four weeks later, a final sacrifice was performed. Serum and tissue samples were collected and analyzed to determine significant differences in body composition, tumor weight and size, serum hormone and adipokine levels, and local mRNA expression of cytokines and proteins.
Results: The obese group had significantly greater body weight, visceral white adipose tissue, and more severe tumor outcomes than the Control and the calorie restriction groups (High Carb Calorie Restriction, Low Carb Calorie Restriction, and Intermittent Energy Restriction). Additionally, the obese group had significant dysfunctional changes in serum hormones and adipokines and greater expression of pro-inflammatory cytokines than anti-inflammatory cytokine. The calorie restriction groups reversed this. Lastly, the obese group presented with a more permeable gut epithelium and lower expression of colonic occludin that maintains gut impermeability. This led to increased serum
lipopolysaccharides in the obese group. There was little to no reversal of these changes in the calorie restriction groups.
Table of Contents
1. Introduction 5
a. Obesity 5
b. Cancer 5
c. Gut and Microenvironment 6
d. Interventions to Combat Obesity 8
2. Goal and Hypotheses 10
3. Methods 11
a. Diet Type 11
b. Weight and Tumor Analysis 12
c. Stool Analysis 12
d. Serum Analysis 12
e. mRNA Expression Levels 13
f. Serum Endotoxin 13
g. Statistical Analysis 13
4. Results 14
a. Body Weight, Percent Body Fat, and VWAT Analysis 14 b. Tumor growth and invasion, final tumor volume,
and final tumor weight 15
c. Serum IL-6, Hormones and Adipokines analysis 17
d. Mammary Fat Pad cytokine analysis 20
e. Tight Junction Protein, Occludin, and Serum LPS 22
5. Discussion 23
6. Conclusion 26
I would like to dedicate this manuscript to my mom and dad, both of whom have supported me in this endeavor and for my entire life. I would not be who I am today
Introduction
Obesity
Obesity is growing epidemic and health concern in the United States (US).
According to the Centers for Disease Control (CDC) more than one-third of US adults are obese (based off of population data collected between 2011 and 2012)1. The National
Institutes of Health (NIH) echoes these findings, reporting that more than two-thirds of US adults are either overweight or obese2.
Multiple factors contribute to the development of obesity, including
socioeconomic status, education level, age, sex, race/ethnicity, eating and physical activity habits, and genetic heritability. Obesity is implicated in an increased risk of cardiovascular disease, type II diabetes, and several types of cancers, including esophageal, pancreatic, colorectal, and breast3. While the direct mechanisms for how obesity increases the risk of cancer development are still being studied, several
possibilities have emerged, including dysregulated leptin and adiponectin secretion, high levels of insulin-like growth factor 1 (1), and hyperinsulinemia. High levels of IGF-1, a hormone that is anti-apoptotic and promotes cell growth4, have been consistently seen in obese individuals4 and may account for their increased risk of tumor
development. Additionally, insulin resistance and subsequent hyperinsulinemia, found in obese individuals, have been associated with increased inflammation, and growth5; all of which can contribute to increased tumor development.
Cancer
cell growth. In women, who make up about half US population, breast cancer is the second most common type of cancer. One out of every eight women in the US is expected to develop invasive breast cancer during her lifetime8. Although being
overweight or obese is a risk factor for breast cancer development9, the relationship between the two is complex and still under investigation.
Breast cancer results from unregulated cell growth within the breast tissue, and the most common form is ductal carcinoma (cancer within the ducts of breast tissue). There are four major molecular subtypes of breast cancer: luminal A, luminal B, triple negative, and HER2 type. The triple negative subtype tends to be more aggressive than luminal A and B and has a poor prognosis. This subtype is also negative in three different receptor types: estrogen receptor, progesterone receptor, and HER210.
Inflammation may be an important mechanism linking obesity to cancer
development. In obesity, increased adipose tissue can lead to secretion of increased levels of adipokines, cytokines, and chemo-attractants that promote growth and inflammation11. Inflammatory cytokines like interleukin 6 (IL-6), interleukin 1 beta (IL-1β), and tumor necrosis factor alpha (TNF-α) are overexpressed in the adipose tissue of obese
individuals12,13. These cytokines can also be found in the local tumor environment and have been shown to drive acute inflammation, promote cell growth, and prevent
apoptosis12,13. Increased inflammation in the local tumor environment or changes in other tissue types that promote inflammation are potential mechanisms by which obesity can increase breast cancer development.
In addition to other systemic changes, obesity is known to induce changes in the gut microenvironment and increased permeability of gut epithelium14. Although the role of these microorganisms is not completely understood, the gut microbiota are thought to provide additional metabolic functions including: fermentation of complex
polysaccharides, provision of additional energy-containing metabolites for the host to utilize, metabolism of bile acids, and metabolism of other molecules15 in the gut in cooperation with the host via “crosstalk”. This complex relationship between the gut microbiota and the host shows their interdependence. Therefore, severe systemic changes in the host, such as those that occur during obesity, can lead to changes in gut integrity and the gut microenvironment16.
It is known that gut microbiota change in response to the state of the host, whether they are lean or obese17. Transplantation of gut microbiota from an obese mouse into a germ-free mouse results in significant weight gain in comparison to germ-free mice transplanted with microbiota from a lean mouse18. This demonstrates that an obesogenic diet can induce changes in the gut microenvironment that further promote weight gain.
In obese individuals, the epithelial barrier function is impaired and allows for the translocation of certain molecules, such as lipopolysaccharides (LPS), into blood. LPS has been shown to induce inflammation and promote tumor growth19,20 and could
permeability and increased serum LPS may contribute to systemic inflammation in obesity that promotes tumor development.
Interventions to Combat Obesity
Studies conducted to date have not shown a consistent relationship between weight loss and the risk of cancer development. While some studies support that
intentional weight loss does reduce the incidence of obesity-related cancers21,22,23, others have shown no benefit. The International Agency for Research on Cancer (IARC) reported that avoiding weight gain has been shown to prevent cancer risk, but there was insufficient evidence to support the hypothesis that intentional weight loss reduces cancer risk24. Determining a direct association between intentional weight loss and cancer risk is difficult since few individuals maintain significant weight loss for a long period of time. Therefore, protective benefits of intentional weight loss in large populations are hard to study. However, calorie restriction (CR), a method for reducing weight, has been found to be protective against cancer development in mice25,26.
Diet and exercise interventions have been proposed and developed to combat and reverse obesity by primarily restricting calories. Such diet interventions/diet plans
The diet plans mentioned above are considered to be chronic or daily CR diets. While these daily CR diets have been shown to reverse the systemic perturbations
induced by obesity29, there has been an increasing focus on intermittent energy-restriction
Goal and Hypotheses
Goal:
To improve the understanding of how different energy restriction diets affect obesity-associated, tumor-promoting inflammation in breast cancer and the role of gut microbiota in this inflammation.
• Aim 1: Determine the impact of different energy diets on body weights, body composition, and serum metabolic hormones.
• Aim 2: Determine the impact of different energy diets on tissue inflammation markers by measuring serum marker levels and localized, pro-inflammatory gene expression in mammary fat pads.
• Aim 3:Characterize the impact of these diets on gut microbiota composition.
Hypotheses:
• Aim 1: Compared to control, DIO will promote greater levels of serum metabolic hormones (but lower levels of adiponectin). LCCR, HCCR, and IER will reverse the effects of DIO to some degree.
• Aim 2: Compared to control, DIO will promote greater levels of tissue inflammation markers (but lower levels of IL-10). LCCR and IER will show greater reversal of DIO effects when compared to HCCR.
Methods
Female C57BL/6 mice were randomized to receive a control diet (10% kcal from fat, n=20) or diet-induced obesity (DIO) diet (60% kcal from fat, n=80) and housed two per cage. After 15 weeks on the control or DIO diet, the control mice continued on the same diet, and the DIO mice were randomized to continue on the DIO regimen (n=20) or change to one of three CR diets (n=20/group): high carb 30% calorie restriction (HCCR), low carb 30% calorie restriction (LCCR), or intermittent energy calorie restriction (IER) for a further 10 weeks (resulting in a total of five groups: control, DIO, HCCR, LCCR, IER). Five mice/group were sacrificed at week 25 of the study (interim sac), while the remaining mice in each group (n=15) were injected with a solution of E0771 mammary tumor cells into the 4th mammary fat pad. These mice were monitored for tumor
progression at least three days/week and tumor sizes were estimated using a caliper biweekly. Approximately 3-4 weeks after injection of E0771 cells, mice were sacrificed by CO2 euthanasia plus cervical dislocation. At necropsy, mammary tumors, liver tissue,
lung tissue, brain tissue, colon, blood, visceral white adipose tissue (VWAT), 4th and 9th mammary fat pads (MFP), and potential tumor metastases from the body cavity were collected. Weekly body weights and food intake were measured and recorded for the duration of the study. Stool was collected every five weeks through the end of study. Diet type:
days. The average daily kilocalorie intake and macronutrient distribution for IER was equivalent to LCCR.
Diet Type Percent Carbohydrate Composition
Percent Fat Composition
Percent Protein Composition
Percent Calorie Restriction
Control 70 10 20 0
DIO 35 45 20 0
HCCR 57 14 29 30
LCCR 41 30 29 30
IER 41 30 29 70 (2 days), 14
(5 days) Table 1: Percent kCal distribution of diets
Weight and Tumor analysis:
Body composition/percent fat was determined using quantitative magnetic resonance. VWAT was weighed after removal during necropsy. Mammary tumors were weighed after removal and the dimensions measured in order to determine tumor volume. Stool analysis:
Stool was collected in cryovials and stored at -80º C. Stool will be analyzed by 16S rRNA gene sequencing to determine gut microbiota diversity.
Serum analyses:
hormones, adipokines, and cytokines were analyzed by Bio-Plex Multiplex Immunoassay (Bio-Rad), as per the manufacturer’s protocol for these assays.
mRNA expression levels (occludin, tight junction proteins in murine colon tissue): During necropsy, colon tissue was harvested and frozen at -80C. RNA was isolated from colon tissue using TRIzol reagent (ThermoFisher), and cDNA was synthesized via High-Capacity cDNA Reverse Transcription Kit (Applied Biosystems). Relative mRNA levels of occludin and ZO-1 (tight junction protein 1) were quantified by real-time qPCR using Taqman™ Gene Expression Assays and a ViiA™ 7 Real-Time PCR System
(Applied Biosystems). Relative mRNA levels of IL-6, IL-1β, IL-10, and TNF-α were
measured in the 9th MFP, distal to tumor, using the same methods. Serum Endotoxin
A Pierce™ LAL Chromogenic Endotoxin Quantitation Kit (ThermoFisher Scientific) was
used to quantify serum endotoxin levels. Statistical analysis:
Results
Body Weight, Percent Body Fat, and VWAT Analysis:
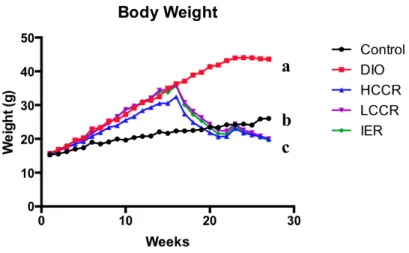
The DIO group weighed significantly more than Control and the three CR groups (all p values < 0.0001). Mean body weights in the CR groups were significantly less than Control (all p values < 0.0001). However, there was no difference in weight between the three CR groups (Figure 1).
The DIO group had the greatest percentage of body fat (mean body fat percentage = 52.02%) and was significantly greater than Control (mean body fat percentage =
24.73%) and the three CR groups (mean HCCR = 13.91%, mean LCCR = 15.91%, mean IER = 11.49%) (all p values less than 0.0001). The HCCR, LCCR, and IER had
significantly less body fat than Control (p = 0.0002, p = 0.0029, p < 0.0001,
respectively). However, the three CR groups did not differ significantly in body fat percentage from each other (Figure 2a)
Figure 1. Weekly body weights for all groups up to week 27. Different letters indicate significant differences, p < 0.05.
2a. 2b.
Figure 2. Body fat percentage (a) and VWAT weight (b) at time of necropsy. Different letters indicate significant differences, p < 0.05.
Tumor progression and invasion, final tumor volume, and final tumor weight:
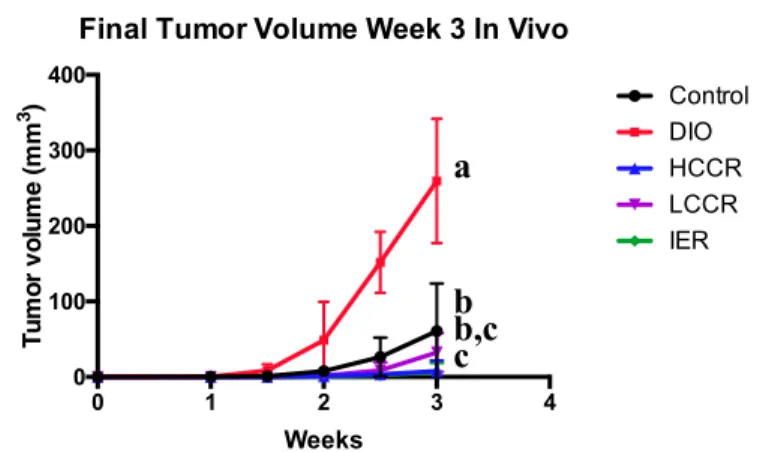
The DIO group progressed significantly faster compared to Control and the CR groups and the DIO tumors were estimated to be significantly larger when palpated at
a
b c
a
b
c
c
c a
a a a
HCCR (p = 0.0414) and IER (p = 0.0268), but not different from LCCR at this time point. However, the three CR groups were not significantly different from each other (Figure 3).
At the time of necropsy, incidence of tumor body wall invasion was assessed. Control had a similar incidence of tumor body wall invasion (64.286%) compared to DIO (60%). However, the CR groups had a much lower incidence of tumor body wall invasion (HCCR: 14.286%, LCCR: 6.667%, IER: 6.667%) than both Control and DIO (data not shown).
Figure 3. Tumor growth since injection of E0771 cells at week 25. Different letters indicate significant differences, p < 0.05.
DIO, on average, had significantly greater tumor volumes and weight than
Control (p = 0.0002 and p < 0.0001, respectively) and the three CR groups (all p values < 0.0001). Tumor volume and weight in the Control group were significantly different from HCCR (p = 0.0326 and p = 0.0092, respectively) and IER (p = 0.0233 and p = 0.0106, respectively) but not from LCCR. The three CR groups did not differ from each other in final tumor volume or weight (Figure 4).
0 1 2 3 4
0 100 200 300 400 Weeks Tum or v olum e ( m m 3)
Final Tumor Volume Week 3 In Vivo
4a. 4b.
Figure 4: Final tumor volume (a) and final tumor weight (b) at time of necropsy. Different letters indicate significant differences, p < 0.05.
Serum IL-6, Hormones and Adipokines analysis:
DIO had higher serum levels of IL-6 than Control (p = 0.0007), HCCR (p = 0.0026), LCCR (p = 0.0086), and IER (p = 0.0157). Control did not have significantly different IL-6 levels than the three CR groups and nor did the three CR groups differ from each other (Figure 5).
Control DIO
HCCR LCCR IER 0.0
0.5 1.0 1.5 2.0
Final Tumor Weight
We
ight
(g)
a
b
c
a,c c
a
b
c a,c c
a a a a
Control, DIO, and HCCR serum adiponectin levels did not differ significantly from each other. However, Control differed from LCCR (p = 0.0292) and IER (p = 0.0061). DIO did not significantly differ from LCCR but had significantly lower
adiponectin levels than IER (p = 0.0292). There were no significant differences between the three CR groups (Figure 6a)
DIO serum leptin levels were significantly greater than Control and the CR groups (all p value < 0.0001). However, Control and the three CR groups did not significantly differ from each other in serum leptin (Figure 6b).
6a. 6b.
Figure 6: Serum adiponectin levels (a) and serum leptin levels (b). Different letters indicate significant differences, p < 0.05.
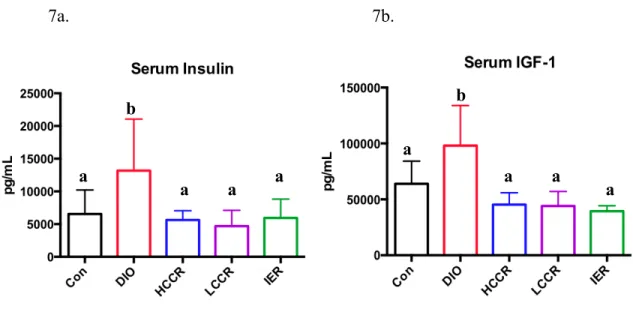
DIO serum insulin levels were significantly greater than Control (p = 0.0221), HCCR (p = 0.0201), LCCR (p = 0.0019), and IER (p = 0.008). However, Control did not significantly differ from the three CR groups (Figure 7a). Additionally, DIO serum IGF-1 levels were significantly greater than Control (p = 0.0057) and the CR groups (p value <
Con DIO
HCCR LCCR IER 0 1×10⁷ 2×10⁷ 3×10⁷ 4×10⁷ Serum Adiponectin pg/m L Con DIO
HCCR LCCR IER 0 50000 100000 150000 Serum Leptin pg/m L a a,c b,c,d a,d b,d a
a a a
0.0001). However, Control and the three CR groups did not significantly differ from each other in serum IGF-1 (Figure 7b).
7a. 7b.
Figure 7: Serum insulin levels (a) and serum IGF-1 levels (b). Different letters indicate significant differences, p < 0.05.
DIO had significantly greater serum levels of resistin than HCCR (p = 0.0132), LCCR (p = 0.0051), and IER (p = 0.0030), however DIO did not differ significantly from Control. Additionally, Control levels were not significantly different from the three CR groups in serum resistin (data not shown).
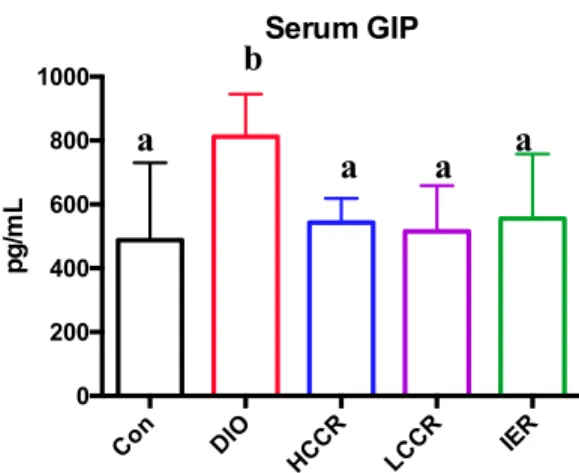
DIO GIP levels were significantly greater than Control (p = 0.0012), HCCR (p = 0.0171), LCCR (p = 0.0036), and IER (p = 0.0123) groups. The three CR groups did not significantly differ from each other and did not differ from Control in serum GIP levels (Figure 8)
a
a a
a
a a a
a
Figure 8: Serum GIP levels. Different letters indicate significant differences, p < 0.05.
Mammary Fat Pad cytokine analysis:
DIO had significantly greater IL-6 cytokine expression in the 9th MFP (distal to
tumor) when compared to Control (p = 0.0204), HCCR (p = 0.0018), LCCR (p = 0.0129), and IER (p = 0.0009). However, there was no significant difference in IL-6 gene
expression between Control and the three CR groups (Figure 9a).
DIO had significantly greater TNF-α expression in the 9th MFP (distal to tumor) when compared to HCCR (p = 0.0002), LCCR (p = 0.004), and IER (p = 0.0021).
However, DIO and Control TNF-α levels did not significantly differ from each other and nor did Control differ significantly from the three CR groups. The three CR groups did not differ from each other in relative TNF-α expression (Figure 9b).
DIO had significantly greater IL-1β expression in the 9th MFP (distal to tumor) when compared to Control (p = 0.0112), HCCR (p = 0.0001), and IER (p = 0.0002). However there was no difference in DIO and LCCR IL-1β expression. As well, Control did not differ significantly from the three CR groups and nor did the CR groups differ significantly from each other (Figure 9c).
Con DIO
HCCR LCCR IER 0
200 400 600 800 1000
Serum GIP
pg/m
L
a
a a a
DIO had significantly lower IL-10 cytokine expression in the 9th MFP (distal to tumor) when compared to Control (p = 0.0055) and HCCR (p = 0.0193). There was no significant difference in IL-10 gene expression between Control and the three CR groups. DIO did not significantly differ in IL-10 expression from LCCR, and IER. Lastly, the three CR groups did not differ from each other in relative IL-10 expression (Figure 9d).
9a. 9b.
9c. 9d.
Figures 9. Relative IL-6 (a), TNF-α (b), IL-1β (c), and IL-10 (d) expression in the 9th
a
a a
a
b b
a,b
a
a a
a
a a,b a
b
a
b
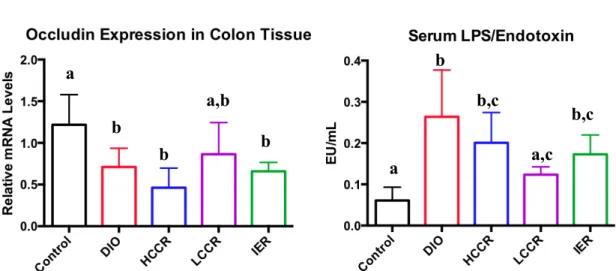
Tight Junction Proteins, Occludin, and Serum LPS:
There were no significant differences between the five groups in the relative gene expression of ZO-1 in the colon (data not shown).
Control had greater occludin expression in the colon than DIO (p = 0.0258), HCCR (p = 0.0002), and IER (p = 0.0081). Control did not differ significantly from LCCR and nor did DIO differ significantly from HCCR and IER. The three CR groups did not significantly differ from each other in relative occluding expression (Figure 10a).
Control serum LPS levels were significantly lower than DIO (p < 0.0001), HCCR (p = 0.0033), and IER (p = 0.0331). However, there was no significant difference in LPS levels between Control and LCCR. DIO LPS levels were significantly greater than LCCR (p = 0.0032) but were not significantly different from HCCR, or IER. The three CR groups did not differ from each other in serum LPS (Figure 10b).
10a. 10b.
Figure 10: Relative mRNA occludin expression (a) in colon tissue and serum LPS (b). Different letters indicate significant differences, p < 0.05.
a
b
b
b,c
a b
b
a,b
Discussion
The purpose of this study was to determine the effects of obesity and obesity-reversing energy restricted diets on breast cancer development and the gut
microenvironment. Our study replicated some known diet effects. For example, our DIO model exhibited known characteristics of obesity33, such as: significantly greater body weights, greater body fat percentages, greater average VWAT weight, higher serum GIP, hyperinsulinemia, and hyperleptinemia. Additionally, our CR groups displayed known CR characteristics, such as a reduction in mammary tumor growth in rodent models34,35.
HCCR has previously been shown to reduce body weight and serum levels of metabolic hormones such as leptin, insulin, and IGF-136. LCCR has also been shown to reduce body weight, serum insulin levels, and serum IGF-1 levels, and increase serum adiponectin levels36,37. Lastly, IER diets have also been shown to reduce serum insulin levels and body fat30. Our study design not only replicated known diet effects but also allowed for
concurrent comparison of the effects of several diet interventions, in one novel study design.
1β) and decreased expression of the anti-inflammatory cytokine IL-1040,41. The three CR diets appear to have reversed this inflammation to some degree. Since there were few significant differences amongst the three CR groups in the reversal of hormonal secretion and inflammation, we concluded that macronutrient composition of the weight loss diet may not be important.
We also observed that DIO induced significant changes in the gut such as a reduction in the mRNA expression of occludin. However, the three CR diets did not reverse this change. Conversely, there were no significant differences in ZO-1 (tight junction protein) mRNA expression between any of the groups. Occludin is critical for the regulation of tight junction proteins, for maintenance of the integrity of these proteins, and for preventing paracellular permeability of the gut epithelium. It has been noted with increasing evidence that absence of occludin in gut epithelium does not prevent the formation of tight junctions proteins but does increase permeability42,43. With our
observations, we concluded that the effects of obesity on occludin expression may not be easily reversed by weight loss.
In our model, the dysfunctional hormone levels could be a potential mechanism for how obesity enhances tumor development. Since GIP is known to be an “obesity hormone”, facilitating the accumulation of triacylglycerol into adipose tissue44,45, this
additional adipose seen with increased GIP levels could also promote a pro-inflammatory environment characteristic in obesity and cancer. The dysregulation of IGF-1 secretion seen under obeseogenic conditions has been found to increase the risk and development of breast cancer46, especially in pre-menopausal women. The increased secretion of IGF-1 observed in this study, together with the inflammatory environment induced by obesity may lead to tumor promotion. Therefore, CR diets may be more effective in reversing systemic hormonal perturbations, and may result in a greater/more effective reduction in the severity of breast cancer than control diets.
The increased local MFP inflammation seen in our study may be another
mechanism by which obesity enhances the severity of tumor development. The increased IL-6, TNF-α, and IL-1β and decreased IL-10 observed in our study indicates the tumor-promoting effects of obesity. While the reversal of these cytokine levels by CR diets may result in a more effective reduction of breast cancer severity.
studies are needed to determine whether there is a relationship between CR diet composition, breast cancer development, and the gut microenvironment
Conclusion
WORKS CITED
1. National Institute of Diabetes and Digestive and Kidney Diseases. (October, 2012). Overweight and obesity statistics. Retrieved from
http://www.niddk.nih.gov/health-information/health-statistics/Pages/overweight-obesity-statistics.aspx
2. Centers for Disease Control and Prevention. (September 21, 2015). Adult obesity facts. Retrieved from http://www.cdc.gov/obesity/data/adult.html
3. National Cancer Institute. (January 3, 2012). Obesity and cancer risk. Retrieved from http://www.cancer.gov/about-cancer/causes-prevention/risk/obesity/obesity-fact-sheet#q3
4. Roberts, D. L., Dive, C., & Renehan, A. G. (2010). Biological mechanisms linking obesity and cancer risk: New perspectives. Annual Review of Medicine, 61(1), 301-316. doi:10.1146/annurev.med.080708.082713
5. Harvey, A. E., Lashinger, L. M., & Hursting, S. D. (2011). The growing challenge of obesity and cancer: An inflammatory issue. Annals of the New York Academy of Sciences, 1229(1), 45-52. doi:10.1111/j.1749-6632.2011.06096.x
6. Trent, L., & American Society of Clinical Oncology. (2014). The state of cancer care in america, 2014: A report by the american society of clinical oncology. Journal of Oncology Practice / American Society of Clinical Oncology, 10(2), 119-142. doi:10.1200/JOP.2014.001386
7. Allott, E., & Hursting, S. (2015). Obesity and cancer: Mechanistic insights from transdisciplinary studies. Endocrine-Related Cancer, 22(6), R365-R386.
doi:10.1530/ERC-15-0400
8. American Cancer Society. (February 22, 2016). What are the key statistics about breast cancer?. Retrieved from
http://www.cancer.org/cancer/breastcancer/detailedguide/breast-cancer-key-statistics
9. American Cancer Society. (February 22, 2016). What are the risk factors for breast cancer?. Retrieved from
http://www.cancer.org/cancer/breastcancer/detailedguide/breast-cancer-risk-factors
11. Lashinger, L., Ford, N., & Hursting, S. (2014). Interacting inflammatory and growth factor signals underlie the obesity-cancer link. Journal of Nutrition, 144(2), 109-113. doi:10.3945/jn.113.178533
12. Xu, H., Barnes, G. T., Yang, Q., Tan, G., Yang, D., Chou, C. J.. . Chen, H. (2003). Chronic inflammation in fat plays a crucial role in the development of obesity-related insulin resistance. Journal of Clinical Investigation, 112(12), 1821-1830. doi:10.1172/JCI200319451
13. Hopps, E., Noto, D., Caimi, G., & Averna, M. R. (2010). A novel component of the metabolic syndrome: The oxidative stress. Nutrition, Metabolism and Cardiovascular Diseases, 20(1), 72-77. doi:10.1016/j.numecd.2009.06.002
14. Cani, P. D., Possemiers, S., Van De Wiele, T., Guiot, Y., Everard, A., Rottier, O., Delzenne, N. M. (2009). Changes in gut microbiota control inflammation in obese mice through a mechanism involving GLP-2-driven improvement of gut
permeability. Gut, 58(8), 1091-1103. doi:10.1136/gut.2008.165886
15. Shen, J., Obin, M. S., & Zhao, L. (2013). The gut microbiota, obesity and insulin resistance. Molecular Aspects of Medicine, 34(1), 39-58.
doi:10.1016/j.mam.2012.11.001
16. Cavalcante-Silva, L., Galvao, J., da Silva, J., de Sales-Neto, J., & Rodrigues-Mascarenhas, S. (2015). Obesity-driven gut microbiota inflammatory pathways to metabolic syndrome. Frontiers in Physiology, 6, 341.
doi:10.3389/fphys.2015.00341
17. Carmody, R., Gerber, G., Luevano, J., Gatti, D., Somes, L., Svenson, K., & Turnbaugh, P. (2015). Diet dominates host genotype in shaping the murine gut microbiota. Cell Host & Microbe, 17(1), 72-84. doi:10.1016/j.chom.2014.11.010 18. Mahowald, M. A., Magrini, V., Turnbaugh, P. J., Gordon, J. I., Ley, R. E., &
Mardis, E. R. (2006). An obesity-associated gut microbiome with increased capacity for energy harvest. Nature, 444(7122), 1027-131.
doi:10.1038/nature05414
19. Lin, W., & Karin, M. (2007). A cytokine-mediated link between innate immunity, inflammation, and cancer. Journal of Clinical Investigation, 117(5), 1175-1183. doi:10.1172/JCI31537
20. Jørgensen, S. F., Trøseid, M., & Anmarkrud, J. A. (2016). Altered gut microbiota profile in common variable immunodeficiency associates with levels of
21. Parker, E. D., & Folsom, A. R. (2003). Intentional weight loss and incidence of obesity-related cancers: The iowa women's health study. International Journal of Obesity, 27(12), 1447-1452. doi:10.1038/sj.ijo.0802437
22. Byers, T., & Sedjo, R. L. (2011). Does intentional weight loss reduce cancer risk? Diabetes, Obesity and Metabolism, 13(12), 1063-1072. doi:10.1111/j.1463-1326.2011.01464.x
23. Van Den Brandt, Piet A, Spiegelman, D., Yaun, S., Adami, H., Beeson, L., Folsom, A. R.. . Hunter, D. J. (2000). Pooled analysis of prospective cohort studies on height, weight, and breast cancer risk. American Journal of Epidemiology, 152(6), 514-527. doi:10.1093/aje/152.6.514
24. Wolin, K. Y., & Colditz, G. A. (2008). Can weight loss prevent cancer? British Journal of Cancer, 99(7), 995-999. doi:10.1038/sj.bjc.6604623
25. Shelton, L. M., Huysentruyt, L. C., Mukherjee, P., & Seyfried, T. N. (2010). Calorie restriction as an anti-invasive therapy for malignant brain cancer in the VM mouse. ASN NEURO, 2(3), e00038.
http://doi.org.libproxy.lib.unc.edu/10.1042/AN20100002
26. Berrigan, D., Perkins, S. N., Haines, D. C., & Hursting, S. D. (2002). Adult-onset calorie restriction and fasting delay spontaneous tumorigenesis in p53-deficient mice. Carcinogenesis, 23(5), 817-822. doi:10.1093/carcin/23.5.817
27. Pagoto, S. L., & Appelhans, B. M. (2013). A call for an end to the diet debates. Jama, 310(7), 687-688. doi:10.1001/jama.2013.8601
28. Bacon, L., & Aphramor, L. (2011). Weight science: Evaluating the evidence for a paradigm shift. Nutrition Journal, 10(1), 9-9. doi:10.1186/1475-2891-10-9 29. Ong, K. R., Sims, A. H., Harvie, M., Chapman, M., Dunn, W. B., Broadhurst, D.,
Howell, A. (2009). Biomarkers of dietary energy restriction in women at increased risk of breast cancer. Cancer Prevention Research, 2(8), 720-731. doi:10.1158/1940-6207.CAPR-09-0008
30. Harvie, M., Wright, C., Pegington, M., McMullan, D., Mitchell, E., Martin, B.. . Howell, A. (2013). The effect of intermittent energy and carbohydrate restriction v. daily energy restriction on weight loss and metabolic disease risk markers in overweight women. British Journal of Nutrition, 110(8), 1534-1547.
doi:10.1017/S0007114513000792
overweight women. International Journal of Obesity, 35(5), 714-727. doi:10.1038/ijo.2010.171
32. Mattson, M. P., Allison, D. B., Fontana, L., Harvie, M., Longo, V. D., Malaisse, W. J.. . Panda, S. (2014). Meal frequency and timing in health and disease. Proceedings of the National Academy of Sciences, 111(47), 16647-16653. doi:10.1073/pnas.1413965111
33. Lustig, R. H., Sen, S., Soberman, J. E., & Velasquez-Mieyer, P. A. (2004). Obesity, leptin resistance, and the effects of insulin reduction. International Journal of Obesity, 28(10), 1344-1348. doi:10.1038/sj.ijo.0802753
34. Cleary, M., & Grossmann, M. (2011). The manner in which calories are restricted impacts mammary tumor cancer prevention. Journal of Carcinogenesis, 10(1), 21-21. doi:10.4103/1477-3163.85181
35. Hursting, S., Lavigne, J., Berrigan, D., Perkins, S., & Barrett, J. (2003). Calorie restriction, aging, and cancer prevention: Mechanisms of action and a
applicability to humans. Annual Review of Medicine, 54, 131-152. doi:10.1146/annurev.med.54.101601.15216
36. Wheatley, K. E., Williams, E. A., Smith, N. C. P., Dillard, A., Park, E. Y., Nunez, N. P.. . Lane, M. A. (2007;2008;). Low-carbohydrate diet versus caloric
restriction: Effects on weight loss, hormones, and colon tumor growth in obese mice. Nutrition and Cancer, 60(1), 61-68. doi:10.1080/01635580701510150 37. Chen, J., Ouyang, C., Ding, Q., Song, J., Cao, W., & Mao, L. (2015). A moderate
low-carbohydrate low-calorie diet improves lipid profile, insulin sensitivity and adiponectin expression in rats. Nutrients, 7(6), 4724-4738.
doi:10.3390/nu7064724
38. Łukaszewicz, M., Mroczko, B., & Szmitkowski, M. (2007). Clinical significance of interleukin-6 (IL-6) as a prognostic factor of cancer disease. Polskie Archiwum Medycyny Wewnętrznej, 117(5-6), 247.
39. Tawara, K., Oxford, J. T., & Jorcyk, C. L. (2011). Clinical significance of interleukin (IL)-6 in cancer metastasis to bone: potential of anti-IL-6 therapies. Cancer Management and Research, 3, 177–189.
40. Fiorentino, D., Zlotnik, A., Mosmann, T., Howard, M., & O'Garra, A. (1991). IL-10 inhibits cytokine production by activated macrophages. The Journal of
Immunology, 147(11), 3815-3822.
Biochemical and Biophysical Research Communications, 323(2), 630-635. doi:10.1016/j.bbrc.2004.08.145
42. Mrsny, R. J., Brown, G. T., Gerner-Smidt, K., Buret, A. G., Meddings, J. B., Quan, C.. . Nusrat, A. (2008). A key claudin extracellular loop domain is critical for epithelial barrier integrity. The American Journal of Pathology, 172(4), 905-915. doi:10.2353/ajpath.2008.070698
43. Rao, R. (2009). Occludin phosphorylation in regulation of epithelial tight junctions. Annals of the New York Academy of Sciences, 1165(1), 62-68. doi:10.1111/j.1749-6632.2009.04054.x
44. Ranganath, L. R. (2011). The paradoxical role of glucose-dependent insulinotropic polypeptide (GIP) in diet and eating behaviour in health and disease. (pp. 241-257). New York, NY: Springer New York. doi:10.1007/978-0-387-92271-3_17
45. Varol, C., Zvibel, I., Spektor, L., Mantelmacher, F., Vugman, M., Thurm, T., Fishman, S. (2014). Long-acting glucose-dependent insulinotropic polypeptide ameliorates obesity-induced adipose tissue inflammation. Journal of Immunology, 193(8), 4002-4009. doi:10.4049/jimmunol.1401149