Differences in White Matter Microstructure Integrity between Heavy and Light Drinkers
Nicole Seider
University of North Carolina in Chapel Hill Spring 2015
A thesis presented to the faculty of The University of North Carolina at Chapel Hill in partial fulfillment of the requirements for the Bachelor of Science degree with Honors in Psychology.
Advisor________________________ Dr. Charlotte A. Boettiger
Reader________________________ Dr. Martin Styner
Acknowledgements
First I would like to extend my sincerest thanks to the members of my committee. This thesis was completed with continuous support of my faculty advisor, Dr. Charlotte Boettiger, whom has mentored and guided me for over three years as I learned and experienced research from multiple aspects of behavioral neuroscience. Many thanks to Dr. Martin Styner, whom has supported and guided me in the use of dedicated computational tools and techniques and
deepened my understanding of the novel methodology. In addition to taking the time to
participate in my defense, Dr. Kathleen Gates has assisted with the statistical analysis of data and made herself available for any questions I may have.
Second, I would like to thank all the current and past members of the Cognitive Addition Biospychology lab for their contributions to my Honors Thesis. Many thanks to Dr. Christopher Smith and Michael Parrish for recruiting participants, collecting behavioral measures and
participant scans, and compiling the data as part of the YAD fMRI study. I am especially thankful to Dr. Audrey Verde, who took the time to train me in the use of the UNC-Utah NA-MIC DTI framework for the analysis of Diffusion Tensor Imaging and the use of FreeSurfer for structural MRI analysis. Dr. Audrey Verde also ensured I comprehended each step and
component of the framework until I could explain the reasoning and logic of each manipulation and understood how the data changed. Beyond making herself available at any time to assist me with problems while a graduate student, Dr. Audrey Verde continued to faithfully mentor and guide me as she continued her medical studies this past year.
Third, I thank the current and past members of the NeuroImaging and Research Analysis Laboratories. Joseph Blocher and Gary Long kept the lab system running smoothly and
quality control of the Diffusion Tensor Imaging data. Special thanks go to the computer scientists who developed and refined the tools used in data analysis, particularly to Francois Budin and Alexis Girault for troubleshooting tools on short notice and then taking the time to explain the necessary fixes or what had gone wrong.
Fourth, I thank my friends and family for supporting me every step of the way. My parents have encouraged my love of science and research since birth, and never derided failure or ignorance. To Rachel for our decade long mutually assured insanity, and the exuberant
philosophical conversations in between. Anthony has heard all the variations and musing on my thesis, ensured I ate when the research was too engaging, and cheered me up when the world was bleak. My four years at Carolina would not have been nearly as fulfilling or memorable without the people around me, and I would not have accomplished as much without their support.
Finally, I would like to acknowledge the support for this work from the National
Abstract
A common characteristic of individuals with alcohol use disorders (AUDs) is impulsive behavior, as quantified by a Delay Discounting (DD) task; those with AUDs are more likely to choose smaller, sooner rewards relative to control participants. This tendency is also observed among heavy, subclinical drinkers, and emerging adults (ages 18-25). DD can be reduced in healthy controls by visualizing oneself in the future (episodic prospection); the magnitude of this behavioral change positively correlates with functional connectivity between the medial
prefrontal cortex and the medial anterior temporal cortex. We hypothesized that the structural connectivity between these regions may vary as a function of age and of alcohol use, specifically in the cingulum, uncinate, and fornix white matter tracts. Secondly, we hypothesized that age and alcohol use would also associate with structural differences in frontal and medial anterior temporal lobe gray matter and striatal subcortical structures. In a sample of 84 healthy subjects (ages 18-40; 52.38% Female), we found significant effects of current alcohol consumption, current binge drinking, and binge drinking before age 21 on the white matter microstructure of bilateral cingulum and uncinate. We observed no statistically significant effects of alcohol use on the cortical and subcortical regions analyzed. Our findings suggest a stronger association of subclinical binge drinking with the microstructure integrity of the white matter bundles
Differences in White Matter Microstructure Integrity between Heavy and Light Drinkers Alcoholism is an expensive and common disorder that affects millions of adults in the United States. An estimated 17 million adults meet criteria for alcohol use disorders (AUDs) (CDC, 2011). Additionally, the cost of excessive drinking was estimated at over 223.5 billion dollars in 2006 (CDC, 2011). There are approximately 88,000 deaths each year due to excessive alcohol use in the United States, making excessive alcohol use the third highest lifestyle-related cause of death in the USA (CDC, 2014). The National Institute on Alcohol Abuse and
Alcoholism (NIAAA) defines a binge episode as five or more drinks in one occasion, while heavy drinking is defined as five or more drinks on five or more days within the past month (NIAAA, 2014). Within the college environment, 60% of students consume alcohol, 40% binge, and 15% qualify as heavy drinkers. Fully understanding the behavioral and biological
mechanism of alcoholism and how it affects the brain structure at differing stages of
development can help society in treating this disorder and raise awareness among a population known for high alcohol consumption.
Impulsivity in Alcohol Use Disorders
Studies have shown that adults with addictive disorders have a greater tendency to choose immediate smaller rewards over larger later rewards (MacKillop et al., 2011; Reynolds, 2006). An early study on temporal discounting found that heavy drinkers were more impulsive than social drinkers, and that problem drinkers demonstrated lower consideration for future
do (Mitchell, Fields, D'Esposito, & Boettiger, 2005; Petry, 2001). The discounting choice frequency (Impulsive Choice Ratio, ICR) was also correlated with behavioral measures of impulsivity obtained from Barratt Impulsiveness Scale (Mitchell et al., 2005). Greater
impulsivity in emerging adults through greater discounting of larger later rewards is considered a risk factor for later development of an AUD in adulthood (Brown et al., 2008; Kandel & Logan, 1984). Understanding the interaction between impulsivity and age and how they contribute to an increased risk for AUDs could improve treatment and AUD prevention options.
Impulsivity by Age and AUD
Research has also that shown late adolescents (ages 18-21) have a greater tendency to choose immediate smaller rewards than adults (ages 22-40) (C. T. Smith & Boettiger 2012). This is consistent with evidence that the development of frontal structures remains incomplete until the early-to-mid-twenties (Casey, Giedd, & Thomas, 2000; Giedd, 2004; Sowell,
circuits may have additional consequences with regards to behavioral immaturity, given the potential insult to the immature frontal lobe.
Impulsivity and Episodic Prospection
A modified DD task incorporating episodic prospection demonstrated that ICR is reduced in normal control participants when larger, later rewards carry a personally relevant event
descriptor (Benoit, Gilbert, & Burgess, 2011). In this DD task version, participants were
instructed to imagine themselves using a larger, later reward during the future event described by the episodic tag. The effect of the episodic tags on ICR was shown to increase when activity in the medial-rostral prefrontal cortex (mrPFC) was more highly coupled with activity the
hippocampus. For example, the relationship between ICR and episodic tags was magnified when the episodic tags were of higher emotional intensity for the individuals. An additional study analyzing the effect of episodic prospection on DD found that functional coupling between the anterior cingulate cortex (ACC) and the hippocampus and amygdala predicted the degree to which episodic prospection modulated ICR (Peters & Buchel, 2010). Thus, the reduction of ICR due to episodic prospection in normal adults is thought to be mediated by the circuits connecting the frontal regions (mrPFC and ACC) and mediotemporal regions (hippocampus and amygdala).
Structural Implications of Impulsivity
Given the association of individual differences in functional connectivity between the frontal and mediotemporal regions and behavioral differences in normal adults during the
cingulum collects axons from the cingulate gyrus to the entorhinal cortex in the medial temporal lobe (Oishi, Faria, van Zijl, & Mori, 2011). The uncinate connects the anterior temporal lobe to the orbital frontal cortex through the hippocampal formation. The fornix projects from the hypothalamus and mammillary bodies, and splits into two lateral segments that project into the dorsal regions of the hippocampi.
Diffusion Tensor Imaging and Quantitative Tractography
The white matter bundles of interest, the cingulum, fornix, and uncinate, will be studied using diffusion tensor imaging (DTI) and quantitative tractography. DTI is a type of magnetic resonance imaging (MRI) that quantifies the movement of water and its direction to determine the structure of white matter tracts. Given that the movement of water is spherical when unconstrained such as in the cell bodies of neurons, linear movement occurs only when the molecules are constrained such as in the axons or white matter. Within each voxel of the DTI image, three eigenvalues are calculated that describe the ellipsoid or shape of water movement in that voxel. From these three eigenvalues, four measures are obtained to describe the movement of water: fractional anisotropy (FA), axial diffusivity (AD), radial diffusivity (RD), and mean diffusivity (MD). FA describes the percentage of linear diffusion within a voxel and is thus used as an overall measure of integrity where higher values indicate greater white matter bundle integrity, and the other measures are used to interpret the differences in integrity (Verde et al., 2013). AD is defined as the largest of the three eigenvalues, or the strongest direction of
constricts water movement in a linear fashion (Song et al., 2003). A decrease in AD is association with cell death or general disorganization of the fiber bundle (Song et al., 2003). Mathematically, a decrease in MD would indicate a decrease of water movement but this has not yet been associated with any cortical differences.
Quantitative Tractography. A novel method of analyzing DTI with higher resolution and that provides tract-specific results is quantitative tractography (Goodlett, Fletcher, Gilmore, & Gerig, 2009). Curvilinear regions of interest are created through the use of tractography, resulting in a region comprised of a single white matter tract that is informed by neuroanatomy. The weighted average of diffusion parameters is assessed at each millimeter along the length of each tract, thus taking into account the fiber environment. Finally, functional analysis of
diffusion tensor tract statistics (FADTTS) is performed, which provides localized statistics along each tract (Zhu et al., 2011). Using quantitative tractography as opposed to prior methodology, we will be able to analyze the microstructural integrity of specific white matter tracts rather than of large non-specific regions.
Structural MRI and FreeSurfer
Structural MRI (sMRI) captures the structure of the brain such as the boundaries between gray and white matter, subcortical structures and in clinical settings can be used to localize tumors and other abnormalities. Structural differences between individuals are seen in the cortical thickness and volume of ROI and subcortical structure volumes. To analyze and compare these measures, the brain will be segmented into subcortical structures and cortical ROI, which can be accomplished using FreeSurfer, a reliable, widely tested, and freely available segmentation program (Dale, Fischl, & Sereno, 1999; Fischl et al., 2002). Subsequently,
differences in ROI thickness and volume and can be analyzed as a function of behavioral
Prior Results in DTI
The current study analyzes differences in white matter microstructure associated with individual differences in drinking behavior in a sub-clinical population, or individuals who did not meet criteria for an AUD. To our knowledge, the current alcohol literature concentrates on higher levels of alcohol use with a more limited range in alcohol consumption. Alcohol
addiction research using DTI has shown that chronic alcohol is associated with degradation of white matter microstructure in several tracts in the brain, along with general shrinkage of brain volume (Pfefferbaum, Adalsteinsson, & Sullivan, 2006; Pfefferbaum, Rosenbloom, Rohlfing, & Sullivan, 2009). In comparison to association with chronic use, investigation of adolescent binge drinkers found 18 tracts with lower fractional anisotropy (FA) than seen in adolescent controls including the fornix and cingulum (McQueeny et al., 2009). Another study comparing alcoholics to controls observed effects for FA and radial diffusion (RD) in the fornix, suggesting that there may be myelin degradation as a result of chronic heavy alcohol use (Schulte, Muller-Oehring, Pfefferbaum, & Sullivan, 2010). Researchers attempting to predict relapse rates of alcoholics determined that relapsing alcoholics had lower FA than controls and non-relapsing alcoholics in several tracts, including both the left and right uncinate (Sorg et al., 2012). Additionally,
comparison between healthy controls and both current and remission AUD individuals observed decreased FA in the fornix of individuals with AUDs (Monnig et al., 2013).
Prior Results in sMRI
Previous structural MRI analysis of individuals with AUDs versus controls has
the medial orbitofrontal cortex (OFC; De Bellis et al., 2005; Durazzo et al., 2011; Fein et al., 2002; Fortier et al., 2011; Momenan et al., 2012; Oscar-Berman & Song, 2011). Analysis of family history of alcoholism within chronic heavy drinkers has previously found no association of family history with cortical volume, and a negative correlation of family history with
cerebrospinal fluid (CSF; Cardenas, Studholme, Meyerhoff, Song, & Weiner, 2005; Fein et al., 2002). The negative correlation of family history with CSF in chronic heavy drinkers, indicates that such individuals with a negative family history of alcoholism had greater CSF volume, from which researchers inferred that chronic heavy drinkers with a positive family history of
alcoholism had greater total cortical volume. Thus, positive family history of alcoholism could be a protective factor for chronic heavy drinkers.
Research Questions and Hypothesis
Structural differences in gray and white matter have been found when comparing normal controls to abstinent alcoholics, but sub-clinical populations have not been studied to our
knowledge. The additional focus on age when comparing emerging adults versus adults in conjunction with the genetic analysis has not been completed. Therefore, the primary research question is as follows: are there differences in the gray matter and white matter structure between heavy and light drinkers in the frontal and medial temporal lobes and circuits? We hypothesize heavier drinkers will have a lower white matter microstructure integrity in the cingulum, fornix, and uncinate, and decreased cortical and subcortical volume in the frontal and mediotemporal lobes and subcortical structures after controlling for age and gender. Additionally, we
Materials and Methods
Participants
Individuals were recruited through list-serve emails and flyers in the Chapel Hill, North Carolina community. The current study sample consisted of 84 participants between the ages of 18-40 with an average age of 26.0. The majority of our sample was white (58.3%) and 52.3% of our sample was female.
Potential participants were excluded if they were: currently taking psychoactive drugs including prescription medications, had previously sought treatment for substance use or alcohol use disorder or met DSM-IV criteria for any lifetime alcohol dependence, had a known
Procedure
Potential participants contacted the lab to express interest in the study and they were then screened via telephone or an online survey for eligibility. Participants that met the inclusionary criteria were scheduled to go to the Biomedical Research Imaging Center (BRIC) to complete an approximately 3 hour testing session, which included about 1.5 hours in an MRI scanner. All interaction and testing was performed by Boettiger lab personnel. Upon arrival at the lab, participants read the consent form and were given the opportunity to ask questions about the protocol. After signing the consent form, participants were asked to complete a subject information sheet, health screening sheet, and the MRI screen form. In addition, participants were screened for alcohol via breathalyzer, psychoactive drugs via a urine screen, and female participants were given a urine pregnancy test. Subsequently, participants were asked to provide a saliva sample using specially designed tubes for genetic material collection. Participants were asked to complete a battery of questionnaires, the following subset of which will be analyzed in this paper: the Alcohol Use Disorders Identification Test (AUDIT) and the Carolina Alcohol Use Pattern Questionnaire (CAUPQ). After completing the questionnaires, participants were escorted into the scanning room for an approximately one and a half hour scan session. Two functional scans and two structural scans were collected during the scanning session, but only the structural scans will be analyzed in this study. Finally, participants received monetary compensation.
Measures
consumption (labeled as AUDIT-consumption; (Bush et al., 1998). The Carolina Alcohol Use Pattern Questionnaire (CAUPQ), included questions from the Alcohol Use Questionnaire (Townshend & Duka, 2002), with the addition of questions designed to measure current and past binge drinking. A binge drinking episode, as defined by the National Institute on Alcohol Abuse and Alcoholism (NIAAA), is five or more drinks in two hours for men and four or more drinks in two hours for women (NIAAA, 2014). The first measure from this questionnaire was the frequency of binge drinking episodes during the past 12 months, and the second measure was the frequency of binge drinking episodes prior to age 21 (labeled as Current Binge and Binge <21, respectively). The latter measure was calculated by combining the number of binge drinking episodes prior to age 18 with the number of episodes between the ages of 18 and 21.
choices. Since ICR is bounded between 0 and 1, the measure was transformed using an arcsin √𝐼𝐶𝑅 transformation for subsequent statistical analysis.
Participant Demographics. The larger study sample was intentionally collected to have approximately equal number of participants in a 2x2 factor model: heavy vs. light drinkers and emerging adults vs. older adults. A heavy drinker was defined by an AUDIT-consumption score of 4 or greater for females and a score of 5 or greater for males while a light drinker had an AUDIT-consumption score of less than 4. Emerging adults were classified as between the age of 18 and 24, with adults classified as 26 or greater. The mean and standard deviations of all
behavioral measures, along with participant demographics, are listed in Table 1. Tables 2 and 3 list participant demographics by group: light vs. heavy drinkers and emerging vs. older adults respectively. Since subsequent analyses control for age and gender while drinking is treated as a covariate of interest, and there are qualitative differences in race distribution between the groups, we conducted a three factor multivariate analysis of variance (MANOVA) to test for race, age, or gender dependent differences in the behavioral measures. In addition, we conducted a bivariate correlation of the variables of interest to determine whether the variables can be run in
independent models or as covariates. These analyses were carried using SPSS (version 22; SPSS Inc, Chicago, IL, USA)
DTI Acquisition and Processing
DTI images were acquired using a Siemens Magnetom Trio 3T scanner at UNC-Chapel Hill. The protocol included 7 baseline images and 42 gradients (b = 1004) with voxel
dimensions of 2x2x2 mm.
there were no artifacts and to ensure that data the header information was correct. A participant was removed from the study at this point due to excessive motion. Subsequently, fiducial tractography was used to determine whether participant data was of sufficient quality and signal to noise ratio for adequate tractography of the fiber tracts, and whether the tracts were
anatomically accurate along the entire length. Subjects could be eliminated from DTI analysis at this point if the fiber bundles of interest were incomplete or of sub-optimal quality to allow for adequate tracking. Ten participants were excluded from DTI analysis at this point; two light drinking emerging adults, one heavy drinking emerging adult, four light drinking adults, and 3 heavy drinking adults. Additionally, due to a lower signal to noise ratio in the posterior curve of the cingulum for all participants, the cingulum was divided into a superior and inferior portion and the fiber was subsequently analyzed into two sections.
The second step in the framework is atlas creation, which creates an unbiased nonlinear average atlas from a subset of participants’ co-registered DTI images. A subset of participants (n = 52 of an available 75) were used in atlas creation rather than the entire sample in order to limit
Structural MRI Acquisition & Processing
Structural MRI (sMRI) 3D T1 MPRAGE data (1 x 1 x 1mm) for each participant was acquired using a Siemens Magnetom Trio 3.0T scanner at UNC-Chapel Hill. Initially, the T1 weighted images were quality controlled for movement and artifacts using ITK-SNAP version 2.4 (Yushkevich et al., 2006). At this point one participant was removed from the study due to excessive motion, the same participant that was removed from DTI analysis due to excess motion. The T1-weighted images were then processed according to the FreeSurfer version 5.3 workflow to compute the white matter and pial surfaces, and subsequent segmentations and parcellations (Dale et al., 1999; Fischl et al., 2002). The surfaces, segmentations and
parcellations from FreeSurfer were quality controlled and edited if necessary. In the current data set edits were made to the wm.mgz file, the file that classifies voxels as white matter, only when the gray matter surface and pial surface were adversely affected. These edits were made for 5 of 85 subjects; two light drinking emerging adults, one heavy drinking emerging adult, and two heavy drinking older adults. Once the edits were finalized and necessary files were recomputed, the cortical volume, cortical thickness, and subcortical volume measurements were extracted from the Desikan-Killiany atlas provided within FreeSurfer (Desikan et al., 2006).
Statistical Analysis for DTI
Functional Analysis of Diffusion Tensor Tract Statistics (FADTTS), implemented in MatLab, was used to analyze the fiber bundles with respect to several measures (Zhu et al., 2011). FADTTS computes correlations between independent variables of interest and diffusion parameters along the length of the entire tract (global effects), and at each millimeter along the length of the fiber (local effects). The omnibus graph plots the local beta values of the
tract parameters and covariates. Areas of significance along the tract due to contributions of all four of the diffusion parameters combined and the variable of interest are visualized as filled in circles on the omnibus plot lines. Subsequently, post hoc tests determined which, if any, individual diffusion parameter had a significant correlation with the independent variable of interest. Lastly, the statistical results were merged back on to the parameterized fiber bundle using Merge Stat with Fiber (MSWF) in order to have a color visualization of significant points on the fiber tract itself (Verde et al., 2013). When interpreting the output provided by FADTTS, the first and last six millimeters of the fiber are not interpreted, as the diffusion parameter
measurements become less reliable and more biased at the ends of the fiber track and the tract ends represent the white matter approaching the gray matter. Isolated points of local significance are also not interpreted, as they do not contribute to meaningful trends. Finally, points of
significance whose betas vary around zero from one millimeter to the next are not interpreted as they too do not contribute to meaningful trends.
Statistical Analysis for sMRI
To determine the association between the cortical and subcortical ROI volume with the behavioral measures, several multivariate multiple linear regressions were carried out in R (http://www.R-project.org). The cortical and subcortical ROI were divided into six groups by location: left and right frontal ROIs, temporal ROIs, and subcortical structures. Then six
Visualization of the data was accomplished using the tools TkSurfer and FreeView within the FreeSurfer tools, and Slicer4.3 (Dale et al., 1999; Fedorov et al., 2012).
Results Initial Analysis of Behavioral Measures
The three factor MANOVA found no main effect gender or age group on the behavioral measures of interest, but did find a main effect of race (Table 4). Post-hoc analysis of race found a significant difference between white and non-white individuals on all four behavioral measures (Table 5). In the bivariate correlational analysis of the behavioral measures,
AUDIT-consumption, Current Binge and Binge <21 were significantly correlated (p < 0.05) (Table 6). Since ICR was not correlated with the alcohol measures, two separate FADTTS analyses were completed when analyzing the DTI data. In both instances, sex and age were controlled for before determining the effect of the variables of interest (ICR or AUDIT-consumption, Current Binge, Binge <21). The analyses were divided to increase power in FADTTS.
Diffusion Tensor Imaging Results
Impulsive Choice Ratio. We detected a significant negative correlation between FA and ICR in the temporal half of the bilateral fornix (Figure 2). The temporal portion of the bilateral tract curves laterally around the hippocampi. A similar trend is observed in the temporal end of the left and right inferior cingulum, which also curves with the hippocampi, with a large portion of the fiber showing a negative correlation between FA and ICR (Figure 3). While there are many points of statistical significance on the bilateral superior cingulum and uncinate, the correlation between FA and ICR varies around a beta of 0 and is not interpreted for meaningful significance (Figures 4 and 5).
Alcohol measures. Fornix. We detected no significant relationship between any of the alcohol measures and the diffusion parameters on the left fornix (Figure 6). In the right fornix, a larger area of significance was found in the temporal end of the fiber for Binge <21, showing a negative correlation between Binge <21 and FA (Figure 7). In other words, a greater levels of binge drinking prior to age 21 are associated with lower microstructural integrity of the right fornix.
Inferior Cingulum. An overall positive correlation between FA and both
AUDIT-consumption and Binge <21 was found in the left inferior cingulum (Figure 8). Thus greater levels of alcohol consumption and greater levels of binge drinking prior to 21 are associated with higher microstructural integrity in the left inferior cingulum. In the right inferior cingulum, we found a small area of positive correlation between FA and AUDIT-consumption at the posterior end and an overall positive correlation between FA and Binge <21 (Figure 9). So for the right inferior cingulum, greater levels of alcohol consumption and greater levels of binge drinking prior to 21 are associated with higher microstructural integrity
Superior Cingulum. In the left superior cingulum, analysis showed a negative correlation
positive correlation between FA and Binge <21 in the posterior portion of the left superior cingulum and positive correlation between FA and Current Binge in the frontal end of the fiber (Figure 10). In other words, the level of alcohol consumption is associated with decreased microstructural integrity in the left superior cingulum, while current binge drinking levels and the levels of binge drinking prior to 21 are associated with increased microstructural integrity. In the frontal end of the right superior cingulum, analysis showed a positive correlation between FA and current binge but a negative correlation with AUDIT-consumption and Binge <21 (Figure 11). The posterior end of the fiber shows a consistent negative correlation between FA and Binge <21. Thus in the frontal end of the right superior cingulum, current binge drinking levels are associated with greater microstructural integrity while levels of alcohol consumption are associated with decreased microstructural integrity. In the posterior end of the right superior cingulum, greater levels of binge drinking prior to 21 are correlated with decreased
microstructural integrity.
Uncinate. In the left uncinate, we found a consistent positive correlation between FA and
AUDIT-consumption along the length of the fiber (Figure 12). Additionally, we found consistent but overall negative correlation in the left uncinate between FA and both Current Binge and Binge <21. In other words, alcohol consumption is associated with greater microstructural integrity in the left uncinate, while both current levels of binge drinking and binge drinking prior to 21 are associated with decreased microstructural integrity. Finally in the right uncinate, analysis showed an area of stronger positive correlation between FA and consumption in the center of the fiber bundle and a negative correlation with
Structural MRI Results
After controlling for the effects of age and gender, none of the behavioral measures had a significant association with the cortical or subcortical volumes in any of the six regressions. The main effects of each variable in each of the six regression models is listed in Table 8.
Discussion
In this study, we sought to further understand how differences in drinking behavior in a sub-clinical population were associated with the differences in white matter microstructure integrity of fiber bundles carrying information between the frontal and medio-temporal lobes. In the majority of the fiber bundles we found a positive correlation between FA and
drinking is detrimental to the white matter integrity of the bundles that connect the frontal and temporal lobes across the adolescent to young adult lifespan.
Previous studies analyzing the quality of the white matter microstructure in current alcoholics demonstrated that greater levels of alcohol use was associated with lower integrity several white matter tracts in individuals with AUDs, including the cingulum, fornix, and uncinate (Pfefferbaum et al., 2006; Pfefferbaum et al., 2009; Trivedi et al., 2013). McQueeny and colleagues found lower FA in several limbic projection fibers, including the fornix and cingulum, when comparing binge and non-binge drinking adolescents (ages 16 to 19), while others have observed gray matter abnormalities in the hippocampus of adult alcoholics (McQueeny et al., 2009; Sullivan & Pfefferbaum, 2005).
Analyses of the white matter microstructure associated with impulsive choice
demonstrated a negative correlation between FA and impulsive choice on the temporal ends of the bilateral fornix and inferior cingulum. The fornix and cingulum run along the medial and lateral edges of the hippocampus, and it is this portion of the bundles that showed decreased microstructural integrity associated with high ICR. One of the prior studies that led to the current analysis implicated activity in the hippocampus as modulating the decrease in impulsive choice through episodic prospection in normal controls (Benoit et al., 2011; Peters & Buchel, 2010). Lower microstructural integrity was associated with greater impulsive choice only around the hippocampus, suggesting a specific association between impulsivity and the white matter circuitry associated with the hippocampus (Figure 13).
white matter bundles connecting frontal and temporal lobes than with the structural properties of the cortical and subcortical regions themselves, in a subclinical population. When comparing alcoholics to controls, prior literature analyzing structural MRI has found heavy drinkers and abstinent alcoholics to have lower volume in all the regions of the brain we investigated (De Bellis et al., 2005; Durazzo et al., 2011; Fortier et al., 2011; Makris et al., 2008; Momenan et al., 2012; Oscar-Berman & Song, 2011). Brain tissue analysis of alcoholics and controls found a lower density of both neuronal and glial cells in the OFC, while other structural MRI studies have shown individuals with AUDs to have a significantly smaller prefrontal cortex than controls. (De Bellis et al., 2005; Miguel-Hidalgo et al., 2006). Alcoholism is also associated with lower cortical volume overall (Pfefferbaum et al., 2006; Sullivan & Pfefferbaum, 2005). However, prior literature has focuses on abstinent alcoholics while our study imaged a currently drinking sub-clinical population.
Our findings suggest that in a sub-clinical population, the white matter microstructure is more vulnerable to alcohol than gray matter, findings that are supported by research in animal models. Intermittent alcohol use in adolescent rats found no long term effect on structural volumes, but did find alcohol-induced reductions in AD in the cerebellum, hippocampus, and neocortex (Vetreno, Yaxley, Paniagua, & Crews, 2015 ). Binge ethanol exposure in adolescent rats also lead to decreased neurogenesis in the dorsal and ventral hippocampus, which was associated with decreased adult cognitive functioning (Vetreno & Crews, 2015). Adolescent alcohol exposure was also associated with increased risk-choice preference in adult rats,
2014). Overall, research in animal models supports our findings in humans of a differential effect of alcohol on white matter due to binge drinking in adolescence.
Limitations
There are several limitations to consider in this study. First, the sample ranged in ages from 18 to 40, so binge drinking behavior over the past year and prior to 21 are equal for some individuals. In addition, prior literature suggests that the frontal lobe reaches full maturity around age 25. Therefore, binge drinking between ages 21 to 25 could have a greater adverse effect on the frontal lobe than drinking later in adulthood; however, information about binge-drinking specific to this period was not collected in the study design. Third, race was not evenly distributed within the groups by age and drinking level. The overall sample was 58.33% white, yet only 47.73% and 45.45% of the light drinking participants and emerging adults were white, respectively. Finally, the participants were still currently drinking when scanned. Previous studies have required participants to be abstinent on average two weeks, but ranging from 1 to 4 weeks (Durazzo et al., 2011; Fortier et al., 2011; Oscar-Berman & Song, 2011). As such, there may have been acute inflammation effects due to current alcohol in the current study sample, which has been shown to cause cell death (Crews & Nixon, 2009; Qin & Crews, 2012a, 2012b). At low levels of alcohol consumption the effects of acute inflammation would not be expected, but recent binge drinking episodes could affect an unknown proportion of our sample.
Conclusions
References
Benjamini, Y., & Hochberg, Y. (1995). Controlling the false discovery rate: a practical and powerful approach to multiple testing. Journal of the Royal Statistical Society, 57(Series B), 289-300.
Benoit, R. G., Gilbert, S. J., & Burgess, P. W. (2011). A neural mechanism mediating the impact of episodic prospection on farsighted decisions. J Neurosci, 31(18), 6771-6779. doi: 10.1523/JNEUROSCI.6559-10.2011
Boettiger, C. A., Mitchell, J. M., Tavares, V. C., Robertson, M., Joslyn, G., D'Esposito, M., & Fields, H. L. (2007). Immediate reward bias in humans: fronto-parietal networks and a role for the catechol-O-methyltransferase 158(Val/Val) genotype. J Neurosci, 27(52), 14383-14391.
Boutros, N., Semenova, S., Liu, W., Crews, F., & Markou, A. (2014 ). Adolescent intermittent ethanol exposure is associated with increased risky choice and decreased dopaminergic and cholinergic neuron markers in adult rats. Int J Neuropsychopharmacol 18(2). Brown, S., McGue, M., Maggs, J., Schulenberg, J., Hingson, R., Swartzwelder, S., . . . Murphy,
S. (2008). A developmental perspective on alcohol and youths 16 to 20 years of age. Pediatrics 121 (Suppl 4 ), 290-310.
Cardenas, V. A., Studholme, C., Meyerhoff, D. J., Song, E., & Weiner, M. W. (2005). Chronic active heavy drinking and family history of problem drinking modulate regional brain tissue volumes Psychiatry Research: Neuroimaging, 138, 115 – 130.
Casey, B., Giedd, J., & Thomas, K. (2000). Structural and functional brain development and its relation to cognitive development. Biol Psychol, 54, 241-257.
CDC. (2011). Excessive Drinking Costs U.S. $223.5 Billion. 2013, from http://www.cdc.gov/features/alcoholconsumption/
CDC. (2014). Fact Sheets: Alcohol Use and Health. from http://www.cdc.gov/alcohol/fact-sheets/alcohol-use.htm
Chanraud, S., Zahr, N., Sullivan, E. V., & Pfefferbaum, A. (2010). MR Diffusion Tensor
Imaging: A Window into White Matter Integrity of the Working Brain. Neuropsychology Review, 20(2), 209-225. doi: 10.1007/s11065-010-9129-7
Crews, F. T., & Nixon, K. (2009). Mechanisms of Neurodegeneration and Regeneration in Alcoholism Alcohol & Alcoholism, 44(2), 115–127.
Dale, A. M., Fischl, B., & Sereno, M. I. (1999). Cortical Surface-Based Analysis I: Segmentation and Surface Reconstruction. NeuroImage, 9(2), 179-194.
De Bellis, M. D., Narasimhan, A., Thatcher, D. L., Keshavan, M. S., Soloff, P., & Clark, D. B. (2005). Prefrontal cortex, thalamus, and cerebellar volumes in adolescents and young adults with adolescent-onset alcohol use disorders and comorbid mental disorders. Alcohol Clin Exp Res, 29(9), 1590-1600.
Durazzo, T. C., Tosun, D., Buckley, S., Gazdzinski, S., Mon, A., Fryer, S. L., & Meyerhoff, D. J. (2011). Cortical Thickness, Surface Area, and Volume of the Brain Reward System in Alcohol Dependence: Relationships to Relapse and Extended Abstinence Alcoholism: Clinical and Experimental Research, 35(6), 1187-1200.
Fedorov, A., Beichel, R., Kalpathy-Cramer, J., Finet, J., Fillion-Robin, J.-C., Pujol, S., . . . Kikinis, R. (2012). 3D Slicer as an Image Computing Platform for the Quantitative Imaging Network. Magnetic Resonance Imaging, July.
Fein, G., Di Sclafani, V., Cardenas, V. A., Goldmann, H., Tolou-Shams, M., & Meyerhoff, D. J. (2002). Cortical Gray Matter Loss in Treatment-Naïve Alcohol Dependent
Individuals Alcoholism: Clinical and Experimental Research, 26(4).
Fischl, B., Salat, D. H., Busa, E., Albert, M., Dieterich, M., Haselgrove, C., . . . Dale, A. M. (2002). Whole Brain Segmentation: Automated Labeling of Neuroanatomical Structures in the Human Brain. Neuron, 33, 341-355.
Fortier, C. B., Leritz, E. C., Salat, D. H., Venne, J. R., Arkadiy L. Maksimovskiy, V. W., William P. Milberg, and, & McGlinchey, R. E. (2011). Reduced Cortical Thickness in Abstinent Alcoholics and Association with Alcoholic Behavior Alcoholism: Clinical and Experimental Research, 35(12), 2193-2201.
Giedd, J. (2004). Structural magnetic resonance imaging of the adolescent brain. Ann N Y Acad Sci, 1021 77-85.
Goodlett, C. B., Fletcher, P. T., Gilmore, J. H., & Gerig, G. (2009). Group analysis of DTI fiber tract statistics with application to neurodevelopment. NeuroImage, 45(1, Supplement 1), S133-S142. doi: http://dx.doi.org/10.1016/j.neuroimage.2008.10.060
binge drinking. Neurotoxicology and teratology, 31(6), 349-355. doi: 10.1016/j.ntt.2009.07.006
Johnson, S. B., Blum, R. W., & Giedd, J. N. (2009). Adolescent Maturity and the Brain: The Promise and Pitfalls of Neuroscience Research in Adolescent Health Policy. The Journal of adolescent health : official publication of the Society for Adolescent Medicine, 45(3), 216-221. doi: 10.1016/j.jadohealth.2009.05.016
Kandel, D., & Logan, J. (1984). Patterns of drug use from adolescence to young adulthood: I. Periods of risk for initiation, continued use, and discontinuation. . Am J Public
Health 74 660-666.
MacKillop, J., Amlung, M. T., Few, L. R., Ray, L. A., Sweet, L. H., & Munafò, M. R. (2011). Delayed reward discounting and addictive behavior: a meta-analysis.
Psychopharmacology, 216(3), 305-321. doi: 10.1007/s00213-011-2229-0
Makris, N., Oscar-Berman, M., Jaffin, S. K., Hodge, S. M., Kennedy, D. N., Caviness, V. S., . . . Harris, G. J. (2008). Decreased Volume of the Brain Reward System in
Alcoholism Biological Psychiatry, 64, 192–202.
McQueeny, T., Schweinsburg, B. C., Schweinsburg, A. D., Jacobus, J., Bava, S., Frank, L. R., & Tapert, S. F. (2009). Altered white matter integrity in adolescent binge drinkers. Alcohol Clin Exp Res, 33(7), 1278-1285. doi: 10.1111/j.1530-0277.2009.00953.x
Miguel-Hidalgo, J. J., Overholser, J. C., Meltzer, H. Y., Stockmeier, C. A., & Rajkowska, G. (2006). Reduced glial and neuronal packing density in the orbitofrontal cortex in alcohol dependence and its relationship with suicide and duration of alcohol dependence. Alcohol Clin Exp Res, 30(11), 1845-1855.
Momenan, R., Steckler, L. E., Saad, Z. S., Rafelghem, S., Kerich, M. J., & Hommera, D. l. (2012). Effects of alcohol dependence on cortical thickness as determined by magnetic resonance imaging. Psychiatry Research: Neuroimaging(204), 101-111.
Monnig, M. A., Caprihan, A., Yeo, R. A., Gasparovic, C., Ruhl, D. A., Lysne, P., . . . Thoma, R. J. (2013). Diffusion Tensor Imaging of White Matter Networks in Individuals with Current and Remitted Alcohol Use Disorders and Comorbid Conditions. Psychology of Addictive Behaviors, 2, 455-465.
NIAAA. Moderate and Binge Drinking. 2014, from http://www.niaaa.nih.gov/alcohol-health/overview-alcohol-consumption/moderate-binge-drinking
NIAAA. (2014). Moderate and Binge Drinking. 2014, from http://www.niaaa.nih.gov/alcohol-health/overview-alcohol-consumption/moderate-binge-drinking
Oishi, K., Faria, A., van Zijl, P. C., & Mori, S. (2011). MRI Atlas of Human White Matter (Second ed.): Elsevier B.V.
Oscar-Berman, M., & Song, J. (2011). Brain volumetric measures in alcoholics: a comparison of two segmentation methods. Neuropsychiatric Disease and Treatment, 7, 65-75.
Peters, J., & Buchel, C. (2010). Episodic future thinking reduces reward delay discounting through an enhancement of prefrontal-mediotemporal interactions. Neuron, 66(1), 138-148. doi: 10.1016/j.neuron.2010.03.026
Petry, N. M. (2001). Delay discounting of money and alcohol in actively using alcoholics, currently abstinent alcoholics, and controls. Psychopharmacology (Berl), 154(3), 243-250.
Pfefferbaum, A., Adalsteinsson, E., & Sullivan, E. V. (2006). Dysmorphology and
Pfefferbaum, A., Rosenbloom, M., Rohlfing, T., & Sullivan, E. V. (2009). Degradation of Association and Projection White Matter Systems in Alcoholism Detected with Quantitative Fiber Tracking. Biological Psychiatry, 65, 680-690.
Pfefferbaum, A., & Sullivan, E. V. (2005). Disruption of Brain White Matter Microstructure by Excessive Intracellular and Extracellular Fluid in Alcoholism: Evidence from Diffusion Tensor Imaging. Neuropsychopharmacology, 30, 423-432.
Qin, L., & Crews, F. T. (2012a). Chronic ethanol increases systemic TLR3 agonist-induced neuroinflammation and neurodegeneration Journal of Neuroinflammation, 9. Qin, L., & Crews, F. T. (2012b). NADPH oxidase and reactive oxygen species contribute to
alcohol-induced microglial activation and neurodegeneration Journal of Neuroinflammation, 9.
Reynolds, B. (2006). A review of delay-discounting research with humans: relations to drug use andgambling. Behav Pharmacol 17 651-667.
Schulte, T., Muller-Oehring, E. M., Pfefferbaum, A., & Sullivan, E. V. (2010). Neurocircuitry of emotion and cognition in alcoholism: contributions from white matter fiber tractography. Dialogues Clinical Neuroscience, 12, 554-560.
Smith, C. T., & Boettiger , C. A. (2012). Age modulates the effect of COMT genotype on delay discounting behavior Psychopharmacology, 222, 609–617.
Smith, S. M., Jenkinson, M., Johansen-Berg, H., Rueckert, D., Nichols, T. E., Mackay, C. E., . . . Behrens, T. E. J. (2006). Tract-based spatial statistics: Voxelwise analysis of multi-subject diffusion data. NeuroImage, 31(4), 1487-1505. doi:
Song, S., Sun, S., Ju, W., Lin, S., Cross, A., & Neufeld, A. (2003). Diffusion tensor imaging detects and differentiates axon and myelin degeneration in mouse optic nerve after retinal ischemia. NeuroImage, 20, 1714-1722.
Sorg, S. F., Taylor, M. J., Alhasson, O. M., Gongvatana, A., Theilmann, R. J., Frank, L. R., & Grant, I. (2012). Frontal White Matter Integrity Predictors of Adult Alcohol Treatment Outcome. Biological Psychiatry, 71(262-268).
Sowell, E., Thompson, P., Tessner, K., & Toga, A. (2001). Mapping continued brain growth and gray matter density reduction in dorsal frontal cortex: Inverse relationships during
postadolescent brain maturation. J Neurosci, 21, 8819-8829.
Sullivan, E. V., & Pfefferbaum, A. (2005). Neurocircuitry in alcoholism: a substrate of
disruption and repair. Psychopharmacology, 180(4), 583-594. doi: 10.1007/s00213-005-2267-6
Townshend, J. M., & Duka, T. (2002). Patterns of alcohol drinking in a population of young social drinkers: a comparison of questionnaire and diary measures. Alcohol and alcoholism (Oxford), 37(2), 187-192.
Trivedi, R., Bagga, D., Bhattacharya, D., Kaur, P., Kumar, P., Khushu, S., . . . Singh, N. (2013). White matter damage is associated with memory decline in chronic alcoholics: A
quantitative diffusion tensor tractography study. Behavioural Brain Research, 250, 192-198.
Vargas, W. M., Bengston, L., Gilpin, N. W., Whitcomb, B. W., & Richardson, H. N. (2014). Alcohol Binge Drinking during Adolescence or Dependence during Adulthood Reduces Prefrontal Myelin in Male Rats The Journal of Neuroscience, 34(44), 14777-14782. Verde, A., Berger, J., Gupta, A., Kaiser, A., Chanon, V. W., Boettiger, C. A., . . . Styner, M.
Application to a Study of Nicotine Smoking Addiction. Paper presented at the Proceedings
of SPIE Medical Imaging, Orlando.
Vetreno, R. P., & Crews, F. T. (2015). Binge ethanol exposure during adolescence leads to a persistent loss of neurogenesis in the dorsal and ventral hippocampus that is associated with impaired adult cognitive functioning. Frontiers in Neuroscience, 9, 35. doi: 10.3389/fnins.2015.00035
Vetreno, R. P., Yaxley, R., Paniagua, B., & Crews, F. T. (2015 ). Diffusion tensor imaging reveals adolescent binge ethanol-induced brain structural integrity alterations in adult rats that correlate with behavioral dysfunction Addiction Biology 1369-1600
Vuchinich, R. E., & Simpson, C. A. (1998). Hyperbolic temporal discounting in social drinkers and problem drinkers. Exp Clin Psychopharmacol, 6(3), 292-305.
Yushkevich, P. A., Piven, J., Hazlett, H. C., Smith, R. G., Ho, S., Gee, J. C., & Gerig, G. (2006). User-guided 3D active contour segmentation of anatomical structures: Significantly improved efficiency and reliability. . Neuroimage, 31(3), 1116-1128.
Appendix A: Tables and Figures
Table 1:
Participant Demographics and Measures
Variable Number/Range Percentage/Mean ± SD
Gender (Female) 44 52.38%
Race (White) 49 58.33%
Age 18-40 26.04 ± 5.83
ICR 0-1 0.62 ± 0.34
AUDIT-consumption 0-9 3.55 ± 2.05
Current-Binge 0-52 6.70 ± 12.36
Table 2:
Participant Demographics and Measures by Drinking Group
Light Drinkers (n = 44) Heavy Drinkers (n = 40) Variable Number/Range Percentage/Mean ±
SD
Number/Range Percentage/Mean ± SD
Gender (Female)
24 54.56% 20 50%
Race (White) 21 47.73% 28 70%
Age 18-40 27.11 ± 6.63 19-37 24.85 ± 4.59
ICR 0-0.99 0.63 ± 0.34 0-1 0.61 ± 0.34
AUDIT-consumption
0-3 1.89 ± 0.99 4-9 5.39 ± 1.14
Current-Binge 0-30 1.30 ± 4.56 0-52 12.65 ± 15.26
Table 3:
Participant Demographics and Measures by Age Group
Emerging Adults (18-25, n = 44) Older Adults (26-40, n = 40) Variable Number/Range Percentage/Mean ±
SD
Number/Range Percentage/Mean ± SD
Gender (Female)
21 47.73% 23 57.5%
Race (White) 20 45.45% 29 72.5%
Age 18-24 21.24 ± 1.48 26-40 30.83 ± 4.41
ICR 0-1 0.66 ± 0.33 0-1 0.58 ± 0.34
AUDIT-consumption
0-9 3.74 ± 2.25 0-6 3.37 ± 1.84
Current-Binge 0-52 8.19 ± 14.23 0-52 5.21 ± 10.11
Table 4:
MANOVA: Multivariate Tests of Age and Gender Differences
Effect Value F Hypothesis df Error df Sig.
Intercept .832 90.137 4.000 73.000 <0.001
Race .175 3.882 4.000 73.000 0.006
Gender .010 0.190 4.000 73.000 0.943
Age .033 0.616 4.000 73.000 0.652
Race*Gender .006 0.117 4.000 73.000 0.976
Race*Age .070 1.378 4.000 73.000 0.250
Gender*Age .062 1.201 4.000 73.000 0.318
Race*Gender*Age .033 0.624 4.000 73.000 0.647
Note: Significant effects at an α < 0.05 are in italics.
Table 5:
Post-Hoc Tests for Main Effects of Race from MANOVA
Dependent Variable Type III Sum of Squares df Mean Square F Sig.
ICRavg .553 1 .553 5.065 .027
CAUPQ2_cont 723.376 1 723.376 5.056 .027
SumCAUPQ45 4103.185 1 4103.185 7.319 .008
AuditCgt4ifFgt5ifM 1.540 1 1.540 6.212 .015
Table 6:
Bivariate Correlations
arcsin √𝐼𝐶𝑅 AUDIT-consumption Current Binge Binge <21
arcsin √𝐼𝐶𝑅 r 1 -.001 .164 -.172
p .991 .137 .117
AUDIT-consumption
r -.001 1 .647 .337
p .991 <.001 .002
Current Binge r .164 .647 1 .367
p .137 <.001 .001
Binge <21 r -.172 .337 .36* 1
p .117 .002 .001
Note: Significant effects at an α < 0.05 are in italics. r is the Pearson Correlation, p is the probability of the reported correlation if there were no correlation between the two variables.
Table 7:
Functional Analysis of Diffusion Tensor Tract Statistics: Global Effects ICR AUDIT-consumption
Current
Binge Binge <21 Left Inferior
Cingulum
Main
Effect < 0.01 < 0.01 < 0.01 < 0.01
FA 0.64 0.37 0.15 0.12
RD 0.32 0.33 0.47 0.51
AD 0.11 0.64 0.42 0.14
MD 0.38 0.52 0.91 0.41
Left Superior Cingulum
Main
Effect < 0.01 < 0.01 < 0.01 < 0.01
FA 1.00 0.32 0.30 0.51
RD 0.99 0.46 0.76 0.29
AD 0.81 0.14 0.02 0.71
MD 0.74 0.54 0.34 0.30
Left Fornix Main
Effect < 0.01 0.37 0.26 0.36
FA 0.17 0.49 0.53 0.17
RD 0.83 0.83 0.84 0.20
AD 0.52 0.81 0.49 0.46
MD 0.71 0.97 0.82 0.25
Left Uncinate
Main
Effect < 0.01 < 0.01 0.01 < 0.01
FA 0.73 0.13 0.73 0.63
RD 0.68 0.09 0.49 0.59
AD 0.28 0.90 0.45 0.18
MD 0.50 0.26 0.34 0.25
Right Inferior Cingulum
Main
Effect < 0.01 < 0.01 < 0.01 0.01
FA 0.59 0.86 0.64 0.18
RD 0.74 0.68 0.45 0.20
AD 0.53 0.81 0.49 0.09
MD 0.73 0.71 0.42 0.15
Right Superior Cingulum
Main
Effect < 0.01 < 0.01 < 0.01 < 0.01
FA 0.75 0.71 0.87 0.46
RD 0.74 0.50 0.67 0.48
AD 0.74 0.45 0.63 0.39
MD 0.74 0.19 0.38 0.51
Right Fornix
Main
Effect < 0.01 < 0.01 < 0.01 < 0.01
RD 1.00 0.83 0.76 0.46
AD 0.68 0.75 0.66 0.20
MD 0.96 0.75 0.81 0.38
Right Uncinate
Main
Effect < 0.01 < 0.01 < 0.01 < 0.01
FA 0.99 0.74 0.55 0.48
RD 0.90 0.49 0.46 0.29
AD 0.69 0.31 0.12 0.59
MD 0.55 0.28 0.23 0.32
Note: A significant global p-value indicates a significant effect of the measure over the entirety
Table 8:
Multivariate Multiple Linear Regression: Main Effects Dependent Variable Set Independent
Variable
β F Sig.
Left Frontal Cortical ROIs Gender 0.35 4.04 0.0003
Age 0.30 3.32 0.002
arcsin √𝐼𝐶𝑅 0.05 0.39 0.93
AUDIT-consumption 0.09 0.76 0.65
Current Binge 0.16 1.41 0.20
Binge <21 0.13 1.11 0.37 Right Frontal Cortical ROIs Gender 0.42 5.4820 <0.0001
Age 0.42 5.51 <0.0001
arcsin √𝐼𝐶𝑅 0.28 1.67 0.11
AUDIT-consumption 0.07 0.54 0.84
Current Binge 0.15 1.35 0.23
Binge <21 0.08 0.63 0.77 Left Temporal Cortical ROIs Gender 0.46 6.53 <0.0001
Age 0.23 2.24 0.03
arcsin √𝐼𝐶𝑅 0.16 1.48 0.17
AUDIT-consumption 0.14 1.35 0.22
Current Binge 0.07 0.60 0.79
Binge <21 0.04 0.35 0.96 Right Temporal Cortical
ROIs
Gender 0.38 4.79 <0.000
Age 0.20 1.88 0.07
0.14 1.29 0.26
AUDIT-consumption 0.09 0.76 0.65
Current Binge 0.11 0.93 0.50
Binge <21 0.06 0.48 0.88 Left Subcortical Structures Gender 0.46 10.41 <0.0001
Age 0.09 1.21 0.31
arcsin √𝐼𝐶𝑅 0.05 0.65 0.69
AUDIT-consumption 0.08 1.04 0.41
Current Binge 0.08 1.04 0.41
Binge <21 0.11 1.43 0.22 Right Subcortical Structures Gender 0.44 9.48 <0.0001
Age 0.11 1.55 0.17
arcsin √𝐼𝐶𝑅 0.05 0.59 0.74
AUDIT-consumption 0.09 1.13 0.35
Current Binge 0.04 0.54 0.77
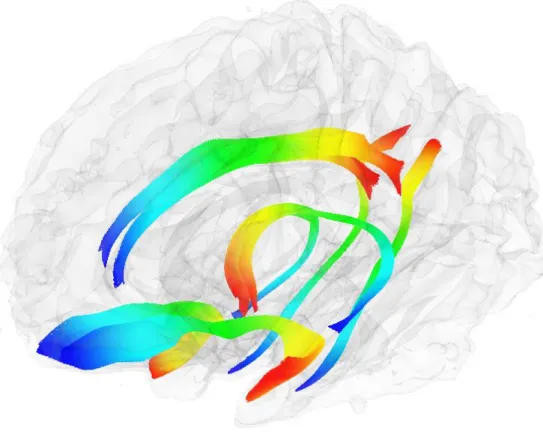
Figure 1: All Fibers of Interest and Relative Locations
Notes: The bilateral cingulum, fornix, and uncinate are visualized in a transparent brain
Figure 2: FADTTS Impulsive Choice Ratio, Fornixes
Notes: The beta plots for the left and right fornix show the correlation of ICR with each diffusion
Figure 3: FADTTS Impulsive Choice Ratio, Inferior Cingulums
Notes: The beta plots for the left and right inferior cingulum show the correlation of ICR with
Figure 4: FADTTS Impulsive Choice Ratio, Superior Cingulums
Figure 5: FADTTS Impulsive Choice Ratio, Uncinates
Notes: The beta plots for the left and right uncinate show the correlation of ICR with each
Figure 6: FADTTS Alcohol Measures, Left Fornix
Figure 7: FADTTS Alcohol Measures, Right Fornix
Figure 8: FADTTS Alcohol Measures, Left Inferior Cingulum
Figure 9: FADTTS Alcohol Measures, Right Inferior Cingulum
Notes: The beta plots for the right inferior cingulum show the correlation of each alcohol
Figure 10: FADTTS Alcohol Measures, Left Superior Cingulum
Figure 11: FADTTS Alcohol Measures, Right Superior Cingulum
Notes: The beta plots for the right superior cingulum show the correlation of each alcohol
Figure 12: FADTTS Alcohol Measures, Left Uncinate
Figure 13: FADTTS Alcohol Measures, Right Uncinate
Figure 13: ICR Associated with Decreased FA Lateral to Hippocampus
Notes: The bilateral fornix and inferior uncinates are visualized with significant FA beta