Identification of Novel Binding Targets of the SWI/SNF Complex Member SNF5 in Malignant Rhabdoid Tumors
Brian Robert Davies
A thesis submitted to the faculty of the University of North Carolina at Chapel Hill in partial fulfillment of the requirements for the degree of Master of Science in the Curriculum in Toxicology.
Chapel Hill 2011
Abstract
Brian R. Davies: Identification of Novel Binding Sites of the SWI/SNF Complex Member SNF5 in Malignant Rhabdoid Tumors
(Under the Direction of Dr. Bernard Weissman)
Malignant Rhabdoid Tumors (MRTs) show a loss of SNF5, a core subunit of the SWI/SNF chromatin remodeling complex. These cancers are genetically stable, but epigenetically unstable. We hypothesize that SNF5 loss fuels MRT
Table of Contents
Table of Figures ... iv
Table of Tables... v
List of Abbreviations ... vi
Chapter 1: Introduction ... 1
SWI/SNF Complex ... 1
SNF5 and Malignant Rhabdoid Tumors ... 4
Chapter 2: Materials and Methods ... 10
Chapter 3: RT2Profiler PCR Array... 16
Array Procedure ... 16
Array Validation ... 21
RT-PCR Results ... 28
Protein Expression Results... 28
Cell Cycle Analysis... 33
Chapter 4:Chromatin Immunoprecipitation... 38
Chapter 5: Gene Expression Array ... 50
Chapter 6: Discussion and Conclusions ... 61
Table of Figures
Figure 1: Data from A204.1 time course ... 22
Figure 2: Data from TTC642 time course... 25
Figure 3: Protein expression from A204.1 and TTC642 time courses ... 30
Figure 4: Analysis of CCNG2 knock down cell lines ... 35
Figure 5: CCNG2 ChIP Analysis ... 41
Figure 6: HERC5 ChIP Analysis. ... 45
Figure 7: ChIP analysis of the EBOX promoter region... 49
Figure 8: Ad-SNF5-HA Protein Expression... 52
Figure 9: Principle Components Analysis. ... 55
Figure 10: Analysis of GDF15 Expression by RT-PCR... 58
Table of Tables
Table 1: QPCR Primers Used for Chromatin Immunoprecipitation Analysis... 12
Table 2: Primer/Probe sets used for RT-PCR analysis of gene expression... 14
Table 3: Gene Expression Changes From RT2Profiler Array. ... 17
Table 4: Expression Changes Due to SNF5... 19
List of Abbreviations
Ad - Adenoviral Vector
AT/RT – Atypical Teratoid/Rhabdoid Tumor ATP – Adenosine Triphosphate
BRG1 – Brahma-Related Gene 1 BRM – Brahma
CCNG2 – Cyclin G2 CCNH – Cyclin H
cDNA – Complementary Deoxyribonucleic acid ChIP – Chromatin Immunoprecipitation
CMV – Cytomegalovirus Promoter DNA – Deoxyribonucleic Acid
GDF15 – Growth Differentiation Factor 15 GFP - Green Fluorescent Protein
HA – Hemagglutinin Tag
Rb – Retinoblastoma Protein
RT-PCR – Real Time Polymerase Chain Reaction siRNA – Small Interfering Ribonucleic Acid
Chapter 1: Introduction
SWI/SNF Complex
The SWI/SNF chromatin-remodeling complex is a member of a family of ATP dependent chromatin remodeling complexes. This complex is evolutionarily conserved from yeast to humans and plays a role in a large variety of cellular processes (1). The complex was originally characterized in yeast, and its name is based on the phenotypes observed when its components were deleted. Mutants that could not switch mating type (SWI) or that could not ferment
sucrose (Sucrose Non-Fermenting, SNF) were linked to defects in this complex. In mammalian cells, the complex contains two mutually exclusive ATPase
proteins, BRM (Brahma) or BRG1 (Brahma-related gene 1). These ATPases use the energy derived from ATP hydrolysis to break and reform nucleosome-DNA interactions. This process can lead to nucleosome sliding or eviction from the promoter regions of genes that are regulated by the SWI/SNF complex (1).
including four core subunits and various accessory subunits that can vary based on cell type or differentiation state. The core complex is composed of one ATPase, BAF155, BAF170, and SNF5 (SMARCB1, INI1, BAF47) (3). This is based on in vitro studies that have found that these four subunits can generate chromatin remodeling activity that is comparable to that of the entire complex (3). However, in vivo studies have found that the complex can still form and has some level of activity without the presence of SNF5 (4).
A wide variety of data has linked the SWI/SNF complex to cancer. This association can be at the level of the complex itself or with individual subunits within the complex. Presence of the functional complex is required for p53 transactivation of p53 regulated genes (5). The complex itself physically associates with p53, and is thought to help regulate its gene transcription and tumor suppressor activities (5). BRG1 loss has been observed in approximately 30% of non small cell lung cancers, implicating this protein as a tumor
suppressor gene (6). SNF5 loss has been observed in several cancer types, including malignant rhabdoid tumors (MRTs), choroid plexus carcinomas, and familial schwannamatosis (7). The presence of SNF5 is required for
complex with other tumor suppressor genes, such as c-MYC and MLL, have also been noted (1). Through microarray analysis SWI/SNF has been found to be involved in repression of gene expression more so than activation (1). Therefore, aberrant overexpression of critical target genes is thought to be a major
contributing factor to cancer development when the complex is not functioning properly.
ATP-dependent chromatin remodeling is a type of epigenetic regulation. Epigenetic changes are those heritable changes to gene expression that do not alter the DNA sequence (8). These changes can occur to either the DNA itself, such as methylation, or to histones, such as histone methylation. These two forms of epigenetic changes are the primary mechanisms by which epigenetic alterations are thought to contribute to tumorigenesis (8). Other types of
SNF5 and Malignant Rhabdoid Tumors
Malignant Rhabdoid Tumors (MRTs) are a rare and deadly form of pediatric cancer that typically develops at a young age. The average age of development is 15 months, though diagnosis can occur as early as birth (10). Pediatric neoplasms represent an exceptionally challenging subset of cancers to effectively treat. Physicians must weigh the benefits and risks of exposing young children to aggressive chemotherapeutic and radiation regimens, as these
treatments can result in extreme toxicities leading to cessation of treatment and developmental defects later in life (11). The standard procedure involves tumor resection when possible, followed by radiation and finally chemotherapy (11). The aggressive nature of these tumors is evident during treatment, as patients often die before chemotherapy can be initiated or early in treatment (11). Overall, the four year survival rate is only 8.8% with no effective radiation or chemotherapeutic treatment currently available (10).
differentiation related genes, which is interesting due to the fact that MRTs can be found in brain and neural tissues (13). Such observations have lead to the idea that neural progenitor cells may be a common cell type of origin.
An interesting series of cases has been described where parents of three children diagnosed with MRTs all worked in the same job site (14). This leads to the intriguing possibility that environmental factors may contribute to
predisposition to develop mutations or loss of SNF5, as this is an unusually high number of cases contained in a shared parental environment. It has long been suspected that parental exposure to toxic substances may lead to the
development of pediatric brain tumors (15). Thus, MRTs may be a unique model system in which epigenetic effects of toxic agents can be studied.
and mitotic failure (18). However, gene expression studies comparing MRTs to other pediatric cancers and normal tissues have revealed that despite the genetic stability, they display epigenetic instability (17). There is evidence that the
SWI/SNF complex can still assemble without the presence of SNF5, but likely has abnormal chromatin remodeling activity, which may account for the abnormal epigenetic regulation resulting in the observed epigenetic instability (19).
However, loss of both BRG1 and SNF5 results in a nonfunctional SWI/SNF complex, which confirms that there is some residual activity of the complex (4). The presence of a partially functional SWI/SNF complex along with genetic stability is likely why cells that lose SNF5 are still viable and able to proceed through oncogenesis, leading to the development of MRTs. Such a consistent and specific molecular change that occurs in these cancers provides a unique tool by which epigenetic studies can be performed in a genomically stable environment.
When functional SNF5 is introduced into MRT derived cell lines, a G1 growth arrest and cellular senescence are observed (20). This indicates that loss of SNF5 is critical for the development and sustained growth of these tumors. Canonical cell cycle mechanisms appear to be affected by the presence of SNF5, including the pRb-E2F pathway (p16INK4A and p21CIP1/WAF1) and p53 (21). These genes show significant gene expression changes when SNF5 is
bind to Rb (22), and SNF5 may be important in mediating or regulating the subsequent downstream events. It is important to note that full length functional SNF5 is required for growth arrest and the resulting events described above (23). This means that mutated or truncated forms of SNF5 that are found in some MRT lines, or that are introduced into MRT lines with complete SNF5 deletions, are unable to induce a growth arrest (23).
The full complement of gene promoters that SNF5 directly binds to upon introduction into deficient cell lines is not known. SNF5 has been shown to directly bind the p16INK4A and p21CIP1/WAF1 promoters, and SNF5 may modulate p21CIP1/WAF1 expression by recruiting p53 to the promoter (24). However, the exact mechanisms of SNF5 mediated growth arrest, such as transcriptional regulation or chromatin remodeling at binding sites, remains unclear. It has been observed that introduction of SNF5 leads to repression of Cyclin D1, with direct SNF5 binding to its promoter region (25). The authors observed histone
1) Activation of interferon responsive genes after SNF5 introduction into MRT lines has been observed (26). This observation may have potentially important in vivo roles, as suppression of interferon signaling may be a
mechanism by which MRTs could evade the immune system.
2) Mitotic spindle checkpoints were activated and induction of apoptosis genes were observed after SNF5 introduction (26).
3) Loss of SNF5 has also been shown to result in actin cytoskeleton disorganization and increased cellular motility, which may play a role in the aggressive and invasive nature of this tumor type (27).
4) The Hedgehog-Gli signaling pathway displays increased activity, which may contribute to rapid proliferation of cancerous cells (28).
Overall, many aberrantly expressed genes and cellular pathways could be playing a role in the development of MRTs upon the loss of SNF5 and altered SWI/SNF function. These observations lead to the hypothesis that SNF5 loss fuels MRT development through induction of epigenetic instability and aberrant gene expression through disruption of SWI/SNF ATP-dependent chromatin remodeling in promoter regions. More specifically, SNF5 reintroduction into MRTs will result in chromatin remodeling at target promoters resulting in altered gene expression. In order to test this hypothesis, high throughput screening techniques were utilized to find genes whose expression significantly changes when functional SNF5 is introduced to MRT cell lines. Subsequently, the proximal promoter regions were then examined using chromatin
Chapter 2: Materials and Methods
Cell Culture: A204.1 (American Type Culture Collection, ATCC) and TTC642
(Dr. Timothy Triche, Children’s Hospital of Los Angeles) were maintained in RPMI 1640 supplemented with 10% fetal bovine serum. The adenoviral vectors Ad/pAdEasyGFPINI-SV+ (Ad-SNF5-GFP) and Ad/pAdEasyGFP (Ad-GFP) have been described previously (29). The adenoviral vector Ad/pAdEasySNF5-HA (Ad-SNF-HA) was produced by Dr. Weissman and the UNC Vector Core Facility to contain SNF5 with a triple-HA tag at the C terminus. The Ad-CMV virus was obtained from the UNC Vector Core Facility and does not contain a transgene. Adenoviral infections were performed at a multiplicity of infection (MOI) to infect at least 90% of cells. The MOI used for A204.1 was 20 and TTC642 was 200. Infected cells were collected at the time points indicated in each experiment.
Western Blotting: Protein extractions were performed as described previously
(20). 30 µg of total proteins were separated on 4-12% SDS-polyacrylamide gels by electrophoresis. Proteins were transferred onto Immobilon-FL PVDF
from Dr. Huibregtse), anti-SNF5 (612110; BD Transduction), anti-Ku (gift from Dr. Ramsden), anti-GDF15 (gift from Dr. Eling) and anti-p21CIP1/WAF1 (AB1;
Calbiochem). Antibodies were visualized using either IRDye 800CW or IRDye 680 and with the LI-COR Odyssey Western Blot Detection System or by ECL-Plus (GE Amersham).
Chromatin Immunoprecipitation: Chromatin immunoprecipitation (ChIP) was
performed as described previously (30) with the following modifications: protein extracts were precleared with 40 µl of 50% protein A/protein G slurry.
Immunocomplexes were washed once with RIPA buffer, three times with Szak IP wash buffer, once with RIPA buffer, then twice with 1x TE. Immunocomplexes were eluted by the addition of 200 µl of 1.5x Talianidis elution buffer and
Table 1: QPCR Primers Used for Chromatin Immunoprecipitation Analysis. Both the forward and reverse primers are given for each site in the respective
promoters examined.
ChIP Primers
CCNG2 Site Forward Reverse
-3kb CACACTTGTCAGGAGTCAGGGATT TAATAAGCAGGGAGTGCCCACACA -660 AAACTCTCCCGTGGCTGAAA GCGCTTCTCCTAACAGCTAACCTT -109 AGAGAGGCTCGAGACGGCAGCTTA ATCCTGCACTTCCTCCACGGACTTTA -55 GGAAGTGCAGGATCCCTCCG TTTGTTAAGAGTTTCGACGCCC +500 CGCGATGGACAGATAGATGCTCGT AGACTGCCCTTAACCTAGTCGCAA +1013 TCAGGTGGGGCAGACCGAGG GTTTCACAAACAGGAAACTGTCCGC
HERC5 Site Forward Reverse
-3kb GTGCACTCATTCTCTAAGCCCACA TGTATCCCAGGTTCTTGCCTTGGT -500 CGGCGCACAACGCTTAACAAACTT ACGCATTTCCAGAGGGAGGGATAA TSS TTCTCTCCTCTCGCCTCTGGG AGGCGTTCTCTCCTCTCGCCTCT +1kb GCGTTTAACTACTGGACGTTTGCG AGCCAGGCAAAGATAAACAGGCA
EBox Forward Reverse
RNA extraction and RT-PCR: RNA was extracted using the RNeasy Plus mini kit
(Qiagen). cDNA was synthesized using 1 ug RNA primed with random primers (Invitrogen). cDNA was analyzed by RT-PCR using TaqMan (Applied
Biosystems). β-actin was used as a reference gene for each reaction. The ABI
7900 HT sequence detection system was used and data were analyzed by using the 2-ΔΔCt method (31). The primer/probe sets (Applied Biosystems) used for each
Table 2: Primer/Probe sets used for RT-PCR analysis of gene expression. Primer/Probe sets were obtained from ABI for determination of relative gene expression for the genes identified in this study.
Taqman Gene Expression Assays (ABI)
Beta-Actin Hs99999903_m1
CCNG2 Hs00171119_m1
HERC5 Hs00180943_m1
p21 Hs00355782_m1
Microarrays: PCR gene expression arrays were performed using a Biosciences
Human Cell Cycle RT2Profiler PCR Array. The Ad-Rb
Δcdk/Ad-SNF5-GFP vector system was used with the A204.1 cell line. Samples were collected 48 hours after adenoviral infection, and data was analyzed using the 2-ΔΔCt method. Agilent 4x44k microarrays were used with the Ad-CMV/Ad-SNF5-HA vector system in the A204.1 cell line. Samples were collected 9 hours after adenoviral infection, and data was analyzed using Partek software. Both array types were performed in triplicate.
Cell Cycle Analysis: TTC642 and all clones were infected with an MOI of 200 48
Chapter 3: RT2Profiler PCR Array
Array Procedure
Since cell cycle control appears to play a large role in SNF5 mediated growth arrest, we hypothesized that additional cell cycle related genes would show significant expression changes due to the presence of SNF5. A
Table 3: Gene Expression Changes From RT2Profiler Array. Summary of genes whose expression significantly changes upon adenoviral infection. These genes are either thought to be part of the Rb mediated growth arrest known to occur in Malignant Rhabdoid Tumors upon SNF5 reexpression. Rb related genes were eliminated from further analysis due to the well-characterized nature of the Rb mediated arrest in MRTs. Data are averaged from three independent replicates of RT2Profiler Array and are courtesy Dr. Aubri Charboneau and Dr. Bernard Weissman.
Table 3: Summary of gene expression common to Ad-RbΔcdk and Ad-SNF5-GFP infection of A204.1 cells
Gene Ave. Change (Range) Gene Ave. Change (Range)
RbΔcdk SNF5 RbΔcdk SNF5
Birc5/survivin -4.33 (2.03 to -7.94)
-1.60 (-1.26
to -1.90) MCM3 -1.64 (-1.39 to -1.99) -2.25 (-2.01 to -2.65) CCNE1/cyclinE1 -1.63 (-1.39
to -1.80) -1.89 (-1.73 to -2.06) MCM4 -3.21 (-1.90 to -4.39) -2.54 (-2.22 to -2.89)
CDC2 -2.64
(2.10 to -2.92)
-1.48 (-1.34
to -1.86) MCM5 -2.99 (2.12 to -4.39)
-1.72 (1.54 to -2.01)
CDK2 -2.64
(2.54 to -3.11)
-1.49 (-1.34
to -1.63) RAD51 -3.15 (2.15 to -5.01)
-1.77 (1.11 to -2.88) DDX11 -5.42
(4.77 to -6.19)
-2.76 (1.82 to -3.73)
RB1 16.62 (7.54 to 25.12)
1.13 (1.10 to 1.15)
MCM2 -2.57
(2.20 to -3.31)
From this array, six genes were identified where expression increased solely due to SNF5 infection (Table 4). This list included p16INK4A (p16) and
p21CIP1/WAF1 (p21), which have been previously characterized as having
Table 4: Expression Changes Due to SNF5. Genes whose expression
significantly changed solely due to the presence of SNF5, from three replicates of the RT2Profiler Array. Data are courtesy Dr. Aubri Charboneau and Dr. Bernard
Weissman.
Table 4: Summary of gene expression changes correlated to Ad-SNF5-GFP infection of A204.1 cells
Gene Ave. Change (Range)
RbΔcdk SNF5
This result indicated that the genes identified by the array may have biological significance as SNF5 binding targets, and that they may play a role in growth arrest. The other potential targets identified were Cyclin G2 (CCNG2), Cyclin H (CCNH), CDK8, and HERC5. CCNG2, a member of the non-canonical Cyclin G family, may function as a negative regulator of the cell cycle and shows reduced protein expression in oral cancers (34). The protein can associate with microtubules and overexpression contributes to a p53 mediated G1 growth arrest (35). Expression is high in several terminally differentiated tissues including nerve and muscle, further solidifying its role as a negative cell cycle regulator (36). Since the SNF5 mediated growth arrest is p53 dependent in A204.1 (24), this further indicates that CCNG2 may play a biologically relevant role in this process. CDK8, a member of the Mediator complex, is recruited to promoters undergoing active transcription by RNA Polymerase II (37). CCNH, which is a member of the cdk-activating complex, is involved in cell cycle control (38). HERC5 is a Hect3-type E3 ligase involved in conjugation of ISG15 to cellular proteins when an innate immune response is activated by interferon (39). ISG15 is a ubiquitin like post-translational modification added to proteins when cells are undergoing an interferon response (40). The role of ISG15 modification is
unknown, but is thought to disrupt protein-protein interactions (40). Interestingly, SNF5 introduction into rhabdoid tumors has been previously shown to activate interferon responsive genes, which are thought to contribute to G1 growth arrest (26). HERC5 may induce ISG15 modifications that may lead to the
Array Validation
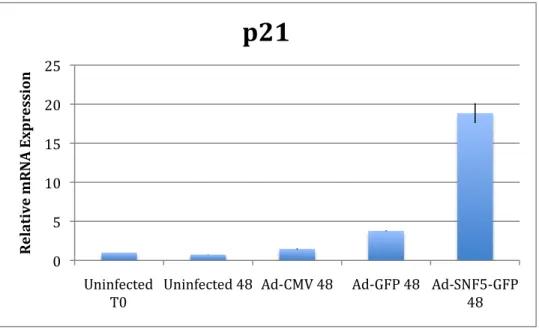
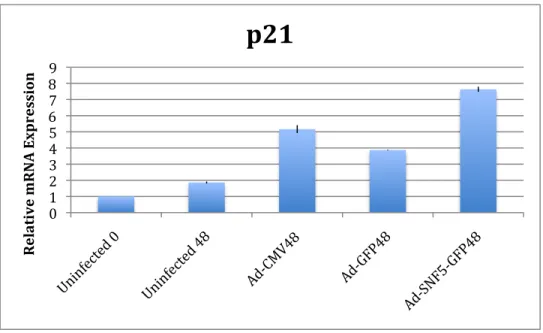
In order to validate the PCR array, we performed individual RT-PCR reactions on multiple independent infections. The Ad-GFP/Ad-SNF5-GFP vector system was tested in the A204.1 cell line as well as the TTC642 cell line. Both of these are soft tissue derived MRT cell lines with no functional SNF5 protein present. Like A204.1, TTC642 also contains a mutation in the SNF5 gene, which is a C118T transversion that creates a premature stop codon (32). Time courses were performed with three independent infections for both cell lines. Data for both protein and RNA expression was collected for each time course. A
representative example of an A204.1 time course mRNA analysis harvested at 48 hours after infection is given below in Figure 1. Figure 2 shows a
Figure 1A: A204 mRNA Expression
0 1 2 3 4 5 6 7
Uninfected T0 Uninfected 48 Ad-‐CMV 48 Ad-‐GFP 48 Ad-‐SNF5-‐GFP 48
R
el
at
iv
e
m R N A E xp re ssi on
HERC5
0 0.5 1 1.5 2 2.5 3 3.5 4 4.5 5
Uninfected
T0 Uninfected 48 Ad-‐CMV 48 Ad-‐GFP 48 Ad-‐SNF5-‐GFP 48
R
el
at
iv
e
m R N A E xp re ssi on
Figure 1A Continued:
0 5 10 15 20 25
Uninfected
T0 Uninfected 48 Ad-‐CMV 48 Ad-‐GFP 48 Ad-‐SNF5-‐GFP 48
R
el
at
iv
e
m
R
N
A
E
xp
re
ssi
on
Figure 2: TTC642 mRNA Expression
0 2 4 6 8 10 12 14 16
R
el
at
iv
e
m R N A E xp re ssi on
HERC5
0 0.5 1 1.5 2 2.5 3 3.5
R
el
at
iv
e
m R N A E xp re ssi on
Figure 2 Continued:
0 1 2 3 4 5 6 7 8 9
R
el
at
iv
e
m
R
N
A
E
xp
re
ssi
on
RT-PCR Results
Based on RT-PCR expression data, it appears that CDK8 does not increase in TTC642, but does increase in A204.1. CCNH appears to increase with SNF5 expression in both cell lines. However, preliminary analysis at the protein level indicated that these two genes did not show a significant increase. Based on the lack of positive controls for the antibodies, these two genes were not examined further. p21 increased significantly in both cell lines with SNF5 infection, as was expected. There is a large increase with the Ad-CMV vector in the TTC642 cell line, significantly above the other vector controls. Ad-SNF5-GFP still shows a significant increase despite this affect. HERC5 and CCNG2 only increased in the A204.1 cell line. HERC5 alone is increased in TTC642, yet it is not significant when compared to the controls.
Protein Expression Results
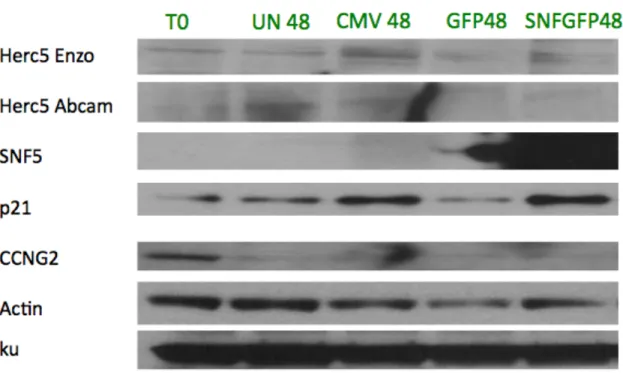
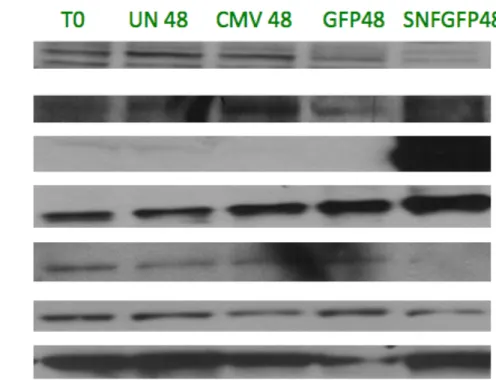
p21 showed a consistent increase in protein expression in both cell lines. The large p21 expression increase seen with Ad-CMV in TTC642 is not observed at the protein level. Two HERC5 antibodies were used, one commercially
Cell Cycle Analysis
In order to determine if CCNG2 plays a biologically relevant role in SNF5 mediated growth arrest, CCNG2 knockdowns were generated using stable cell lines containing siRNA against CCNG2. Three clones, along with a non-specific control, were generated in the TTC642 cell line by Dr. Yasumichi Kuwahara. The non-specific control used was PLKO, which is thought not to target any known sequence in the human genome. Generating knockdowns was not possible in A204.1, as attempts to do so resulted in complete cell death. Analysis of CCNG2 protein and mRNA expression for all clones are given in Figure 4A and B,
respectively. As seen in lane 5 of Figure 4A, only siCCNG2 clone 3 showed a decrease in expression of CCNG2 at the protein level. However, the message is decreased only for clones one and two, when compared to PLKO and the mass population (Figure 4B). The difficulty in generating a complete knockdown may be an indication that the presence of CCNG2 is necessary for survival of MRT cell lines.
growth arrest. It appears that there is a cell cycle defect in clone 3, where there is not a large change in S phase population between uninfected and Ad-SNF5-GFP infected. This may indicate that CCNG2 does indeed play a role in SNF5 mediated growth arrest. Based on these experiments, it is unclear whether the growth arrest is simply delayed, or there is a true defect in the knockdown cells. Further experimentation is necessary to determine the exact nature and
Figure 4A: siCCNG2 Western Blot Analysis
Figure 4B: siCCNG2 mRNA Analysis
0 0.2 0.4 0.6 0.8 1 1.2
TTC642 mp plko si-‐1 si-‐2 si-‐3
R
el
at
iv
e
m
R
N
A
E
xp
re
ssi
on
Clone
Figure 4C: siCCNG2 Cell Cycle Analysis
0 10 20 30 40 50 60 70 80 90 100
Parent PLKO siCCNG2-‐1 siCCNG2-‐3
Cell Population
G1
Uninfected Ad-‐GFP Ad-‐SNF5-‐GFP
0 10 20 30 40 50 60
Parent PLKO siCCNG2-‐1 siCCNG2-‐3
Cell Population
S
Chapter 4:Chromatin Immunoprecipitation
CCNG2 and HERC5 were chosen as the two strongest candidates discovered in the PCR array described in Section 1. In order to confirm these genes as true binding sites of SNF5, chromatin immunoprecipitation (ChIP) was performed across the promoter region of the gene of interest. This technique is used to indicate that SNF5 is directly binding to the promoter by precipitating short DNA fragments with an anti-SNF5 antibody. Briefly, this technique involves cross-linking proteins to DNA. The DNA is then sonicated into short fragments and antibodies against the proteins are used to immunoprecipitate fragments of DNA to which they are bound. This was done in both Ad-GFP and Ad-SNF5-GFP infected samples to determine the level of background for each antibody used. ChIP has been used by our lab in the past to show SNF5 binding to the p16 and p21 promoters (20, 24). In addition to SNF5 binding, other epigenetic and
transcriptional markers can be assayed by ChIP to indicate chromatin remodeling or the presence of the SWI/SNF complex at the promoter region. These marks can be used to confirm the genes as true SNF5 binding targets and can indicate chromatin-remodeling events that may contribute to the altered gene expression identified in the array. Primers spanning the promoter region, as well as a
upstream of the transcription start site, one on the transcription start site and two downstream sites. The sequences of the primers and genomic locations are given in Table 1. The +1013 site was designed based off work performed by Stossi et al (41). For HERC5, four sites were chosen using a similar method, also given in Table 1. DNA recovered by ChIP was used as input for qPCR, where the level of signal was used to indicate amount of DNA pulled down by the immunoprecipitation. The data were then normalized to total genomic DNA and analyzed by the percent recovery technique. This technique compares the amount of recovered DNA to input DNA, giving an idea of the amount of chromatin recovered by a particular immunoprecipitation (42). Our lab has traditionally used the E-BOX region as a negative control for this vector system, as there is no evidence for SWI/SNF binding to this region (24). ChIP analysis of the EBOX promoter is given in Figure 7
activity may be inadequate to generate a high level of transcription without
functional SNF5. Restoration of proper remodeling activity then may not show an increase in levels of the polymerase.
ChIP analysis of the HERC5 promoter region is shown in Figure 6. There is a clear binding of SNF5 to the promoter region, though it is significantly less than SNF5 binding to the CCNG2 promoter. There is a similar trend of
decreased Histone H3 occupancy in the promoter. An increase in H3K4m3 at the transcription start site is observed, but not at other sites within the promoter region. There is a large drop in the amount of RNA Polymerase II across the entire promoter region.
Figure 5: CCNG2 ChIP Analysis. ChIP analysis of the CCNG2 promoter region in A204.1 cells 24 hours after SNF5 introduction. Ad-GFP infections are shown in blue, Ad-SNF5-GFP infections are shown in red. Error bars indicate standard deviation between replicates. Two replicates for each promoter site were
Figure 5: CCNG2 ChIP Analysis
0 0.5 1 1.5 2 2.5 3
-‐3kb -‐660 -‐109 +500 +1013
%
Reco
ver
y
CCNG2 Promoter Site
RNA Polymerase II
Ad-‐GFP Ad-‐SNF-‐GFP
0 1 2 3 4 5 6
-‐3kb -‐660 -‐109 +500 +1013
%
Reco
ver
y
CCNG2 Promoter Site
Histone H3
Figure 5 Continued:
0 50 100 150 200 250 300 350 400
-‐3kb -‐660 -‐109 +500 +1013
%
Reco
ver
y
CCNG2 Promoter Site
H3K4m3/H3
Ad-‐GFP Ad-‐SNF-‐GFP
0 0.2 0.4 0.6 0.8 1 1.2 1.4 1.6 1.8
-‐3kb -‐660 -‐109 +500 +1013
%
Reco
ver
y
CCNG2 Promoter Site
SNF5
Figure 5 Continued:
0 0.005 0.01 0.015 0.02 0.025 0.03 0.035 0.04 0.045 0.05
-‐3kb -‐660 -‐109 +500 +1013
%
Reco
ver
y
CCNG2 Promoter Site
IgG
Figure 6: HERC5 ChIP Analysis. ChIP analysis of the HERC5 promoter region in A204.1 cells 24 hours after SNF5 introduction. Ad-GFP infections are shown in blue, Ad-SNF5-GFP infections are shown in red. Error bars indicate standard deviation between replicates. Two replicates for each promoter site were
Figure 6: HERC5 ChIP Analysis
0 0.02 0.04 0.06 0.08 0.1 0.12 0.14 0.16 0.18
-‐3KB -‐500 TSS +1kb
%
Reco
ver
y
HERC5 Promoter Site
RNA Polymerase II
Ad-‐GFP Ad-‐SNF5-‐GFP
0 1 2 3 4 5 6 7
-‐3KB -‐500 TSS +1kb
%
Reco
ver
y
HERC5 Promoter Site
Histone H3
Figure 6 Continued:
0 5 10 15 20 25 30 35 40 45
-‐3KB -‐500 TSS +1kb
%
Reco
ver
y
HERC5 Promoter Site
H3K4m3 / Histone H3
Ad-‐GFP Ad-‐SNF5-‐GFP
0 0.1 0.2 0.3 0.4 0.5 0.6
-‐3KB -‐500 TSS +1kb
%
Reco
ver
y
HERC5 Promoter Site
SNF5 (Imbalzano)
Figure 6 Continued:
0 0.1 0.2 0.3 0.4 0.5 0.6 0.7 0.8 0.9
-‐3KB -‐500 TSS +1kb
%
Reco
ver
y
HERC5 Promoter Site
SNF5 (Bethyl)
Ad-‐GFP Ad-‐SNF5-‐GFP
0 0.005 0.01 0.015 0.02 0.025 0.03 0.035 0.04 0.045 0.05
-‐3KB -‐500 TSS +1kb
%
Reco
ver
y
HERC5 Promoter Site
IgG
Figure 7: ChIP analysis of the EBOX promoter region. Antibodies are the same as described previously. Ad-GFP infections are shown in blue, Ad-SNF5-GFP infections are shown in red. Error bars indicate standard deviation between two replicates.
0 0.05 0.1 0.15 0.2 0.25 0.3 0.35
Histone H3 H3K4m3 / Histone H3
%
Reco
ver
y
EBOX
Ad-‐GFP Ad-‐SNF5-‐GFP
0 0.001 0.002 0.003 0.004 0.005 0.006 0.007 0.008 0.009 0.01
RNA
Polymerase II SNF5 IgG
%
Reco
ver
y
EBOX
Chapter 5: Gene Expression Array
The SWI/SNF complex is ubiquitously expressed in human tissues, and it is present throughout development. Due to this fact, many genes involved in diverse cellular processes can undergo SWI/SNF mediated chromatin
remodeling. The previous array was used to examine a specific subset of genes for SNF5 binding that are involved in a single cellular pathway. This is a narrow approach to identifying novel binding sites and genes that are involved in SNF5 mediated growth arrest in MRTs. However, it provided valuable insight into the possibility that high-throughput techniques could be utilized to examine SNF5 binding sites. To get an idea of different pathways that may be changing due to the presence of SNF5, whole genome gene expression microarrays were
chosen.
For this procedure, a different vector system was utilized in order to
reduce possible confounding factors, such as the presence of GFP. This system utilized an empty adenoviral vector, Ad-CMV, that does not contain any
Table 5: Gene Expression Array Results. Results from the combination of three replicates of Agilent 4x44K Human Gene Expression arrays. (A) Examination of potential target genes identified in the RT2Profiler PCR array. Comparison of
Ad-SNF5-HA cells to uninfected, mass population A204.1 cells. While p21 increases, no changes are statistically significant. (B) Comparison of gene expression in Ad-SNF5-HA vs. Ad-CMV at the 9-hour time point. Only GDF15 emerged as a statistically significant target. * = p=5.65e-6
(A). Ad-SNF-HA vs. Mass
Population
p21 1.33026
p21 1.52815
CCNG2 1.17115
CCNG2 -1.00784
CCNH 1.04945
CDK8 -1.11492
HERC5 -1.12318
(B). Ad-SNF-HA vs. Ad-CMV
The fact that none of the genes identified by the RT2Profiler PCR array were identified as significant in the Agilent 4x44K array is not surprising. The RNA collected for the array was harvested 9 hours after infection, while the RNA used for the RT2Profiler array was harvested 48 hours after infection. This time point may be too early to detect all of the changes that are occurring in gene expression, as there may still be low levels of SNF5 present in the cells.
GDF15 (Growth Differentiation Factor 15, NAG1, MIC-1) is a potential tumor suppressor gene that is regulated by histone acetylation (45). There is some evidence that this gene is down regulated in some brain tumors (45). As MRTs can arise in the brain, this is a potentially interesting and biologically relevant gene to understanding SNF5 function and MRT development. The protein is a member of the Tumor Growth Factor-β family, and is a downstream target of p53 (46). To assess GDF15 expression, RT-PCR was used with both Ad-SNF5-GFP and Ad-SNF5-HA 48 hours after infection. Although GDF15 was identified at the 9 hour time point, the 48 hour time point was chosen for
Figure 10A:
Figure 10B:
0 0.5 1 1.5 2 2.5 3 3.5 4 4.5
R
el
at
iv
e
m R N A E xp re ssi on
A204.1
0 5 10 15 20 25 30 35 40
R
el
at
iv
e
m R N A E xp re ssi on
Chapter 6: Discussion and Conclusions
Induction of gene expression, via restoration of functional SNF5 in MRTs, may be due to restoration of proper SWI/SNF maintenance of nucleosome positioning and epigenetic marking in their promoter regions. Based on current knowledge, both CCNG2 and HERC5 can contribute to processes that induce a growth arrest, and GDF15 is dependent on histone acetylation. This property of GDF15 fits well with our hypothesis. The growth arrest capabilities of CCNG2 and HERC5 also make sense as SNF5 introduction leads to growth arrest. ChIP analysis of both regions reveals SNF5 binding and possible epigenetic
alterations. However, the level of SNF5 binding at the HERC5 promoter region is less than the CCNG2 region, though significantly higher than the EBOX
et al, resulting in significant HERC5 conjugation (39). This level of expression was achieved in TTC642, therefore it is likely that HERC5 functional activity may be increased even without observing a protein increase. Since the HERC5 expression in TTC642 also increased with vector controls, ChIP analysis of the promoter region in this cell line may give an indication if this gene is a SNF5 binding target in both cell lines. Examination of ISG15 levels as well as other proteins involved in the HERC5 mediated interferon response pathway is
warranted to further validate or refute this gene as a SNF5 target. Based on the current data, we cannot rule out that HERC5 may be a novel binding target.
The protein expression of CCNG2 does not increase in either cell line, and mRNA expression only increases in the A204.1 cell line. This may be a result of tight regulation due to its role in cell cycle control. The fact that attempts to knock down CCNG2 expression in A204.1 failed indicates that some level of expression may be essential for survival. Cell cycle analysis of knockdowns in TTC642 indicated the possibility of a delayed or reduced growth arrest. These two results taken together may indicate that CCNG2 plays a biologically
significant role in SNF5 mediated growth arrest. The ChIP results showing strong SNF5 binding, and RT-PCR showing a RNA increase lead us to believe that CCNG2 is indeed a binding target of SNF5 despite the lack of protein increase. More extensive ChIP analysis of the promoter region including additional epigenetic marks or SWI/SNF complex members may shed light on other changes that are occurring to alter gene expression. Examination of
Epigenetic antagonism between the SWI/SNF complex and the polycomb complexes has been observed, with increased expression of some polycomb proteins in SNF5 deficient models such as MRTs (47). It is also unclear why the amount of RNA Polymerase II decreases at both the HERC5 and CCNG2
promoters after SNF5 expression. The immunoprecipitation performed examined total RNA Polymerase II. Examination of phosphorylation status may indicate if there is a change in the amount of active elongating polymerase or inactive polymerase. There may be less overall polymerase, but more of the polymerase could be actively transcribing the gene. It is known that RNA Polymerase II can pause at the +1 nucleosome position, and nucleosome remodeling can alter pausing and gene transcription (48). This may explain why the levels in the promoter appear to decrease while mRNA expression increases. The other genes identified in the RT2Profiler Array, CDK8 and CCNH, do not appear to be
novel SNF5 targets.
provide valuable insight into the mechanism of expression changes. Restoration of functional SWI/SNF may result in increased histone acetylation, as this is a mechanism of GDF15 regulation (45). Introduction of GDF15 into deficient cancer cell lines can reduce cell motility and invasiveness (46). If MRTs express comparatively low levels of GDF15 compared to normal cells, discovery of this protein may have revealed a key factor behind the aggressive nature of this cancer. The p53 regulation of this gene also fits nicely with the p53 dependent cell cycle arrest observed in some MRT lines (24, 46). Others have observed that GDF15 can act as a mediator of the p53/p21 pathway when a growth arrest is triggered (49). Such observations tie in with the original motivation behind this work to identify genes that may be contributing to the SNF5 mediated G1 growth arrest. Use of the genome wide Agilent 4x44k array at a later time point may reveal additional genes that may contribute to cell cycle arrest. The use of the array at 9 hours indicated that this is a useful high throughput technique to identify novel binding targets of SNF5 that may not be cell cycle related.
MRTs. They may play a role in the observed growth arrest; however, further characterization is warranted to solidify this hypothesis. Discovery of these genes as well as their connection to SNF5 may provide valuable information on how MRTs develop. These insights have the potential to provide novel
treatments for MRTs that may be safer and more effective that the currently available options. Both clinicians and basic science researchers will gain
valuable information into the molecular mechanisms behind this deadly pediatric cancer, that may ultimately improve the poor prognosis for this rare disease.
References
1. Roberts CWM, Orkin SH. The SWI/SNF Complex - Chromatin and Cancer. Nature Reviews Cancer 2004;4:133-42.
2. Euskirchen GM, Auerbach RK, Davidov E, et al. Diverse Roles and Interactions of the SWI/SNF Chromatin Remodeling Complex Revealed Using Global Approaches. PLoS Genetics 2011;7:e1002008.
3. Phelan ML, Sif S, Narlinkar GJ, Kingston RE. Reconstitution of a Core Chromatin Remodeling Complex from SWI/SNF Subunits. Molecular Cell 1999;3:247-53.
4. Wang X, Sansam CG, Thom CS, et al. Oncogenesis Caused by Loss of the SNF5 Tumor Suppressor Is Dependent on Activity of BRG1, the ATPase of the SWI/SNF Chromatin Remodeling Complex. Cancer Res 2009;69:8094-101. 5. Lee D, Kim JW, Seo T, Hwang SG, Choi E-J, Choe J. SWI/SNF Complex Interacts with Tumor Suppressor p53 and Is Necessary for the Activation of p53-mediated Transcription. Journal of Biological Chemistry 2002;277:22330-7. 6. Reisman DN, Sciarrotta J, Wang W, Funkhouser WK, Weissman BE. Loss of BRG1/BRM in Human Lung Cancer Cell Lines and Primary Lung Cancers: Correlation with Poor Prognosis. Cancer Res 2003;63:560-5.
7. Weissman B, Knudsen KE. Hijacking the Chromatin Remodeling Machinery: Impact of SWI/SNF Perturbations in Cancer. Cancer Res 2009;69:8223-30.
8. Momparler RL. Cancer epigenetics. Oncogene 2003;22:6479-83.
9. Kia SK, Gorski MM, Giannakopoulos S, Verrijzer CP. SWI/SNF Mediates Polycomb Eviction and Epigenetic Reprogramming of the INK4b-ARF-INK4 Locus. Molecular and Cellular Biology 2008;28:3457-64.
11. Biswas A, Goyal S, Puri T, et al. Atypical teratoid rhabdoid tumor of the brain: case series and review of the literature. Childs Nerv Syst 2009;25:1495-500.
12. Roberts CWM, Biegel JA. The role of SMARCB1/INI1 in development of rhabdoid tumor. Cancer Biology & Therapy 2009;8:412-4.
13. Gadd S, Sredni ST, Huang C-C, Perlman EJ, Group RTCotCsO. Rhabdoid tumor: gene expression clues to pathogenesis and potential therapeutic targets. Laboratory Investigation 2010;90:724-38.
14. Swinney RM, Bowers DC, Chen TTL, Tomlinson GE. Rhabdoid Tumors in a Shared Parental Environment. Pediatr Blood Cancer 2006;47:343-4.
15. Connelly JM, Malkin MG. Environmental Risk Factors for Brain Tumors. Current Neurology and Neuroscience Reports 2007;7:208-14.
16. Versteege I, Sevenet N, Lange J, et al. Truncating mutations of hSNF5/INI1 in aggressive pediatric cancer. Nature 1998;394:203-6.
17. McKenna ES, Sansam CG, Cho Y-J, et al. Loss of the Epigenetic Tumor Suppressor SNF5 Leads to Cancer without Genomic Instability. Molecular and Cellular Biology 2008;28:6223-33.
18. Bourgo RJ, Siddiqui H, Fox S, et al. SWI/SNF Deficiency Results in Aberrant Chromatin Organization, Mitotic Failure, and Diminished Proliferative Capacity. Molecular Biology of the Cell 2009;20:3192-9.
19. Doan DN, Veal TM, Yan Z, Wang W, Jones SN, Imbalzano AN. Loss of the INI1 tumor suppressor does not impair the expression of multiple BRG1-dependent genes of the assembly of SWI/SNF enzymes. Oncogene
2004;23:3462-73.
20. Chai J, Charboneau AL, Betz BL, Weissman BE. Loss of the hSNF5 Gene Concomitantly Inactivates p21CIP/WAF1 and p16INK4a Activity Associated with Replicative Senescence in A204 Rhabdoid Tumor Cells. Cancer Res
23. Versteege I, Medjkane S, Rouillard D, Delattre O. A key role of the hSNF5/INI1 tumour suppressor in the control of the G1-S transition of the cell cycle. Oncogene 2002;21:6403-12.
24. Kuwahara Y, Charboneau A, Knudsen ES, Weissman BE. Reexpression of hSNF5 in Malignant Rhabdoid Tumor Cell Lines Causes Cell Cycle Arrest through a p21CIP1/WAF1-Dependent Mechanism. Cancer Res 2010;70:1854-65.
25. Zhang Z-K, Davies KP, Allen J, et al. Cell Cycle Arrest and Repression of Cyclin D1 Transcription by INI1/hSNF5. Molecular and Cellular Biology
2002;22:5975-88.
26. Morozov A, Lee SJ, Zhang Z-K, Cimica V, Zagzag D, Kalpana GV. INI1 Induces Interferon Signaling and Spindle Checkpoint in Rhabdoid Tumors. Clin Cancer Res 2007;13:4721-30.
27. Caramel J, Quignon F, Delattre O. RhoA-Dependent Regulation of Cell Migration by the Tumor Suppressor hSNF5/INI1. Cancer Res 2008;68:6154-61. 28. Jagani Z, Mora-Blanco EL, Sansam CG, et al. Loss of the tumor
suppressor Snf5 leads to aberrant activation of the Hedgehog-Gli Pathway. Nature Medicine 2010;16:1429-33.
29. Reincke BS, Rosson GB, Oswald BW, Wright CF. INI1 Expression Induces Cell Cycle Arrest and Markers of Senescence in Malignant Rhabdoid Tumor Cells. Journal of Cellular Physiology 2003;194:303-13.
30. Gomes NP, Bjerke G, Llorente B, Szostek SA, Emerson BM, Espinosa JM. Gene-specific requirement for P-TEFb activity and RNA polymerase II phosphorylation within the p53 transcriptional program. Genes & Development 2006;20:601-12.
31. Livak KJ, Schmittgen TD. Analysis of Relative Gene Expression Data Using Real-Time Quantitative PCR and the 2-ddCt Method. Methods
2001;23:402-8.
32. DeCristofaro MF, Betz BL, Wang W, Weissman BE. Alteration of hSNF5/INI1/BAF47 detected in rhabdoid cell lines and primary
rhabdomyosarcomas but not Wilms' tumors. Oncogene 1999;18:7559-65. 33. Betz BL, Strobeck MW, Reisman DN, Knudsen EK, Weissman BE. Re-expression of the hSNF5/INI1/BAF47 in pediatric tumor cells leads to G1 arrest associated with induction of p16ink4a and activation of RB. Oncogene
34. Kim Y, Shintani S, Kohno Y, Zhang R, Wong DT. Cyclin G2 Dysregulation in Human Oral Cancer. Cancer Res 2004;65:8980-6.
35. Arachchige-Don AS, Dallapiazza RF, Bennin DA, Brake T, Cowan CE, Horne MC. Cyclin G2 is a centrosome-associated nucleocytoplasmic shuttling protein that influences microtubule stability and induces a p53-dependent cell cycle arrest. Experimental Cell Research 2006;312:4181-205.
36. Horne MC, Donaldson KL, Goolsby GL, et al. Cyclin G2 Is Up-regulated during Growth Inhibition and B Cell Antigen Receptor-mediated Cell Cycle Arrest. Journal of Biological Chemistry 1997;272:12650-61.
37. Donner AJ, Szostek S, Hoover JM, Espinosa JM. CDK8 Is a Stimulus-Specific Positive Coregulator of p53 Target Genes. Molecular Cell 2007;27:121-33.
38. Rossignol M, Kolb-Cheynel I, Egly J-M. Substrate specificity of the cdk-activating kinase (CAK) is altered upon association with TFIIH. The EMBO Journal 1997;16:1628-37.
39. Dastur A, Beaudenon S, Kelley M, Krug RM, Huibregtse JM. Herc5, an Interferon-induced HECT E3 Enzyme, Is Required for Conjugation of ISG15 in Human Cells. Journal of Biological Chemistry 2006;281:4334-8.
40. Durfee LA, Lyon N, Seo K, Huibregtse JM. The ISG15 Conjugation System Broadly Targets Newly Synthesized Proteins: Implications for the Antiviral Function of ISG15. Molecular Cell 2010;38:722-32.
41. Stossi F, Likhite VS, Katzenellenbogen JA, Katzenellenbogen BS. Estrogen-occupied Estrogen Receptor Represses Cyclin G2 Gene Expression and Recruits a Repressor Complex at the Cyclin G2 Promoter. Journal of Biological Chemistry 2006;281:16272-8.
45. Yoshioka H, Kamitani H, Watanabe T, Eling TE. Nonsteroidal
Anti-inflammatory Drug-activated Gene (NAG-1/GDF15) Expression Is Increased by the Histone Deacetylase Inhibitor Trichostatin A. Journal of Biological Chemistry 2009;283:33129-37.
46. Cheng J-C, Chang H-M, Leung PCK. Wild-Type p53 Attenuates Cancer Cell Motility by Inducing Growth Differentiation Factor-15 Expression.
Endocrinology 2011;15:E-pub Ahead of Print.
47. Wilson BG, Wang X, Shen X, et al. Epigenetic Antagonism between Polycomb and SWI/SNF Complexes during Onocgenic Transformation. Cancer Cell 2010;18:316-28.
48. Cairns BR. The logic of chromatin architecture and remodelling at promoters. Nature 2009;461:193-8.