ROLE OF CIRCULATING T CELLS IN AUTOIMMUNE KIDNEY
DISEASE: IMPLICATIONS FOR ANCA DISEASE AND MINIMAL
CHANGE DISEASE
Meghan Elizabeth Free
A dissertation submitted to the faculty of the University of North Carolina at Chapel Hill in partial fulfillment of the requirements for the degree of Doctor of Philosophy in Molecular and Cellular Pathology in the Department of Pathology and Laboratory Medicine, School of Medicine.
Chapel Hill 2013
ii ©2013
iii
ABSTRACT
MEGHAN E FREE: Role of Circulating T Cells in Autoimmune Kidney Disease:
Implications for ANCA Disease and Minimal Change Disease
(Under the direction of Dr. Ronald J. Falk, M.D.)
This dissertation is focused on circulating T cells and the role they play in the immunopathogenesis of two autoimmune kidney diseases: anti-neutrophil cytoplasmic
autoantibody (ANCA) disease and minimal change disease (MCD). Results demonstrated in the subsequent chapters explain known regulatory T cell defects in ANCA disease, reveal altered effector T cell dynamics in ANCA disease and present novel data of autoantibody/autoantigen interactions in minimal change disease.
Data presented in Chapter 1 addresses the known defect of regulatory T cell suppression in patients with ANCA disease. The lack of T cell suppression by ANCA disease regulatory T cells is confirmed in our patient cohort. However, our data reveal that a splice variant of FOXP3 lacking exon 2 is highly prevalent in ANCA disease patients and expression of exon 2-deficient FOXP3 correlates with a decreased suppressive function of the same regulatory T cells. Yet, the data in Chapter 1 also demonstrates that defective regulatory T cells are not the sole culprit of effector T cell non-suppression in ANCA disease patients.
iv
Chapter 2 focuses on the discovery of anti-TCR autoantibodies found in patients with minimal change disease. These anti-TCR autoantibodies target a specific subset of circulating T cells found at a higher frequency in MCD patients compared to healthy individuals. Additionally, this autoantibody/autoantigen interaction induces cellular activation leading to cytokine
v
ACKNOWLEDGEMENTS
The adventure and journey culminating in this dissertation and the start of my scientific career has been heavily influenced by a number of people. To these people, I am truly indebted and would like to formally acknowledge them.
Dr. Ronald Falk, my main graduate school mentor, has taught me numerous lessons, instilled priceless advice and has certainly shaped the scientist I am today. I will always think to view the research at hand, “from 30,000 feet,” to have a greater understanding of the problem at
hand. Dr. Charles Jennette has taught me to always examine the counterpoint to any issue. As a true, lifelong pathologist, he also taught me to consider long-held beliefs in the world of
pathology and their relevance to the research at hand. My clinical co-mentor, Dr. Maureen Su, has truly been invaluable over the years. She has been my immunology “lifeline” and prompts me to think outside the “kidney world” when necessary.
I would also like to thank the other members of my dissertation committee. Dr. Yuri Fedoriw and his never-ending scientific enthusiasm always brought a positive outlook to the table. Dr. Donald Cook, not only a member of my dissertation committee, but was my primary mentor for two years at NIEHS. As a fledgling scientist, Don never gave up on me and I am the scientist I am today because of many fundamentals he instilled in me.
The research members of the UNC Kidney Center have dually functioned as an extended family over the years. Dr. Gloria Preston, “lab mom,” was a constant presence in the lab and
vi
Henderson, I would not have any data without your “super powers” of patient consenting and
sample acquiring skills. Liz Alderman, Michael Brown, Anshul Badwhar and Jacob Hess were excellent sources of help and laughter. Kerry Colby, a great friend in science and non-science. Aleeza Roth was a great labmate for three years and will remain a great friend. Britta Jones has proven to be a great addition to the lab atmosphere despite the short amount of time she has been in the lab. Dr. Jennifer Vick has helped me in science and in life. The entire UNC Kidney Center has proven to be an excellent resource time and time again.
I am forever indebted to the Department of Pathology and Laboratory Medicine and my fellow classmates. Dr. Bill Coleman was more than a graduate studies advisor, sometimes invoking the role of “life” advisor. Dr. Jon Homeister has also served to be a source of help and
advice. Dr. Cyrus Vaziri taught me to continually be open-minded in science, and I will always be reminded to do so. Dorothy Poteat and Brenda Brock have made formalities of the department flow seamlessly.
The Cook lab at NIEHS fostered me as a fledgling scientist for two years. I am indebted to Dr. Hideki Nakano for teaching me the fundamentals of flow cytometry. Dr. Rhonda Wilson helped me and my science in numerous ways. Dr. Carl Bortner and Maria Sifre were instrumental in the flow core lab at NIEHS.
Dr. Stephen Clarke and Suzanne McCray took me on as an undergraduate interested in research and helped carve the path I am currently traveling. Dr. Lorraine Cramer was
instrumental as my undergraduate immunology instructor. She made immunology the most interesting field I was exposed to and helped turn immunology from something frightening into a source of answers.
My family and friends have been a constant source of encouragement and supply frequent doses of common sense and reality. To Mom and Dad for providing me with a
vii
electronic knowledge and Ethan continues to remind me of my place among the “nerds” while “setting traps” to keep me on my toes. Our lifelong family friend, Linda Miller, who dubbed me as having a “triple A” personality.
My friends outside of the science realm have provided me many an outlet from research life. Especially Bim Dang who has remained my friend since undergrad, despite my
idiosyncrasies. Daphne, my platelet-killing ITP ridden dog who has proven to be a constant source of entertainment and keeps me on my toes.
The patients from the UNC Nephrology clinics have provided invaluable samples, without which none of this research would be possible. Their selflessness in donating these samples has certainly changed my perspective of medicine and science. To my own personal physicians, you have kept me here and functioning to fulfill my goals, sometimes despite my own stubbornness.
viii
TABLE OF CONTENTS
LIST OF TABLES ... x
LIST OF FIGURES ... xi
LIST OF ABBREVIATIONS ... xii
PROLOGUE: T CELLS IN AUTOIMMUNE DISEASE ... 1
Effector T cell abnormalities in autoimmune disease ... 2
Regulatory T cell dysfunction in autoimmune disease ... 4
CD4+ T cells in ANCA disease ... 7
T cells in Minimal Change disease ... 8
Central Hypothesis ... 9
ANCA-ASSOCIATED VASCULITIS PATIENTS HAVE DEFECTIVE TREG FUNCTION EXACERBATED BY PRESENCE OF A SUPPRESSION-RESISTANT EFFECTOR POPULATION ... 10
Introduction ... 11
Materials and Methods ... 12
Results ... 16
Discussion ... 33
DISCOVERY OF NOVEL AUTOANTIBODIES AND AUTOANTIGEN IN IDIOPATHIC NEPHROTIC SYNDROME ... 37
Introduction ... 38
ix
Results ... 42
Discussion ... 67
SUMMARY ... 73
EPILOGUE: T CELLS IN AUTOIMMUNE KIDNEY DISEASE: IMMUNOPATHOGENESIS AND TREATMENT ... 75
T cell alterations in ANCA disease ... 75
Insight into the immunopathogenesis of MCD ... 76
Altering the paradigm of autoimmunity and autoimmune disease ... 77
Potential for improvement on current therapies ... 78
Future directions ... 80
Conclusions ... 84
x
LIST OF TABLES
xi
LIST OF FIGURES
Figure 1.1 Altered Treg function in AAV ... 18
Figure 1.2 Exon 2-deficient FOXP3 splice variant predominates in AAV ... 22
Figure 1.3 Altered T cell dynamics in PBMCs of AAV patients ... 24
Figure 1.4 Longitudinal studies of the CD25int population ... 25
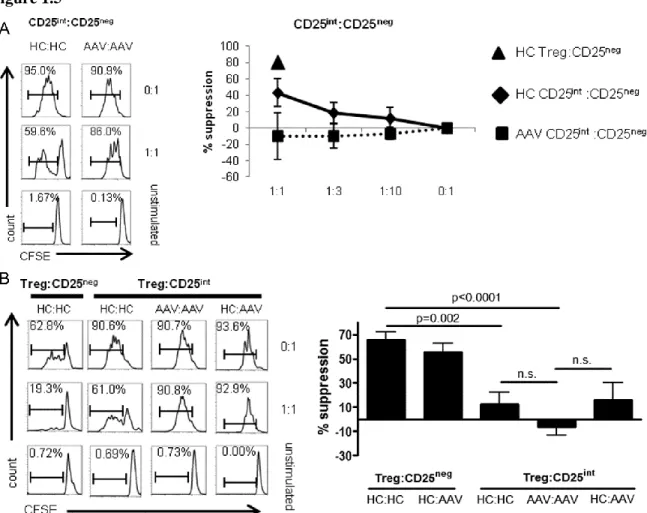
Figure 1.5 CD25int T cells are resistant to suppression compared to CD25neg T cells ... 28
Figure 1.6 FOXP3 expression between T cell subsets ... 29
Figure 1.7 Phenotypic analysis of CD25int T cells... 32
Figure 1.8 Cytokines expression from CD25neg and CD25int T cells ... 36
Figure 2.1 Patient IgG reactivity to TCR peptide ... 47
Figure 2.2 Antibody elution peaks from affinity-purification of anti-TCR autoantibodies by FPLC ... 49
Figure 2.3 Detection of “thymocyte-like” T cells in the periphery of MCD patients ... 52
Figure 2.4 Single cell fluorescent phenotype of “thymocyte-like” T cells ... 55
Figure 2.5 Anti-TCR autoantibodies induce cellular activation of target cells ... 57
Figure 2.6 Annexin positivity of “thymocyte-like” T cells ... 60
Figure 2.7 Presence of co-immunoprecipitating proteins with anti-TCR autoantibodies ... 62
Figure 2.8 Anti-TCR autoantibodies induce cytokine production from “thymocyte-like” T cells in MCD patients ... 65
xii
LIST OF ABBREVIATIONS
[A]
AAV anti-neutrophil cytoplasmic autoantibody associated vasculitis ANCA anti-neutrophil cytoplasmic autoantibodies
[B]
BVAS Birmingham vasculitis activity score [C]
c-ANCA cytoplasmic-antineutrophil cytoplasmic autoantibodies CCR5 C-C chemokine receptor type 5
xiii
CDR complementarity determining region CFSE carboxyfluorescein succinimidyl ester CNBr cyanogen bromide
CPT cell preparation tube
CXCR3 chemokine (C-X-C motif) receptor 3
[D]
DRB1*15 human leukocyte antigen-DRB1*15 DNA deoxyribonucleic acid
[E]
E-GPA eosinophilic granulomatosis with polyangiitis ELISA enzyme-linked immunosorbent assay
[F]
FACS fluorescence-activated cell sorting FBS fetal bovine serum
FITC fluoresceine-isothiocyanate FOXP3 forkhead box P3
FPLC fast protein liquid chromatography FSGS focal segmental glomerulosclerosis [G]
xiv [H]
HBSS Hank's balanced salt solution HC healthy control
HEPES 4-(2-hydroxyethyl)-1-piperazineethanesulfonic acid HLA human leukocyte antigen
[I]
IDEAS Image Data Exploration and Analysis Software IFNγ interferon gamma
Ig immunoglobulin
IgE immunoglobulin class E IgG immunoglobulin class G IL-1β interleukin 1 beta IL-2 interleukin 2 IL-4 interleukin 4 IL-5 interleukin 5 IL-6 interleukin 6
IL-7Rα interleukin 7 receptor chain alpha IL-8 interleukin 8
IL-10 interleukin 10 IL-13 interleukin 13 IL-17 interleukin 17 IL-23 interleukin 23
IV intravenous
[K]
xv [M]
MALDI-TOF/TOF matrix-assisted laser desorption ionization time of flight MCD minimal change disease
MHC major histocompatibility complex
mL milliliter
MPA microscopic polyangiitis MPO myeloperoxidase
mRNA messenger ribonucleic acid MS mass spectrometry
mTOR mammalian target of rapamycin MyH9 myosin heavy chain 9, non-muscle [N]
NCBI National Center for Biotechnology Information NFAT nuclear factor of activated T cells
[O]
OD optical density [P]
p-ANCA perinuclear- antineutrophil cytoplasmic autoantibodies PBMC peripheral blood mononuclear cell
PBS phosphate buffer solution PCR polymerase chain reaction PI propidium iodide
PMA phorbol myristate acetate PNPP para-nitrophenyl phosphate PR3 proteinase 3
xvi [R]
RA rheumatoid arthritis
RORα retinoic acid receptor-related orphan nuclear receptor alpha RORγt retinoic acid receptor-related orphan nuclear receptor gamma t
RPMI Roswell Park Memorial Institute medium
RT room temperature
[S]
SLE systemic lupus erythematosus
[T]
T1DM type 1 diabetes mellitus TCR T cell receptor
TGFβ transforming growth factor beta
Th1 T helper 1
Th2 T helper 2
Th17 T helper 17
TPCK L-1-tosylamido-2-phenylethyl chloromethyl ketone Treg regulatory T cell
[U]
UNC University of North Carolina at Chapel Hill
UV ultraviolet
[W]
WBC white blood cell [Y]
PROLOGUE: CIRCULATING T CELLS IN AUTOIMMUNE
DISEASE
The adaptive, antigen-specific immune system relies heavily on T cells with the capacity to adapt to the nuances of each pathogen. Healthy individuals maintain T cell homeostasis with regulatory T cell suppression of inappropriate effector T cell responses. In autoimmune diseases, there is a breakdown of this balance leading to uncontrolled autoreactive T cell responses. Possible T cell disturbances in autoimmune disease are any combination of the following: a lack or overrepresentation of certain T cell subsets, regulatory T cell dysfunction or inappropriate effector responses. However, autoimmune disease without a monogenetic cause cannot result from just one disturbance. It is more likely that multiple aberrations are interrelated in each autoimmune disease.
Autoimmune diseases affecting the kidney are numerous and include anti-glomerular basement membrane disease1, lupus nephritis2 and anti-neutrophil cytoplasmic autoantibody (ANCA) disease3. Additionally, there exist kidney diseases with suspected autoimmune
involvement, though lack direct evidence, as is the case with minimal change disease (MCD) and primary focal segmental glomerulosclerosis (FSGS)4.
Circulating autoantibodies are found in ANCA disease and these autoantibodies are class-switched and high affinity, indicating previous T cell help. Therefore, CD4+ T cells must play some role in the immunopathogenesis of ANCA disease. While even less is known about the role of T cells in MCD, anecdotal evidence is highly suggestive of some amount of T cell
2
context of medical intervention is crucial to achieve a better understanding of autoimmune disease.
Effector T cell abnormalities in autoimmune disease
CD4+ T cells comprise a large part of an individual’s adaptive immune system. Antigen
specificity of T cells provides tailored immunity towards any pathogen with potential for invasion. Additionally, CD4+ T cells can be further subdivided into different “helper” subsets, each with a different “preference” of pathogen and capacity for cytokine secretion. Until the
mid-2000s, immunologists had only defined two helper subsets, Th1 and Th2, which were thought to antagonize each other.
Th1 cells were directed against intracellular pathogens such as Listeria monocytogenes, and preferentially secreted IFN-gamma. For years, many autoimmune diseases were linked to a preponderance of Th1 cells or Th1-related cytokines. Both the mouse model of multiple sclerosis, experimental allergic encephalomyelitis, and the mouse model of insulin-dependent diabetes were generally accepted to result from a preponderance of Th1 cells5,6. However, many autoimmune diseases could not be categorized as Th1 or Th2-driven and presented as a mystery for years.
3
For decades, Th1 cells were thought to be the major T cell subset responsible for the immunopathogenesis of autoimmune diseases, however experimental research to this end has often returned conflicting results. The discovery of Th17 cells helped to reconcile many
discrepancies in the literature surrounding the pathogenic effector T cell in autoimmune disease7. Th17 cells are important in the clearance of extracellular bacteria and fungi by the secretion of IL-17A, IL-17F and other related cytokines. Current research in most autoimmune diseases has now demonstrated an increased frequency of Th17 cells in patients. Th17 cells are particularly adept at promoting tissue inflammation and recruitment of neutrophils to sites of inflammation8, therefore, it is not surprising that Th17 cells are found in targeted organs of various autoimmune diseases.
Further investigation into Th17 cell development revealed numerous similarities between Th17 and regulatory T cell differentiation. Both cell subsets require the presence of TGFβ for
differentiation9. This finding helped to reconcile an ongoing paradox in the inflammatory
literature as some experiments demonstrated the pro-inflammatory nature of TGFβ10 while others demonstrated an anti-inflammatory effect11. The defining feature of T cell differentiation is the microenvironment. If TGFβ is present, a naïve T cell will essentially “default” into an induced
4
Th17 and Treg cell differentiation are further linked by common transcription factor induction. Th17 cells are predominantly controlled by RORγt and Treg cells by FOXP3. Interestingly, naïve T cells in the presence of TGFβ express both RORγt and FOXP3 initially14
. It is only with further downstream commitment to T cell subsets that one transcription factor dominates the other. If TGFβ is present in a non-inflammatory milleu, FOXP3 antagonizes the function of RORγt, allowing a Treg program to initiate15. However, when TGFβ exists with IL-6, IL-1β or other pro-inflammatory Th17-inducing cytokine, RORγt will antagonize FOXP3, thus driving towards a Th17 cell16. This reciprocity in Th17 and Treg development underlines the potential for the immune system to go awry in autoimmune disease.
Regulatory T cell dysfunction in autoimmune disease
Autoreactive T cells occasionally escape thymic deletion and are released into the circulation. Despite the presence of circulating autoreactive T cells, most individuals do not development autoimmune disease. This is, in part, attributable to regulatory T cells and their ability to dampen inappropriate effector T cell responses. Tregs have been classically defined as CD4+ CD25high and FOXP3+ with the recent addition of CD127low 17,18. The transcription factor FOXP3+ is the critical component of functional Tregs as evidenced by patients with FOXP3 mutations, resulting in uncontrolled lymphoproliferation and numerous autoimmune diseases19. Along this line, scurfy mice with spontaneous mutations in FOXP3, demonstrate a fatal
5
Current research provides evidence that Tregs can suppress effector T cell proliferation and cytokine production through both direct and indirect means. Examples of some mechanisms of Treg suppression are secretion of anti-inflammatory cytokines, consumption of cytokine(s) needed for effector proliferation, cell surface molecule engagement and direct killing of effector T cells. Two anti-inflammatory cytokines produced by Tregs that are commonly focused on are TGFβ and IL-10. While controversial, TGFβ produced by regulatory T cells has been shown to
regulate effector T cell proliferation21. IL-10 is also frequently associated with Treg suppression, although IL-10 produced by Tregs seems to have differential effects depending on the involved organ22. Also controversial is the consumption of IL-2 by regulatory T cells, thereby starving effector T cells so proliferation does not proceed23. This makes teleological sense as Tregs have high expression of CD25, the receptor for IL-2, but these findings have been disputed over the years24. Additionally proposed is the hypothesis that regulatory T cells secrete granzyme A and induce effector T cell death through perforin25.
6
The decreased frequency of peripheral Tregs can be due to diminished induction of Tregs or altered survival of Tregs. However, enumeration of Tregs has been controversial over the years and in most autoimmune diseases, there is no consensus as to if Tregs are decreased, increased or equal to healthy control frequencies. Additionally, recent research has proposed that regulatory T cells may be unstable in chronic inflammatory states and can convert into other T cell
phenotypes27.
Dysfunctional Tregs that are unable to control effector proliferation is another common finding in autoimmune disease. Some studies suggest that this could be due to, in part, the inability of disease Tregs to secrete anti-inflammatory cytokines such as IL-1028,29. Treg
suppression assays are performed in vitro which are intrinsically problematic. Recent hypotheses have questioned whether the defect of suppression in vitro can be solely attributable to Tregs. This has led to research to probe the potential of effector T cells that resist Treg suppression.
In some cases, Tregs from a diseased individual may be capable of suppressing allogeneic cells from a healthy individual, but not their own autologous effector cells.
7 CD4+ T cells in ANCA disease
ANCA disease can manifest with systemic small vessel vasculitis, leading to organ damage of highly vascular organs such as kidneys, lungs and upper respiratory tracts. These vasculitides can be subdivided into granulomatosis with polyangiitis (GPA) formerly Wegener’s, microscopic polyangiitis (MPA) and eosinophilic granulomatosis with polyangiitis (EGPA) formerly Churg-Strauss syndrome. The common immunologic feature of these diseases is the formation of ANCAs that target either myeloperoxidase (MPO) or proteinase-3 (PR3) found in the granules of neutrophils and monocytes. The known production of autoantibodies in anti-neutrophil cytoplasmic autoantibody (ANCA) disease provides evidence towards T cell involvement in the autoimmune process3. Therefore, T cells in ANCA disease are likely to be dysregulated in some manner to permit autoantibody formation.
Pathogenic ANCAs cause activation of neutrophils resulting in degranulation and release of proteases36. In turn, this neutrophil activation leads to pauci-immune necrotizing crescentic glomerulonephritis and systemic small vessel vasculitis. Studies to incriminate a role for CD4+ T cells in ANCA disease have yielded results suggesting MPO or PR3 specific T cells exist in the periphery37,38 which proliferate in response to autoantigen. Other studies have also noted
8
Of additional concern are the studies demonstrating a functional deficit of Tregs in patients with ANCA disease43,44,45. However, no functional mechanism has been demonstrated for this Treg dysfunction. One hypothesis which may explain the functional deficit of Tregs in ANCA disease is that in the face of chronic inflammation, Tregs have converted into Th17 cells46,47,48,49. This phenomenon would not only diminish any suppressive function of the purported Tregs, but could potentiate ongoing inflammation by production of IL-17 and related cytokines.
T cells in Minimal Change disease
MCD accounts for the majority of nephrotic syndrome cases in children and FSGS may derive from an underlying etiology as MCD. Autoimmune involvement, specifically T cells, has been inferred by the efficacy in treating MCD patients with corticosteroids50 or medications that alter T cells such as cyclosporine51 or tacrolimus52. The pathologic finding in MCD is podocyte foot process effacement wherein slit diaphragms are lost and foot processes become fused. These cellular changes are visible only by electron microscopy53,54. For decades, it has been
hypothesized that a “permeability factor” in MCD patients induces podocyte effacement, although no factor has been inexplicably implicated55.
The role of T cells in MCD has perplexed investigators as T cells are rarely found in or around the glomerulus upon kidney biopsy in suspected MCD56. Therefore, the investigational focus has been on circulating T cells in patients with MCD. Early studies did note that CD4+ T cells had phenotypic markings of an “activated” phenotype in the periphery of MCD patients57,58
. However, the majority of studies have focused on secreted proteins from MCD T cells and their potential to be injurious to podocytes. A very early study noted that a “factor” was produced from PBMCs from MCD patients and the “factor” induced proteinuria when injected into rats59
9
The limitations from this study were 1) total PBMCs were used and it is unknown which cell type produced the “factor” and, 2) the “factor” was never identified. Later studies were refined and demonstrated a “factor” was produced by T cell hybridomas made from MCD patients55
. While this study implicated T cells as the cell type producing an injurious protein, the actual protein was still not identified but was hypothesized to be a “lymphokine.” More recently, IL-4 and IL-13
have been implicated as potential candidates as the glomerular permeability factor, and both of these cytokines are secreted by Th2 cells60. However, the field continues to rely on hypotheses and anecdotal evidence as to the true etiology of MCD.
Central Hypothesis
In summary, T cell dysfunction is incriminated in the majority of autoimmune diseases and provides insight into the immunopathogenesis and progression of disease. The central hypothesis of this body of work is that T cells are integral to the immunopathogenesis of ANCA disease and MCD. In addition to the central hypothesis, this body of work incorporates two main sub-hypotheses, 1) ANCA disease patients have dysfunctional regulatory T cells and an expanded effector population resistant to Treg suppression 2) MCD patients have circulating autoantibodies reactive to a T cell receptor present on peripheral “thymocyte-like” cells.
The central hypothesis and sub-hypotheses will be addressed in the following two chapters. Chapter 1 details the confirmation that Tregs from ANCA patients are incapable of suppressing effector T cell proliferation. Studies are also presented to demonstrate a contributing factor of Treg dysfunction—a splice variant of FOXP3. Additionally, a population of effector cells that are overrepresented in ANCA patients are functionally and phenotypically
Chapter 1
ANCA-ASSOCIATED VASCULITIS PATIENTS HAVE DEFECTIVE
TREG FUNCTION EXACERBATED BY PRESENCE OF A
SUPPRESSION-RESISTANT EFFECTOR POPULATION
This chapter consists of material from a manuscript reprinted with permission from
Arthritis and Rheumatism 20131 However, the breakdown in immune tolerance that results in the induction and persistence of ANCAs is not well-understood. We hypothesized that abnormal T cell regulation is central to disease pathogenesis and demonstrate here two separate abnormalities in T cell regulation in ANCA-associated vasculitis patients. Peripheral blood samples were obtained from patients with ANCA-associated vasculitis (n=63) and healthy controls (n=19) for flow cytometric analysis of CD4+ T cell populations. Functional T cell studies were performed with FACS sorted CD4+ T cell populations stimulated with anti-CD3/28. First, we show that the Treg frequency in the peripheral blood of active disease patients is increased, but Tregs from patients with ANCA-associated vasculitis have decreased suppressive function. Tregs from active disease patients disproportionately utilize a FOXP3 isoform lacking exon 2, which may alter Treg function. Second, we identify a CD4+ T cell population with increased frequency that is resistant to Treg suppression, produces pro-inflammatory cytokines, and is antigen-experienced. ANCA-
11
associated vasculitis is associated with disruption of the suppressive Treg network and increased frequency of a distinct pro-inflammatory effector T cell subset which comprises the majority of peripheral CD4+ T cells.
Introduction
T cells, an integral part of adaptive immunity, are additionally incriminated in a number of autoimmune diseases. The role of T cells in autoimmunity is diverse and can be attributed to multiple pathogenic mechanisms, including regulatory T cell (Treg) dysfunction61, effector hyperactivation62 and an imbalance of certain subsets31. Therefore, the contribution of T cells to the pathogenesis of a particular autoimmune disease is unlikely to stem from a single aberration.
CD4+ regulatory T cells (Tregs) are primary mediators of peripheral tolerance and express the master transcription factor FOXP363. A critical role for Tregs in preventing autoimmunity is demonstrated by the development of fulminant autoimmunity in rare patients lacking Tregs due to FOXP3 mutations19. How quantitative changes in Treg numbers and
function contribute to the pathogenesis of more common autoimmune diseases that do not involve FOXP3 mutations are less clear61.
Anti-neutrophil cytoplasmic autoantibody (ANCA)-associated vasculitis (AAV) is an autoimmune disease wherein patients have pathogenic autoantibodies reacting to
myeloperoxidase (MPO) or proteinase 3 (PR3) and exhibit necrotizing, crescentic
12
Although attention has focused on abnormalities intrinsic to Tregs in autoimmunity, recent evidence suggests that effector T cell resistance to Treg suppression may also contribute to the development of autoimmune disease62. We report herein the potential contributions of both Treg dysfunction and effector T cell resistance in AAV. Patient Tregs are defective in
suppressing effector CD4+ T cells and this dysfunction is correlated with increased usage of a FOXP3 splice variant. Additionally, patient peripheral blood samples demonstrate an increased frequency of a distinct CD4+ T cell population that is resistant to functional Treg suppression and secretes pro-inflammatory cytokines. Taken together, these data delineate two separate and novel mechanisms by which dysregulation of CD4+ T cells contribute to AAV.
Materials and Methods Patient cohort
Patients with biopsy-proven AAV enrolled in this study gave informed, written consent and participated according to UNC Institutional Review Board guidelines. Patient demographics were similar between healthy controls and AAV patients with the exception of age which was significantly lower in the healthy control cohort and are listed in Table 1.1.
13 Table 1.1 Patient demographics
ANCA-associated vasculitis (Total) Healthy Control (Total) ANCA-associated vasculitis (Functional studies) Healthy Control (Functional studies) Sex
Male 41.9% 47.2% 37.5% 33.3%
Female 58.1% 52.8% 62.5% 66.7%
Race
Asian 1.6% 0.0% 0.0% 0.0%
African American 12.9% 10.5% 25.0% 0.0%
Hispanic 1.6% 0.0% 0.0% 0.0%
Caucasian 83.9% 84.2% 75.0% 83.3%
Other 0.0% 5.3% 0.0% 16.7%
Mean Age 52.0 33.8 54.6 45.7
Range 13-86 20-54 24-79 26-54
Serology
MPO 42.9% NA 25.0% NA
PR3 57.1% NA 75.0% NA
Diagnosis
MPA 48.4% NA 25% NA
GPA 40.3% NA 62.5% NA
Renal limited 11.3% NA 12.5% NA
Mean BVAS* 7 NA 0.5 NA
Range 0.5-23 NA 0-4 NA
Mean Disease Duration (days)
Presentation to most recent follow-up 1957 NA 2136 NA
Range (days) 11-6809 NA 295-4417 NA
Medication use** (within 6 months prior to sample date of functional study
14
Oral cyclophosphamide 3.2% NA 0.0% NA
Mycophenolate mofetil 33.9% NA 50% NA
Glucocorticoid 43.5% NA 12.5% NA
Azathioprine 17.7% NA 12.5% NA
Rituximab 41.9% NA 37.5% NA
TOTAL
*BVAS average for AAV (total) only includes active patients
**Immunosuppressive medication
15 Cell isolation and flow cytometry
PBMCs were washed and resuspended in HBSS, 2% FBS, 0.1% sodium azide and stained with: CCR6, CD45RO, CD45RA (BD Biosciences), CCR5, CCR7, CXCR3, CD25, CD4, CD127, CD8, CD3 (BioLegend). For FOXP3 detection, cells were fixed and permeabilized using a FOXP3 Staining Buffer Set (eBioscience). FOXP3 was detected by clones PCH101
(eBioscience) and 150D (BioLegend). These two antibodies have previously been used to identify FOXP3 splice variants by flow cytometry68. We additionally confirmed the specificity of the antibodies by western blot (data not shown). Intracellular cytokine staining of IL-4 and -17 was performed after 4 hour stimulation with PMA and ionomycin while incorporating GolgiPlug (BD Biosciences). Cells were then permeabilized with CytoFix/CytoPerm (BD Biosciences) and stained with anti-IL-4 or anti-IL-17 (BioLegend). Cells were acquired on a BD LSRII and data was analyzed by FlowJo software (Tree Star, Inc.).
Suppression assays
Demographics for patients used in functional studies are shown in Table 1. PBMCs were isolated from heparinized peripheral blood by Histopaque-1077 (Sigma-Aldrich) and washed twice in HBSS plus 2% FBS. CD4+ T cells were isolated by EasySep® Human CD4+ T Cell Enrichment Kit (StemCell) and subsequently stained with the following fluorochrome-labeled anti-human antibodies: CD4, CD25 and CD127. Cell sorting was performed on an iCyt Reflection (Sony). Post-sort cell population purity was routinuely >95% for Tregs and CD25neg and >85% for CD25int with occasional CD25neg contamination.
16
Suppression assays using allogeneic Tregs were performed as previously described62, wherein 50,000 CFSE-labled effectors were plated in anti-CD3/28 pre-coated wells and proliferated for 4 days before analyzing on a BD LSRII.
Cytokine array and ELISA
To detect IL-17A or IL-4 in the cell culture supernatants we utilized a Human IL-17A ELISA MAX™ Deluxe and Human IL-4 ELISA MAX™ Deluxe (BioLegend). Cell culture
supernatants were analyzed for additional cytokine content using a multiplex assay, Beadlyte Human 22-plex (Upstate).
Statistics
The Wilcoxon rank-sum test was used for analysis of two groups. Kruskal-Wallis test was utilized in analyses involving more than two groups.
Results
Tregs from AAV patients are hypofunctional
To clarify if and how Tregs are abnormal in AAV we characterized Treg population dynamics in patients with active disease, in disease remission, and healthy controls. Tregs, defined as CD4+, CD25high, CD127low and FOXP3+17,18, were quantified as percentage of CD4+ T cells. We obtained remission and most proximal relapse samples from the same patient to
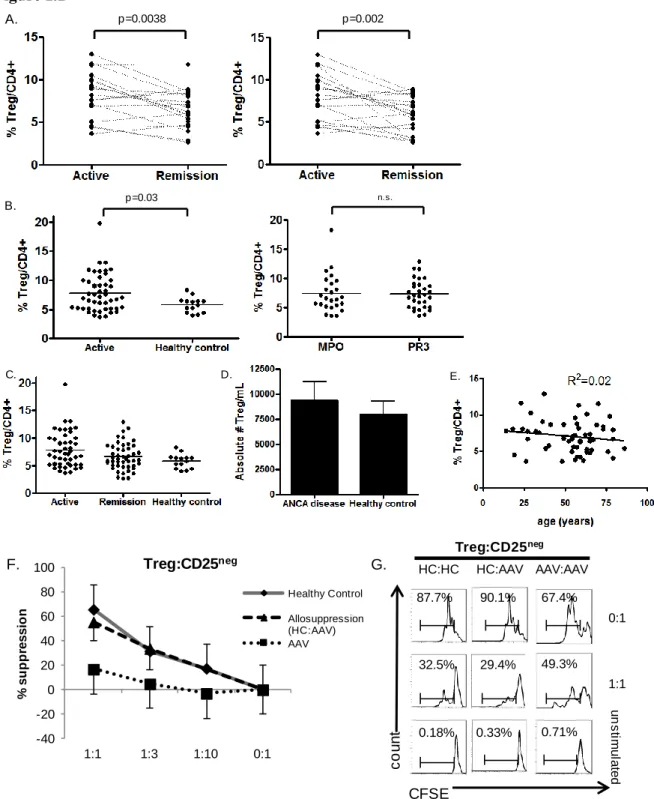
determine Treg population dynamics in internally controlled samples. In patients followed longitudinally, active disease was associated with an increased frequency (p=0.003) of Tregs compared to remission (Figure 1.1A left panel). We also obtained multiple remission samples on these patients, allowing us to compare the remission sample having the lowest Treg frequency with the active sample (Figure 1.1A right panel). The lowest Treg frequency occurred 6 months after relapse in most cases. Consistent with our previous data, active disease was associated with a higher frequency of Tregs in this analysis.
17
active disease compared to healthy controls (Figure 1.1B left panel). The Treg frequency was not significantly different between AAV patients in remission and healthy controls (Figure 1.1C). Absolute numbers of Tregs per mL of blood were calculated and were not statistically significant between AAV patients and healthy controls (Figure 1.1D). Additionally, there were no
differences in Treg frequency when comparing MPO and PR3 reactive AAV patients (Figure 1.1B right panel). As some reports have demonstrated increased Treg frequencies with increase in patient age70, we performed a linear regression analysis of Treg frequency and patient age (Figure 1.1E). Age and frequency of Tregs were not correlated in our cohort of AAV patients.
18 Figure 1.1
Figure 1.1. Altered Treg function in AAV. (A) Longitudinal studies of individual AAV patients indicated by dashed line. Active disease point compared to most proximal remission point (left panel). Active disease point compared to remission point with lowest Treg frequency (right panel)
p=0.0038 A. p=0.002 p=0.03 B. n.s. E. C. D. Treg:CD25neg HC:AAV AAV:AAV u n s tim u la te d 0:1 1:1 67.4% 49.3% 0.71% 90.1% 87.7% 29.4% 0.33% 32.5% 0.18% CFSE c o u n t HC:HC -40 -20 0 20 40 60 80 100
1:1 1:3 1:10 0:1
19
20
Tregs from AAV patients disproportionately utilize a variant FOXP3 isoform
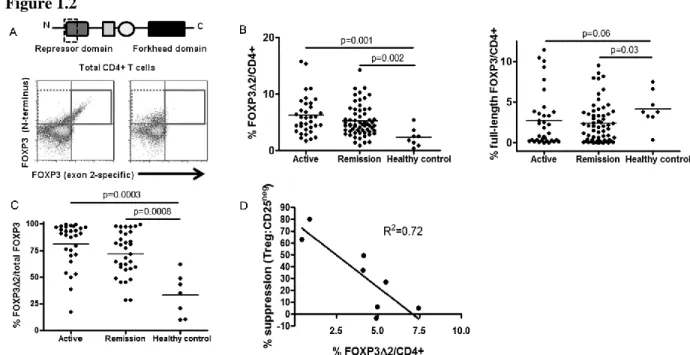
With confirmation of the functional deficit of Tregs from AAV patients we explored the underlying mechanism behind AAV Treg dysfunction. FOXP3 is the master transcriptional regulator of CD4+ Tregs and drives their suppressive regimen. FOXP3 has two isoforms in humans, full-length and exon 2-deficient, due to alternative splicing at the mRNA level72. Exon 2 lies within a repressor domain important in binding pro-inflammatory transcription factors, such as RORγt and RORα, which drive Th17 induction (Figure 1.2A, top)73,74
. Lack of this domain would be predicted to prevent repression of these Th17 transcription factors and promote Th17 lineage differentiation74. We hypothesized that increased expression of exon 2-deficient FOXP3 may contribute to non-suppressive function of AAV Tregs.
We utilized two FOXP3 antibodies recognizing two distinct domains on the FOXP3 protein. The FOXP3 antibody clone PCH101 recognizes the N-terminus and both isoforms of FOXP3 are recognized by this antibody. The FOXP3 antibody clone 150D recognizes the exon 2 portion of FOXP3 and only recognizes full-length FOXP3 containing exon 2. Western blots using the same FOXP3 antibodies confirmed the specificity of these antibodies for the two isoforms (data not shown). Additionally, these antibodies were previously used to distinguish these two FOXP3 isoforms by flow cytometry and have concordance with mRNA analysis of these two FOXP3 isoforms68. Consistent with these reports we found two staining patterns among Treg populations by flow cytometry. In some samples, CD4+ CD127neg CD25high cells Tregs stained positively with both antibody clones and therefore predominantly express full-length FOXP3 (Figure 1.2A, bottom left panel). In other samples, Tregs stained positively with only the N-terminus clone and therefore predominantly express exon 2-deficient FOXP3 (Figure 1.2A, bottom right panel).
21
compared to healthy individuals (Figure 1.2B left). Strikingly, exon 2-deficient FOXP3 is associated with both active and remitting disease (Figure 1.2B left). We also examined the frequency of cells expressing full-length FOXP3 in patients and healthy individuals. Overall, AAV patients tended to have a lower frequency of cells expressing full-length FOXP3 compared to healthy individuals (Figure 1.2B right). The increased frequency of exon 2-deficient FOXP3 is not solely due to the increased Treg frequency in active AAV because exon 2-deficient FOXP3 often exceeds >90% of total FOXP3+ cells (Figure 1.2C).
We correlated the degree of suppression when Tregs were cultured with syngeneic CD25neg T cells at a 1:1 ratio with the percentage of T cells utilizing exon 2-deficient FOXP3 to corroborate the hypothesis that exon 2-deficient isoform of FOXP3 is associated with Treg dysfunction. These two variables were inversely correlated (Figure 1.2D; R2=0.72),
22 Figure 1.2
23
Increased frequency of a distinct CD4+ CD25intermediate CD127high T cell population is associated with AAV
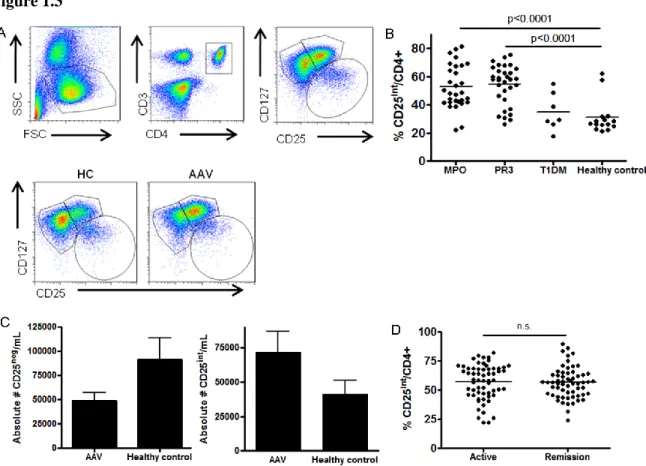
We used a recently described gating strategy17,18 to stratify CD3+ CD4+ T cells with CD127 and CD25 (Fig 1.3A, top panels) to examine effector and suppressor CD4+ T cell populations. T cell populations were dramatically altered between healthy controls and AAV patients (Figure 1.3A, compare two bottom panels). Most CD4+ T cells in healthy controls are CD127high CD25neg while the majority of patient CD4+ T cells are CD127high CD25intermediate (Figure 1.3A, bottom panels). The frequency of the CD25int population in AAV patients was significantly increased (p<0.0001) compared to healthy controls (Figure 1.3B). Both MPO and PR3 positive AAV patients demonstrated increased frequency of this population. The absolute number of CD25neg T cells in the peripheral blood of AAV patients is two-fold less than healthy controls, while the absolute number of CD25int T cells is two-fold higher in patients (Figure 1.3C). Therefore, there is an increased frequency of CD25int cells in AAV patients.
To determine if other autoimmune diseases have an increased frequency of this CD25int population we obtained samples from systemic lupus erythematosus (SLE), rheumatoid arthritis (RA), and type 1 diabetes mellitus (T1DM) patients. An increased frequency of this population occurred in SLE (data not shown; mean 52.1 ± 17.1%) and RA (data not shown; mean 48.3 ± 9.5%), but not in T1DM (mean 28.2 ± 12.4%) (Figure 1.3B). Thus, a higher frequency of CD25int T cells is not a universal property of all autoimmune diseases, but is associated with a subset of autoimmune diseases.
24 Figure 1.3
25 Figure 1.4
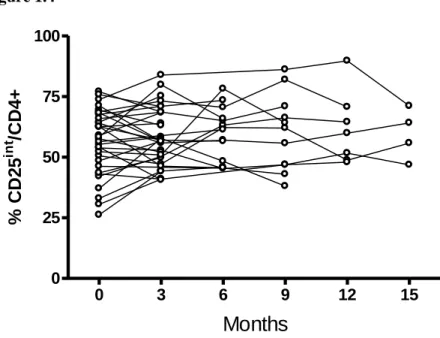
Figure 1.4. Longitudinal studies of CD25int T cells. The CD25int T cell population was monitored in patients every 3 months from time of entry into study. n=32 individual patients.
0 3 6 9 12 15
0 25 50 75 100
Months
%
C
D
2
5
in
t
/C
D
4
26
CD25int T cells are resistant to healthy control Treg suppression
CD25 expression is associated with both effector T cell activation and Tregs75. We therefore sought to determine whether the CD25int T cell population had effector or suppressor functions. Three CD4+ T cell populations were sorted by flow cytometry (CD25neg, CD25int and CD25high) as delineated in Figure 1.3A, top panels. Functional studies were performed with cells from healthy controls (n=4) and AAV patients (n=4).
Sorted CD25int T cells from AAV patients and healthy controls were serially diluted and cultured with syngeneic effectors stimulated with anti-CD3/CD28 to test potential suppressive function. As mentioned previously, CD25neg cells from healthy controls or AAV patients are equally susceptible to Treg suppression (Fig 1.1F). CFSE dilution in CD25neg effectors
determined the suppressive ability of CD25int T cells. As a positive control, we sorted bonafide CD25high CD127neg Tregs from a healthy control and showed that this population suppresses 70-80% of effector proliferation in this assay (Figure 1.5A, closed triangle). CD25int T cells from healthy controls have moderate suppressive ability as they suppressed 40% of effector
proliferation at a 1:1 ratio (Figure 1.5A, closed diamond). In contrast, sorted CD25int T cells from AAV patients were unable to suppress CD25neg effector proliferation (Figure 1.5A, closed squares). Analysis of FOXP3 expression among CD25int T cells revealed that they rarely express FOXP3 and therefore would not be predicted to have substantial suppressive function (Figure 1.6). However, an average of 3-4% of healthy CD25int T cells did express FOXP3 compared to less than 1% FOXP3+ in AAV. It remains possible that an additional suppressive CD127high T cell population, such as recently identified CD25low CD127high GITR+ T cells76, resides in the CD25int population in healthy controls. .
27
effectors. Only 10% of proliferation on average was suppressed at a 1:1 ratio of Tregs to CD25int T cells, whereas at a 1:1 ratio of Tregs to CD25neg effectors suppressed approximately 70% of proliferation on average (Figure 1.5B, right). CD25int cells from healthy controls are thus resistant to Treg suppression. Tregs were unable to suppress CD25int T cell proliferation (Figure 1.5B) when patient cells were tested. However, as we and others have demonstrated, patient Tregs have a functional deficit. Therefore the exact degree of suppression-resistance of CD25int T cells could not be ascertained from this particular experiment.
28 Figure 1.5
29 Figure 1.6
Figure 1.6. FOXP3 expression between T cell subsets. Representative FACS plots depicting FOXP3+ intracellular staining of CD25neg, CD25int and regulatory T cell populations.
CD25
C
D
1
2
7
FOXP3
F
SC
30
The CD25int T cell population is phenotypically distinct from the CD25neg population We hypothesized that CD25int T cells might have pathogenic effector T cell capacity since these cells are resistant to suppression. Thus, we investigated phenotypic differences between CD25int and CD25neg T cells. T cell cytokine profiles are a key determinant of T helper subsets and also indicate the immunomodulatory capacity of T cells. We used capture ELISAs to determine cytokine production in culture supernatants of stimulated, sorted T cell populations from healthy controls and patients. The CD25int population produced increased amounts of IL-17 and IL-4 compared to the CD25neg population; this corroborates our hypothesis that these cells act predominantly as effector cells (Figure 1.7A, left). IL-4 was never detected in the supernatants of stimulated CD25neg T cells from healthy controls or AAV patients (Figure 1.7A, left). There was no significant difference in IL-4 and IL-17A production between CD25int T cells from healthy controls or patients. Following short cultures with PMA and ionomycin, we also detected
intracellular IL-4 and IL-17 in T cells and these cytokine-producing cells localized predominantly to the CD25int population (Figure 1.7A, right). Thus, CD25int T cells are similar in cytokine secretion between AAV patients and healthy controls on a per cell basis. However, the absolute number of CD25int T cells is at least two-fold higher in patients and are therefore likely to produce more cytokines than healthy controls.
T cell populations utilize different chemokine receptors which allows for specialized functions such as exiting blood vessels and entering inflamed sites. We compared chemokine receptor expression between CD25neg and CD25int T cells from AAV patients to gain more insight regarding their function. These two populations differentially expressed CCR5 and CCR6. No significant differences in CCR7 and CXCR3 expression were observed. CD25neg T cells
31
32 Figure 1.7
33 Discussion
In conclusion, our data demonstrate two important findings: 1) Defective CD4+ Treg suppressive function in AAV which is associated with increased usage of a FOXP3 splice variant and 2) Increased frequency of a distinct effector CD4+ T cell population is associated with AAV patients which is resistant to Treg suppression. Both findings are critical to the understanding of AAV and autoimmune diseases in general by providing evidence that defects in T cell
suppression can stem from both suppressive and responder T cell populations.
Whether Tregs are intrinsically defective in number and function in AAV patients has been controversial43–45. Some controversy can be attributed to the fact that other reports examine Treg populations in patients with only remitting disease or only with granulomatosis with polyangiitis (formerly Wegener’s)43,44
. Our studies confirm that comparing Tregs across a large cohort of patients in relapse or remission is not straightforward. However, statistically significant changes in Treg populations are found when studies examine internally controlled active and remission samples, in concordance with Morgan et al44. We note that while Treg frequencies significantly change with disease activity, absolute numbers of Tregs are not statistically different from healthy controls. We can partially attribute this discrepancy to altered numbers of effector T cells, specifically decreased numbers of CD25neg T cells in AAV (Figure 1.3C). It remains possible that transient lymphopenia induced during flares of disease could globally affect the T cell pool which may be reflected by increased frequency of Tregs. It is less likely that
glucocorticoids could impact Treg frequencies in that 9 of 20 patients in the paired Treg studies had continuous or no glucocorticoid use during sampling. Additional controversy surrounds the markers used to identify Treg populations. We utilize a highly specific method for phenotypic classification of CD4+ FOXP3+ T cells based on surface markers of CD4+ CD25high CD127low
17,18
.
34
collection every three months. During this time many patients’ immunosuppressives were
changed, yet Treg population changes only occurred with changes in disease activity and the CD25int population remained unchanged despite medication alterations. Additionally, 41.9% of our patient cohort was exposed to Rituximab during sample acquisition (Table 1). While
monoclonal anti-CD20 antibodies target the depletion of circulating B cells, there are likely to be unknown off-target effects of Rituximab on peripheral T cells. The effects of Rituximab on T cell populations in ANCA disease have not been directly examined, however studies in other diseases have noted reduced Th17 responses and depletion of a controversial CD20+ T cell population77,78. Despite this, our data demonstrates a robust Th17 response from CD25int T cells in our cohort. Yet we do acknowledge that future studies should examine the effects of Rituximab treatment on T cell populations of ANCA disease patients.
Our data demonstrate that AAV Tregs have an increased frequency in active disease that is linked with defective function. We further demonstrate that this dysfunction is associated with increased usage of an exon 2-deficient FOXP3 splice variant. In fact, the majority of FOXP3+ T cells in AAV patients are exon 2-deficient. Healthy controls with minimal exon 2-deficient FOXP3 have a normal suppressive function while AAV patients lose suppressive function as there is an increase in the usage of exon 2-deficient FOXP3. One other study has utilized this method to examine FOXP3 isoforms in the peripheral blood of inflammatory bowel disease patients. Yet that study found no differences in isoform usage between patients and healthy controls68. Therefore, our study is the first to identify a patient population that significantly differs in FOXP3 isoform usage compared to healthy controls. We hypothesize that the suppressive regimen of Tregs is lost when exon 2 of FOXP3 is aberrantly spliced. Exon 2 of FOXP3 comprises part of the repressor domain which sequesters other proteins, such as RORγt and
2-35
deficient FOXP3 were the main producers of IL-17 among FOXP3 expressing cells68. Therefore, exon 2-deficiency may alter FOXP3 and Treg function in AAV and increased exon 2-deficiency predicts a lack of suppressive ability.
Our identification of a distinct CD4+ effector T cell (CD25int) reveals additional T cell dysregulation in AAV patients. The increased frequency of CD25int T cells, and their CD45RO positivity, leads us to hypothesize that this population may be a clonal expansion of autoreactive cells. A study by Hirota et al suggests that CCR6-expressing Th17 cells were the
tissue-infiltrating pathogenic T cell in RA80. Therefore, we hypothesize that CCR6-expressing, IL-17-producing CD25int T cells may be able to infiltrate sites of inflammation in AAV and contribute to tissue immunopathogenesis. Consistent with their resistance to Treg suppression, CD25int T cells produce elevated levels of the pro-inflammatory cytokines IL-4 and IL-6 (Figure 1.8), which have been associated with resistance to Treg suppression31,81. CD25int T cells also produce robust amounts of IL-17A which has been described to be elevated in AAV patients41,42. The data presented herein demonstrate that not only are Tregs implicated in immune dysregulation in AAV, but that a CD25int effector population compounds the dysregulation through suppression resistance and production of pro-inflammatory cytokines. Combination of these events could permit the formation of ANCAs, thereby perpetuating the disease. Several patient samples were obtained at presentation of disease and the CD25int population was already increased in
frequency. Therefore, alterations of the CD25int population precede disease presentation and must play a role in disease immunopathogenesis.
36 Figure 1.8
Figure 1.8. Cytokine expression from CD25neg and CD25int T cells. Cytokine profiles of T cell subsets from healthy controls (open circles) and ANCA disease patients (closed diamonds). CD25neg and CD25int T cells from healthy controls and patients with ANCA disease were sorted and subsequently stimulated with anti-CD3/-28 for 4 days. Cell supernatants were then harvested and analyzed by cytokine multiplex.
0 500 1000 1500 2000 2500 3000 3500 IL -3 ( pg /m L) 0 50 100 150 200 250 300 IL -5 ( pg /m L)
CD25- CD25int
CD25- CD25int CD25- CD25int
0 20 40 60 80 100 120 IL -6 ( p g /m L ) 0 500 1000 1500 2000 IL -8 ( pg /m L) 0 2000 4000 6000 8000 10000 12000 14000 IL -1 0 ( p g /m L )
CD25- CD25int
CD25- CD25int CD25- CD25int
0 200 400 600 800 1000 IL -1 2 ( p 4 0 ) (p g /m L ) 0 1000 2000 3000 4000 5000 IL -1 3 ( p g /m L ) 0 2000 4000 6000 8000 10000 12000 IF N g a m m a ( p g /m L )
CD25- CD25int
Chapter 2
DISCOVERY OF NOVEL AUTOANTIBODIES AND
AUTOANTIGEN IN IDIOPATHIC NEPHROTIC SYNDROME
38 Introduction
Idiopathic nephrotic syndrome, including minimal change disease (MCD) and focal segmental glomerulosclerosis (FSGS), affects podocyte architecture and thus the ability of the glomerular filter to prevent urinary protein loss. The initial hypothesis that idiopathic nephrotic syndrome resulted from T-cell dysfunction was put forth in 1974 by Dr. Shalhoub 4. Shalhoub hypothesized that a clone of T cells produced a “lymphokine” that was toxic to the glomerular
basement membrane. Subsequent studies have attempted to identify the “permeability factor” responsible for nephrotic syndrome. IL-8 and IL-13 have been proposed as mediators of minimal change disease by several studies60,83. One study has suggested that soluble urokinase receptor (suPAR) causes podocyte injury in FSGS84, although controversy surrounds this proposal. Another recent hypothesis of the etiology of MCD is that CD80 is upregulated on podocytes in MCD, thereby inducing architectural changes within the podocyte leading to proteinuria85,86. The upregulation of CD80 is hypothesized to be a result of cytokine release from T cells or toll-like receptor activation by infectious or environmental agents86. Some features of these combined hypotheses are likely to contribute to the immunopathogenesis of MCD. However, there remain a number of unanswered questions.
affinity-39
purified anti-TCR autoantibodies enabled us to determine the targeted T cells, their phenotype and cellular activation induced by autoantibody/autoantigen interactions.
Methods
Patient Cohort/Sample Acquisition
Patients with biopsy-proven or clinically reviewed minimal change glomerulopathy or FSGS, biopsy-proven and chart reviewed patients with ANCA disease, and patients with idiopathic membranous enrolled in this study gave informed, written consent and participated according to UNC Institutional Review Board guidelines. Samples from children with peanut allergies were deidentified. Consent and sample storage procedures have been previously documented91. In addition, deidentified serum specimens were obtained from patients concurrent with renal biopsy from UNC-Nephropathology. The institutional review board of the University of North Carolina at Chapel Hill waived the requirement of consent for use of these samples.
Minimal change glomerulopathy, focal segmental glomerulosclerosis, and membranous nephropathy were diagnosed by means of renal biopsy. A subset of pediatric patients (not included in analyses) with clinician diagnosis of minimal change nephrotic syndrome were included after chart review confirmed this to be the most likely diagnosis. All membranous nephropathy patients underwent chart review to identify only idiopathic etiology.
Epitope mapping of immunoglobulin from MCD/FSGS patients against circulating leukocyte proteins
Protein A/G (Santa Cruz) purified immunoglobulin (Ig) was immobilized on CNBr-activated Sepharose 4B (GE Healthcare) in compact reaction columns (CRC, USB Corporation) and incubated with human peripheral leukocyte cell lysate or thymic cell lysate. PBMCs were isolated from healthy donor blood using Vacutainer CPT tubes with sodium heparin (BD). Thymocytes from a healthy thymus were isolated by tissue mincing and straining through 70 µm nylon mesh (BD Falcon). Cell membranes and cytoplasm were then fractionated using a
40
sequentially digested with sequencing grade TPCK-treated trypsin (Worthington) for 2h at 37C. TCR-peptides which remain bound to Ig after digestion were eluted with 0.1% Trifluoro acetic acid (ThermoScientific) and sequences were determined by mass spectrometry. Samples were analyzed using a 4800 Plus Matrix-Assisted Laser Desorption Ionization Time of Flight Mass Spectrometer (MADLI TOF/TOF MS/MS) in conjunction with ProteinPilot software (AB SCIEX). Samples were spotted on a stainless-steel target with α-cyano-4-32hydroxycinnamic acid matrix (Sigma). The instrument used has a YAG laser with λ=355nm and the potential
difference between the source acceleration voltage and the collision cell was set at 2kV. Calibration was done internally with self-digested TPCK-treated trypsin (same as above). Peak absorbance in MS spectra are not indicative of the abundance of peptide species because of the differences in individual peptides’ ability to ionize. All analysis was done with ProteinPilot using
an NCBI Mascot search. This protocol is a variation of epitope excision using MS from Roth et al, JCI 2013, in press.
ELISA
Immunoglobulin was isolated from patient plasma or serum using Protein A/G beads (Santa Cruz). ELISA plates (Corning, #3590) were coated with 2-3 ug of peptide diluted in carbonate/bicarbonate buffer (Sigma) and incubated overnight at 4 degrees. Plates were blocked with Superblock-PBS (Thermo Scientific). Patient immunoglobulin (1 ug/well) was added and incubated for 3 hours at 37 degrees. Secondary anti-human antibody with horseradish peroxidase was incubated for 45 min at 37 degrees. Substrate was 1-step PNPP (Thermo Scientific) and absorbance was read at 405 nm at 10 minute intervals.
Immunoprecipitations
41
After blocking with Superblock (Thermo Scientific), immunoblotting antibodies (affinity-purified anti-TCR from patients) were incubated overnight at 4C. Appropriate secondary antibodies conjugated to alkaline phosphatase were incubated for 1 hour at room temperature before development with Western Blue stain (Promega).
Purification/Labeling of anti-TCR autoantibodies
TCR peptides identified by mass spectrometry were synthesized and bound to a HiTrap NHS-activated column (GE). Sera from MCD patients were then subjected to FPLC with the TCR peptide column. Affinity-purified anti-TCR autoantibodies were then dialyzed over night prior to fluorescent labeling. All affinity-purified anti-TCR autoantibody samples were
concentrated to 1 mg/mL using Amicon Ultra-0.5 mL Centrifugal Filters (Millipore). Samples were then fluorescently labeled with either Alexa Fluor 488 or Alexa Fluor 647 with Alexa Fluor Antibody Labeling Kits (Life Technologies) per manufacturer’s protocol.
Cell isolation and flow cytometry
Peripheral blood mononuclear cells (PBMCs) were washed and resuspended in HBSS, 2% FBS, 0.1% sodium azide, Fc blocked, and stained with the following anti-human
fluorescently labeled antibodies: CD2, CD3, CD4, CD8, CD45, TCRαβ, TCRγδ, CD95, CD69, CD154 (all from BioLegend), Myh9 (abcam), and fluorescently labeled anti-TCR autoantibodies from MCD patients. with minimal change disease were affinity purified for peptides found by mass spectrometry. Annexin V and propidium iodide staining was performed according to the FITC Annexin V Apoptosis Detection Kid with PI (BioLegend) manufacturer’s instructions. To
determine kinetic annexin positivity, the Kinetic Apoptosis Kit (abcam) was followed per manufacturer’s instructions. For intracellular cytokine detection, PBMCs were stimulated with
42
following anti-human fluorescently labeled antibodies: IL-8 and IL-13 (BioLegend). Cells were acquired on a BD LSRII and data was analyzed by FlowJo software (Tree Star, Inc.).
Images of individual cells during flow cytometry were acquired on an Amnis ImageStream and data analysis was performed using the Amnis Image Data Exploration and Analysis Software (IDEAS™).
Results
Identification of a target protein in peripheral blood leukocyte lysate
Previous studies from our group have utilized mass spectrometry approaches to successfully pinpoint autoantibody targets in ANCA disease. ANCA disease is an “indirect”
autoimmune disease as the autoantibodies to not target the organ with pathological
manifestations, in this case, the kidneys. Rather, in ANCA disease autoantibodies target an intermediate circulating cell, neutrophils, which spur the kidney pathology. We questioned if a similar phenomenon occurred in MCD. Epitope excision utilizing MALDI-TOF/TOF mass spectrometry was performed using IgG from MCD patients and total leukocyte cell lysate from a healthy control or total protein lysate from normal human thymocytes. Initial MS spectra
identified a TCR beta peptide of interest at an observed mass of 1904.7864. The target epitope was identified as the sequence TVTSAQKNPTAFYFCAR at a mass peak at 1904.7864 and protein matched to the human T cell receptor (TCR) beta chain.
Follow up MS experiments also used normal human thymus cell lysate as the source of protein. These experiments also detected TCR peptides bound to IgG from MCD patients; however these peptides matched to the delta chain of the TCR with an amino acid sequence of LEDSAKYFCALGNPLR. Additional MS experiments were performed with several IgG samples from different individual MCD patients. The peptide sequences discovered by all of these
experiments are listed in Table 2.1.
43
sequence which appeared in all MS experiments. This YXCA motif is underlined in Table 2.1. Further investigation into amino acid sequences of TCR beta chains revealed that the majority of TCR variable regions have two highly conserved cysteine residues92. These two cysteines should form a disulfide bridge, contributing to the tertiary structure of the TCR. Additionally, as no reducing agents are utilized in the mass spectrometry experiments, it would be expected that both cysteines would be detected by mass spectrometry. However, in all experiments, only one
cysteine is detected. This prompts our hypothesis that this disulfide bridge is perturbed in patients with MCD, thereby allowing exposure of an otherwise cryptic epitope and downstream formation of anti-TCR autoantibodies. This “conformeropathy” has been noted in other autoimmune
diseases, notably Goodpasture’s or anti-glomerular basement membrane (GBM) disease wherein
44 Table 2.1
Table 2.1. Peptide sequences identified by mass spectrometry/epitope excision. IgG samples from MCD patients incubated with various cell protein lysates were subjected to epitope exicision mass spectrometry experiments to determine the peptide targets of autoantibodies in MCD patients. Table depicts amino acid sequences of identified targeted peptides, protein match and initial source of input protein. Highlighted regions are conserved amino acid motifs found in all mass spectrometry experiments.
Amino acid sequence Protein match Source of protein for MS experiment
TVTSAQKNPTAFYFCAR TCRβ Peripheral leukocyte
TAFYLCASS TCRβ Peripheral leukocyte
VYFCASSEGTYKYIFGTGTRLK TCRα Mouse thymoma
LEDSAKYFCALGNPLR TCRδ Normal human thymus
KYFCALGNPLRLGG TCRδ Normal human thymus
LLSDSGFYLCAWR TCRβ Peripheral lymphocyte
YLCASVVGIPPR TCRβ Peripheral lymphocyte
45
Anti-TCR autoantibodies are present in patients with minimal change disease
Peptide ELISAs were performed using the portion of the T cell receptor (TCR) beta and delta found by mass spectrometry (peptides 1 and 4 listed in Table 2.1). IgG samples from patients with MCD, FSGS, idiopathic membranous, anti-neutrophil cytoplasmic autoantibody (ANCA) disease and healthy individuals were tested for reactivity to the TCR peptide (Figure 2.1A). Samples from MCD and FSGS patients were inclusive of all subsets and were acquired at onset of disease in addition to disease remission and relapse of disease. To address the relatively young ages of the MCD patients, we acquired 25 IgG samples from children with peanut
allergies. In our MCD cohort, the frequency of positivity for anti-TCR autoantibodies was 36.8%, with the caveat that our cohort was not prospectively collected and includes all patients from a wide range of ages and clinical disease courses. The combined healthy cohort with pediatric peanut allergies had a positivity rate of 3.77%.
To better address the frequency of anti-TCR autoantibodies in the MCD population, we acquired serum and plasma samples from Nationwide Children’s Hospital in conjunction with the Midwest Pediatric Nephrology Consortium. Fifty-seven samples acquired at or around onset of disease and fifty-six paired samples at one month after diagnosis were used in a replication study of our peptide ELISA. Samples from the onset of disease had a high reactivity to TCR peptides with a 96.5% positivity rate (Figure 2.1B). At one month post initiation of treatment, most patients had decreased reactivity to TCR peptides but were still positive compared to healthy controls (Figure 2.1B). Therefore, the presence of anti-TCR autoantibodies may be enriched during disease onset or relapse. Figure 2.1A depicts all MCD patients tested on our ELISA (all UNC patients and onset MCD patients from the MWPNC); the positivity rate of this inclusive cohort was 67.8%.
46
47 Figure 2.1
Figure 2.1 Patient IgG reactivity to TCR peptide. (A) IgG isolated from healthy controls, MCD, FSGS, idiopathic membranous and ANCA disease patients were used to determine reactivity to the TCR peptide. Dashed red lines represent one and two standard deviations above the mean of the healthy controls. (B) Paired onset and clinical remission anti-TCR ELISA data from patients in the Midwest Pediatric Nephrology group.
HCO + P
eanu t Alle
48
Additionally, anti-TCR autoantibodies were affinity-purified by FPLC with a column to which peptides discovered by mass spectrometry were attached. Relative abundance of anti-TCR autoantibodies was inferred from FPLC peaks when serum from either MCD patients, FSGS patients or healthy controls was used during affinity-purification. Representative FPLC peaks demonstrate that the selected MCD and FSGS patients have anti-TCR autoantibodies (Figure 2.2 top two panels) while the healthy control only exhibited a small amount of anti-TCR
49 Figure 2.2
Figure 2.2 Antibody elution peaks from affinity-purification of anti-TCR autoantibodies by FPLC. Serum from MCD patient, FSGS patient or healthy control was subjected to an FPLC column with the TCR peptide. Peaks represent eluted affinity-purified antibodies.