Systems/Circuits
Cocaine Self-Administration Experience Induces
Pathological Phasic Accumbens Dopamine Signals and
Abnormal Incentive Behaviors in Drug-Abstinent Rats
X
Michael P. Saddoris,
1,2X
Xuefei Wang,
2X
Jonathan A. Sugam,
2and Regina M. Carelli
21Department of Psychology and Neuroscience, University of Colorado, Boulder, Colorado 80309, and2Department of Psychology and Neuroscience,
University of North Carolina at Chapel Hill, Chapel Hill, North Carolina 27599
Chronic exposure to drugs of abuse is linked to long-lasting alterations in the function of limbic system structures, including the nucleus accumbens (NAc). Although cocaine acts via dopaminergic mechanisms within the NAc, less is known about whether phasic dopamine (DA) signaling in the NAc is altered in animals with cocaine self-administration experience or if these animals learn and interact normally with stimuli in their environment. Here, separate groups of rats self-administered either intravenous cocaine or water to a receptacle (controls), followed by 30 d of enforced abstinence. Next, all rats learned an appetitive Pavlovian discrimination and voltammetric recordings of real-time DA release were taken in either the NAc core or shell of cocaine and control subjects. Cocaine experience differentially impaired DA signaling in the core and shell relative to controls. Although phasic DA signals in the shell were essentially abolished for all stimuli, in the core, DA did not distinguish between cues and was abnormally biased toward reward delivery. Further, cocaine rats were unable to learn higher-order associations and even altered simple conditioned approach behaviors, displaying en-hanced preoccupation with cue-associated stimuli (sign-tracking; ST) but diminished time at the food cup awaiting reward delivery (goal-tracking). Critically, whereas control DA signaling correlated with ST behaviors, cocaine experience abolished this relationship. These findings show that cocaine has persistent, differential, and pathological effects on both DA signaling and DA-dependent behaviors and suggest that psychostimulant experience may remodel the very circuits that bias organisms toward repeated relapse.
Key words: Incentive salience; prediction error; sign tracking; ventral striatum; voltammetry
Introduction
The transition from drug use to addiction has profound negative consequences. Therefore, addicted persons typically make sincere
efforts to abstain from drug use only to undergo persistent cycles of relapse triggered by reexperiencing drug-associated stimuli. These stimuli can elicit powerful feelings of craving and negative affective states, inducing the addicted person to seek out drugs to alleviate the negative emotional state and motivational withdrawal (Ehrman et al., 1992;Ahmed and Koob, 1998;Robbins et al., 2000;Pickens et al., 2011;Koob, 2015). In addition, addicted persons are also more likely to exhibit changes in behavior in nondrug situations such as in-creased risk taking, impulsivity, and decreases in motivation toward
Received Sept. 16, 2015; revised Nov. 5, 2015; accepted Nov. 24, 2015.
Author contributions: M.P.S. designed research; M.P.S., X.W., and J.A.S. performed research; M.P.S. analyzed data; M.P.S., X.W., J.A.S., and R.M.C. wrote the paper.
This work was supported by the National Institute on drug Abuse (Grant DA035322 to M.P.S. and Grant DA034021 to R.M.C.). We thank Douglas Terry, Jason Reid, and Aimee Rogers for outstanding work in assisting with video scoring and Robert Edmiston for assistance with behavior.
The authors declare no competing financial interests.
Correspondence should be addressed to Dr. Michael P. Saddoris, Department of Psychology and Neuroscience, University of Colorado Boulder, UCB 345, Boulder, CO 80309-0345. E-mail:[email protected].
DOI:10.1523/JNEUROSCI.3468-15.2016
Copyright © 2016 the authors 0270-6474/16/360235-16$15.00/0
Significance Statement
effortful activities (Goldstein et al., 2007;Vadhan et al., 2009;Moeller et al., 2012a,b;Canavan et al., 2014) even after periods of abstinence from the drug. These findings suggest that chronic drug use induces long-term plastic changes in neural circuits that normally process stimuli and prospective valuation (Wheeler et al., 2011;Wolf and Tseng, 2012;Twining et al., 2015).
Dopamine (DA) afferents from the ventral tegmental area (VTA) are implicated in supporting these functions. Although drugs of abuse either directly or indirectly act to increase DA release within the nucleus accumbens (NAc) (Di Chiara and Imperato, 1988), pha-sic DA release in the NAc of drug-naive animals has been shown to encode aspects of learning and motivated behavior, such as predic-tion errors (Schultz et al., 1997;Saddoris et al., 2015a), incentive salience (Flagel et al., 2011;Saddoris et al., 2015a), and the value of anticipated outcomes (Sugam et al., 2012;Saddoris et al., 2015b). Neuroimaging evidence has shown that chronic cocaine use is asso-ciated with multiple changes in both DA circuit and receptor func-tion (Volkow et al., 1993;Volkow et al., 1996;Asensio et al., 2010; Konova et al., 2012). However, in human populations, it can be difficult to assess whether cocaine experience induces behavioral changes or if predispositions toward risk taking and impulsivity (e.g., via genetic or epigenetic factors) creates a greater propensity for de-veloping addiction than the rest of the population (Boettiger et al., 2007;Kelm and Boettiger, 2013).
Animal studies have shown that repeated cocaine experience in-duces persistent changes in mesolimbic circuit processing. Cocaine-experienced animals show marked difficulties in flexibly altering behavior by perseverating on actions that are no longer rewarded (Jentsch et al., 2002;Schoenbaum et al., 2004;Calu et al., 2007; Stal-naker et al., 2007a) and inappropriately approaching stimuli predic-tive of foods that have become aversive (Schoenbaum and Setlow, 2005;LeBlanc et al., 2013). Furthermore, cocaine experience appears to abolish the ability of cues to support appropriate value-based behaviors, driving subjects toward more impulsive choices (Simon et al., 2007;Setlow et al., 2009) and impairing the use of learned stimuli to support new learning and behavior (Saddoris et al., 2011; LeBlanc et al., 2013;Saddoris and Carelli, 2014).
Although these behavioral deficits are related to DA-dependent tasks, less is known about whether cocaine experience itself causes persistent changes in DA signaling within the NAc. One recent study using fast-scan cyclic voltammetry (FSCV) demonstrated that the amount of striatal DA release to cocaine-related cues during self-administration sessions strongly decreased over repeated sessions (Willuhn et al., 2014). However, because this task was done while the drug was on-board and with drug-related stimuli, it is diffi-cult to disentangle the acute effects of the drug from any long-lasting neuroplastic changes to the mesolimbic DA system, which may be maintained well after drug abstinence. Further, because DA signals differentially encode information between core and shell in normal animals (Cacciapaglia et al., 2012;Saddoris et al., 2013;Chuhma et al., 2014;Saddoris et al., 2015a), it is unclear whether cocaine experience would differentially affect DA signal-ing patterns in these NAc subregions. Here, ussignal-ing FSCV, we re-corded real-time DA release in the NAc core and shell in both controls and cocaine-experienced subjects (after 30 d of self-administration abstinence) after they learned Pavlovian discrim-inations.
Materials and Methods
Animals
Male Sprague Dawley rats (n⫽35) initially weighing⬃300 g were used as subjects. Animals were individually housed with a 12 h/12 h light/dark cycle. During water-restricted portions of the experiment, all rats
re-ceived 20 ml/d water in the home cage plus additional fluids collected during the task. On food-restricted training and test days, rats were maintained at no less than 90% of free feed body weight via food restric-tion that included 10 –15 g of Purina laboratory chow in the home cage each day in addition to⬃2.7 g of sucrose consumed during daily sessions. Food or water restriction was in place for the duration of behavioral testing days except during the postsurgery recovery period, when food and fluids were givenad libitum. All procedures were performed in ac-cordance with the University of North Carolina at Chapel Hill Institu-tional Animal Care and Use Committee.
Behavioral methods
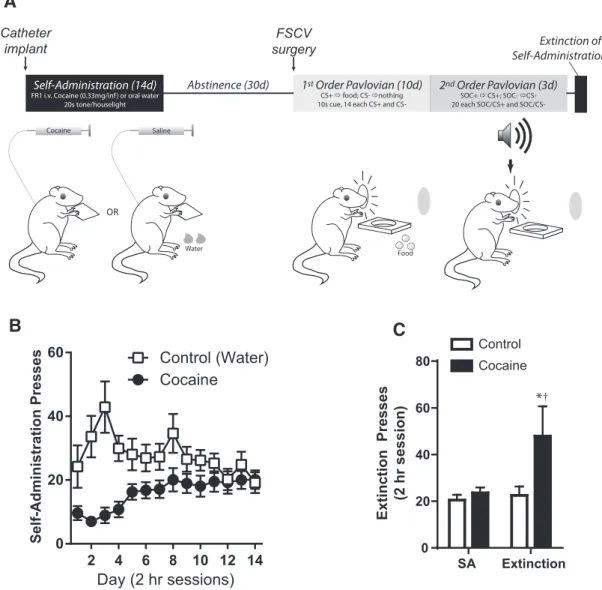
Rats were trained in a series of tasks starting with self-administration, followed by a period of enforced abstinence (30 d), and then training on a Pavlovian first-order conditioning (FOC) task. Finally, to assess the animals’ motivation for drug taking, a final extinction session in the self-administration chamber was administered. A schematic of the task phases and timing of surgical procedures appears inFigure 1Aand de-tailed descriptions of all experimental procedures are described below.
Cocaine self-administration
Rats were first aseptically surgically prepared for an indwelling intrajugu-lar catheter as described in detail previously (Saddoris et al., 2011). After 1 week of recovery, rats were lightly water deprived and then trained on a standard self-administration regimen as described previously (Saddoris
et al., 2011;Saddoris and Carelli, 2014). Briefly, in a standard
self-administration chamber (context A: 25⫻25⫻30 cm, stainless steel rod floor; MED Associates), cocaine rats (n⫽15) were connected via flexible tubing to a syringe containing cocaine (1.67 mg/ml in 0.9% saline) to the intrajugular catheter. A swivel connecting tubing and the syringe allowed free movement in the test chamber. At the onset of each 2 h session, a lever was extended into the chamber and a cue light was illuminated over the lever. Presses on the lever delivered an intravenous infusion for 6 s (0.33 mg of cocaine in 200l of saline) commensurate with lever retrac-tion, cue light extinguishing, house light illuminaretrac-tion, and an intermit-tent 1 Hz “beeping” tone (1200 Hz) for 20 s. After 20 s, all conditioned reinforcing stimuli were extinguished and the lever and cue light were once again presented in the chamber. For control rats (n⫽20), presses on the illuminated lever delivered a bolus of water (250l) to a recessed food cup to maintain similar instrumental performance as cocaine sub-jects. As with cocaine self-administration, presses were accompanied by the conditioned reinforcing stimuli (tone/houselight) and lever retrac-tion for 20 s. Controls were also connected to an intravenous catheter connected to a pump, but received yoked 0.9% saline infusions based on the schedule of an adjacent cocaine-administering rat. Sessions were 2 h and rats performed this task daily for 14 d. At the completion of self-administration, rats were placed on unrestricted food and water access and remained in their home cages until a second surgery to implant FSCV cannulae (3 weeks). Rats were allowed an additional week of re-covery after cannula implants, so the Pavlovian discrimination testing began 4 weeks after the end of the self-administration sessions.
FSCV
chemo-metric analysis was used to identify DA concentrations using HDCV software (UNC Chemistry Electronics) and aligned to behavioral events (Trans IV; MED Associates).
Pavlovian discriminations
After self-administration, all rats were trained in a standard Pavlovian FOC task in a test chamber easily discriminable from the drug self-administration chamber (context B: 43⫻43⫻53 cm, smooth Plexiglas floors; MED Associates) as described previously (Saddoris and Carelli, 2014). During all Pavlovian conditioning sessions, rats were lightly food deprived (90 –95% of free feed weight). Briefly, on each trial, rats were presented with one of two discriminable visual stimuli (solid cue light on one side of the chamber wall, flashing cue light on the opposite side) for 10 s. One cue (conditioned stimulus positive; CS⫹) was partially rein-forced such that it predicted delivery of food (3 sucrose pellets, 45 mg; Purina TestDiet) on 12 of the 14 trials, whereas the other two CS⫹trials had food omitted. The other cue (CS⫺) was never reinforced (14 pre-sentations). Rats learned this discrimination over 10 d. Sessions were 83 min long and the average intertrial interval was 180⫾90 s.
A subset of rats (n⫽ 20 control, 10 cocaine) performed further second-order conditioning (SOC) in the same chamber. In SOC, in the session after the last day of first-order training, rats received a training
day (SOCd0) when they were exposed to 10 10 s nonreinforced tations of 2 distinct auditory cues (white noise or 600 Hz tone; 5 presen-tations each) to extinguish any noncontingent behavioral changes in the presence of the sounds. On 3 subsequent test days (SOCd1–3), rats re-ceived 18 pairings of a 10 s audio cue (e.g., white noise; SOC⫹) imme-diately followed by the 10 s CS⫹and 17 pairings of the other 10 s audio cue (e.g., tone; SOC⫺) followed by the 10 s CS⫺. Neither pairing was followed by food reinforcement. However, 24 “reminder trials” (12 CS⫹, 12 CS⫺) were delivered during the session: 12 at session onset (6 CS⫹, 6 CS⫺), 6 during the session (3 CS⫹, 3 CS⫺), and 6 at the end of the session (3 CS⫹, 3CS⫺). Both reminder cues were reinforced as during first-order sessions.
Drug extinction
At the conclusion of all Pavlovian conditioning sessions, a subset of rats was returned to free feed and lightly water deprived (20 ml/d). On a single day of testing, rats were connected to catheter tubing in context A and placed in the original self-administration chamber. However, this cath-eter tubing was not connected to any solutions (cocaine or vehicle), nor was water connected to the food cup. Rats were run on the same experi-mental procedures as during self-administration (2 h) in which presses
2 4 6 8 10 12 14
0 20 40 60
Day (2 hr sessions) Control (Water) Cocaine
Self-Administration Presses
SA Extinction
0 20 40 60 80
Extinction Presses
(2 hr session)
Control
Cocaine
*†
A
B
Cocaine Saline
Water Self-Administration (14d) FR1 i.v. Cocaine (0.33mg/inf ) or oral water
20s tone/houselight
Abstinence (30d) 1st Order Pavlovian (10d)
CS+ food; CS- nothing 10s cue, 14 each CS+ and
CS-2nd Order Pavlovian (3d)
SOC+ CS+; SOC- CS-20 each SOC/CS+ and
SOC/CS-Extinction of Self-Administration (1d)
OR
Food
C
Catheter
implant surgeryFSCV
on the lever produced an audiovisual stimulus for 20 s along with lever retraction, but no drug or water reinforcement was delivered.
Data analysis
For self-administration, we averaged the number of reinforced presses by the group on each day. To calculate extinction, we compared the average number of presses during the last 5 d of self-administration to the num-ber of presses in extinction. Likewise, drug loading was considered to be the number of presses during the first 5 min of a self-administration session. To ensure that this number was stable, we used the average number of loading presses over the last 5 d of self-administration.
For Pavlovian conditioning, we examined associative behaviors (cue approaches, food cup approaches) during the 10 s baseline period imme-diately preceding each cue onset and compared that with the same be-haviors during cue presentation (10 s) and after reward delivery (10 s).
To quantify associative behaviors in FOC, we first used automated head entry detectors mounted immediately above the food cup. Inter-ruption of the beam when the rat was directly engaged in the food cup itself generated timestamps to count the number of approaches in the session, as we have done in previous studies (Saddoris and Carelli, 2014). For each subject, the average number of head entries was taken in each 10 s bin (i.e., baseline, cue, reward) during the different cue types (i.e., CS⫹, CS⫺). Mixed-model ANOVA analyses were performed using drug (control vs cocaine) as a between-subjects factor while behavioral mea-sures were examined within subjects as they progressed through each time bin (baseline, cue, reward), between different cues (CS⫹trials ver-sus CS⫺trials) and across days (day 1–10). Note that, for CS⫹trials, only 12 of the 14 trials were reinforced with food. Therefore, for analyses looking specifically at cues, all CS⫹trials (n⫽14) were used regardless of reinforcement (because the subject had no way of knowing whether the trial would be reinforced). However, for reward analysis or any analysis directly comparing reward and cues, only the trials in which reinforcers were delivered (n⫽12) were used. Likewise, head entry behavior was separately examined by mixed-model ANOVA for SOC days using 10 s bin (baseline, SOC, and FOC), cue types (SOC⫹, SOC⫺), and day (SOCD1–3) to assess conditioning.
Next, behavior was quantified to understand the differences in appet-itive approach during associative stimuli. Video-recorded sessions of behavior on days 1, 5, and 10 of FOC were scored by raters who were blind to the subject’s drug history. Zones (1.5”⫻1.5”) were created around the cue lights and food cup and raters manually scored when the rat’s head entered and exited the zones using keystrokes in Plexon’s SortClient software. Behavior was scored during the 10 s baseline and 10 s cue period for all CS⫹and CS⫺trials. Because it has been shown that the dominant form of conditioned approach behavior can change between the beginning and end of cue presentations, we separately examined behavior in the first 5 s of the cue (early phase) and the second 5 s of the cue (late phase). In a separate analysis, we also examined approach be-haviors to the reward by comparing the same pre-cue baseline to the first 5 s after reward delivery. Sign tracking (approach cue; ST) and goal tracking (approach food cup; GT) behavior was generated by assessing multiple factors including: percentage of time within each zone (CS⫹, CS⫺, food cup), probability of approach to each of the stimuli, number of discrete entries into the zones, and latency to approach. For the latency measure (“first contact”), whichever stimulus zone was approached first by the animal in each trial (e.g., CS⫹light) was scored as a “1” and the other stimuli on that trial (e.g., food cup, CS⫺light) as “0”. The first contact index was generated by subtracting the average first contract score for the food cup from the first contact score from the cue. There-fore, the range of scores were between⫹1 (all trials in which the rat approached the CS first) and⫺1 (all trials in which the rat approached the food cup first).
To classify subjects as ST or GT, we computed a Pavlovian conditioned approach (PCA) index, modified from the commonly used metric by Robinson and colleagues (Meyer et al., 2012b). The subject’s PCA index was the average of four factors: percentage of time score, number of entries score, probability of approach score, and latency (i.e., first con-tact) score. Each score was calculated based on (ST⫺GT)/(ST⫹GT) in the respective categories. Therefore, each score could range from⫹1
(complete ST) to⫺1 (complete GT). For the purposes of this experi-ment, animals with a positive PCA were considered ST and those with a negative PCA were considered GT.
To ensure reliable ratings, we compiled ratings from 2 observers for a subset of the sessions (n⫽5 sessions). Using this, we computed interrater reliability using the intraclass coefficient model (Shrout and Fleiss, 1979) and found that our raters were significantly and reliably correlated (F⫽
8.91,p⬍0.00001). For sessions with multiple raters, we used the average of both scorers in each bin when computing GT and ST scores. For behavioral measures of learning across days, we used only subjects that had usable videos from all 3 d (day 1, 5, and 10) so that we could use within-subjects measures (control:n⫽13; cocaine:n⫽9). However, for interactions between conditioned approach behaviors and DA signaling, we used all subjects that had both scored data and FSCV recordings on the recording day.
Analysis of FSCV recordings was similar to previous reports (Sugam et
al., 2014;Saddoris et al., 2015a). Briefly, each subject received electrical
stimulation of VTA afferents (frequency: 12– 60 Hz, pulses: 1–20) to generate a training set of DA release at the recording location in the NAc. To analyze recorded FSCV data, each subject’s training set collected from the recording site was used to convert recorded current during the ses-sion chemometrically into DA concentrations (Rodeberg et al., 2015). Concentrations were then aligned to behavioral events to assess DA re-lease dynamics relative to task stimuli. For analysis, we used several fac-tors to assess the relationship between DA and behavior. First, peak DA was the greatest concentration of DA within 1 s after an event (e.g., CS⫹, CS⫺). Second, area under the curve (AUC) was assessed by summating the concentration of DA at each 100 ms bin for the analysis period minus the AUC for the preceding baseline. For these analyses, subject averages (i.e., the average of each subject’s mean DA release for that stimulus) were the data. However, when assessing the effects of ST and GT on behavior, we found that we had few subjects in some groups, so we opted to use a population analysis by using each trial as a datum point rather than the subject average. In all statistical analyses, a mixed-model ANOVA was used to examine DA levels by using the factors of drug (control, cocaine), cue (CS⫹, CS⫺), or reward (reward, post-CS⫺ pe-riod), whereas for ST/GT analysis of DA, an additional factor of approach (ST, GT) was used.
Finally, correlations of peak DA were done using other factors such as percentage ST/GT and aspects of self-administration (cocaine intake, drug loading) and included both core and shell recordings. Note that, for these analyses, as with behavior, cue analyses for the CS⫹trials were performed using subject averages.
All statistical analyses were performed using Statistica version 12 (Stat-Soft) and GraphPad Prism software.
Results
Self-administration and Pavlovian discrimination behavior
Results of self-administration and subsequent extinction appear inFigure 1,BandC. During self-administration, thirsty rats read-ily learned to lever press for either intravenous cocaine (cocaine) or water delivered to a receptacle (control). Rats in the control group more rapidly acquired pressing than rats in the cocaine group (Fig. 1B; ANOVA: group⫻ day,F(13,273) ⫽ 6.03, p⬍
0.0001). This increase was apparent as significantly increased re-sponding on days 2 and 3 (Tukey: bothp⬍0.005), but, by day 5, there were no differences between press rates within a session (Tukey: cocaine vs control days 5–14, allp⬎0.50). Therefore, when the self-administration task was well learned and stable, rats in both groups pressed at similar rates and thus experienced instru-mental actions, conditioned stimuli, and reinforcers equivalently.
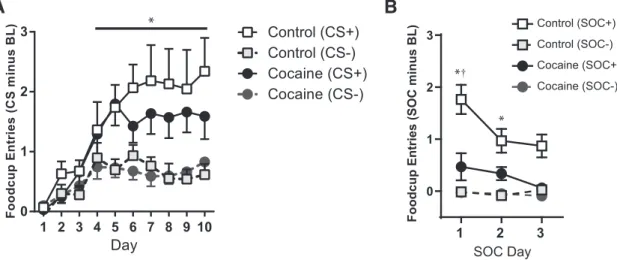
entries increased across days (ANOVA: day,F(9,279)⫽12.86,p⬍
0.0001) and showed increasing abilities to discriminate between the stimuli (ANOVA: cue,F(1,31)⫽93.68,p⬍0.0001; day⫻cue,
F(9,279)⫽5.51,p⬍0.0001), with a significantly greater number of
entries during the CS⫹compared with the CS⫺on days 5–10 (Tukey; allp⬍0.001). However, there was no effect of drug or interactions between drug and other factors (ANOVA; main ef-fect and all interactions,p⬎0.50).
Rats were then trained on a second-order schedule where one auditory stimulus (SOC⫹) was followed by the CS⫹and another (SOC⫺) was followed by the CS⫺; neither pair of stimuli were reinforced with food. Consistent with our previous findings (Saddoris and Carelli, 2014), only rats in the control group were able to acquire this discrimination (Fig. 2B), as indicated by a main effect of drug (i.e., cocaine vs control),F(1,28)⫽11.61,p⬍
0.005, an interaction of drug⫻cue (i.e., SOC⫹vs SOC⫺),F(1,28) ⫽7.09,p⫽0.01, and a nearly significant trend for the interaction of drug⫻cue⫻day (i.e., 3 sessions),F(2,56)⫽2.68,p⫽0.07.
Specifically, rats in the control group showed increased food cup entries during the SOC⫹compared with the SOC⫺on days 1 and 2 of SOC (Tukey: day1,p⫽0.006; day2,p⫽0.001), whereas rats in the cocaine group failed to show differences between stim-uli on either of these days (Tukey: day1,p⫽0.99; day2,p⫽1.0). Furthermore, controls responded at a greater rate than cocaine-SA rats for the SOC⫹cue overall (Tukey:p⫽0.0007), but did not differ on rates of responding for the SOC⫺(Tukey: p⫽0.34).
After self-administration, rats were run in Pavlovian dis-criminations (see below) before being returned to the self-administration chamber for extinction. One week after Pavlovian discriminations (i.e., 60 d of enforced abstinence from the end of self-administration), rats were returned to the original self-administration context, where they were given one self-administration session under extinction conditions (i.e., presses delivered tone/houselight stimuli, but did not result in delivery of either intravenous cocaine or water to the water receptacle;Figure 1C). An ANOVA indicated that rats var-ied their extinction press rate based on their drug history [main effect drug,F(1,18)⫽5.67,p⫽0.03; drug⫻extinction (i.e.,
aver-age SA days 10 –14 vs extinction day),F(1,18)⫽4.61,p⫽0.04].
Although rats in both groups showed similar press rates over the last 5 d of self-administration (Tukey:p⫽0.95), cocaine rats
pressed more during extinction than during self-administration (Tukey:p⫽0.04) and relative to controls (Tukey:p⫽0.01). In contrast, controls showed similar rates of pressing during self-administration and extinction (Tukey:p⫽0.99).
ST and GT behaviors during conditioning
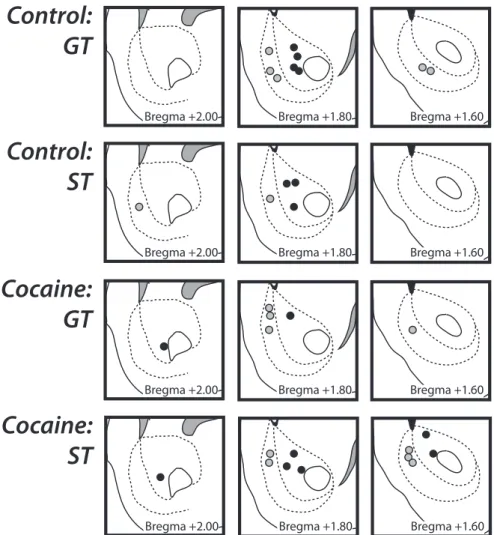
Next, in the subset of subjects for which we recorded FSCV in the NAc (n⫽14 control,n⫽17 cocaine; seeFig. 3for histology), we investigated whether cocaine experience induced changes in the type of the associative approach during task performance by as-sessing the amount of behavior subjects spent in ST (approaches to the cue light zone) versus GT (approaches to the food cup zone) during trials across training. These PCA behaviors were examined within subjects across days 1, 5, and 10. However, due to technical issues (i.e., missing or damaged video recordings), some subjects did not contribute data from all 3 sessions and were therefore excluded (n ⫽ 1 control,n ⫽8 cocaine) from this within-subjects analysis. As a result, conditioned approach data were analyzed from 13 control and 9 cocaine subjects.
We first analyzed the percentage of time rats spent performing ST approach behaviors during the cue as learning progressed (Fig. 4A). In general, we found that cocaine subjects showed an overall enhanced ST response relative to controls. Specifically, a multifactor ANOVA using drug (control, cocaine), day (days 1, 5, and 10), phase (BL, early cue, late cue), and cue (CS⫹, CS⫺) indicated both a main effect of drug,F(1,20)⫽5.19,p⫽0.03, and
an interaction of drug with all other factors, drug ⫻ day ⫻ phase⫻cue,F(4,80)⫽4.51,p⫽0.002. This interaction indicated
that all rats displayed similar amounts of ST to the cue on day 1 (Tukey: cocaine vs control, CS⫹,p⫽1.0; CS⫺,p⫽1.0) and that none of these ST levels during either the early or late phase of cue presentation was different from BL (Tukey: allp⫽1.0). Therefore, the different visual cues had no intrinsic motivational value that may have been generalized from previous self-administration cues for either group.
However, on day 5, cocaine animals showed a significant in-crease in ST to the CS⫹during the early and late phases of cue presentation (Tukey: day 1 vs day 5, early cue:p⫽0.0002; late cue:p⫽0.0002), but no increase in ST for the CS⫺cue (Tukey: bothp⬎0.31), resulting in significantly greater ST for the CS⫹ than the CS⫺in the late phase (Tukey:p⫽0.02; early phase,p⫽ 0.17). Indeed, ST for the CS⫹was significantly greater than BL in
1 2 3 4 5 6 7 8 9 10 0
1 2 3
Day
Foo
dc
up
En
tr
ie
s
(C
S
m
inu
s
B
L
)
Control (CS+)
Cocaine (CS+) Cocaine (CS-) Control (CS-)
*
B
A
1 2 3
0 1 2 3
SOC Day
Foodcup Entries (SOC minus BL)
Control (SOC+)
Cocaine (SOC+)
Cocaine (SOC-) Control (SOC-)
*†
*
both the early and late cue phase (Tukey: bothp⫽0.0002), whereas ST for the CS⫺ was only greater than BL in the late phase (Tukey: p ⫽ 0.0007; early phase, p ⫽ 0.45). In contrast, controls showed the opposite pattern of ST. There was no change in the amount of ST to the CS⫹ cue during either the early or late cue phases (Tukey: bothp⬎0.18), but there was instead a significant increase in ST to the CS⫺ cue during the late cue phase (Tukey:p⫽0.02; early phase,p⫽0.75), resulting in significantly greater ST to the CS⫺than the CS⫹cue during the late cue phase on day 5 (Tukey: p⫽0.04; early phase,p⫽1.0). Here, ST for the CS⫹was not different from BL during either phase (Tukey: bothp⬎0.09), whereas ST for the CS⫺ was greater than BL in both phases (Tukey: bothp⬍0.05). Finally, on this intermediate conditioning session, cocaine rats showed significantly elevated ST to the CS⫹relative to controls during the late cue phase (Tukey:p⫽0.001; early phase,p⫽0.67), whereas there were no differences in ST for the CS⫺cue during any phase (Tukey: allp⫽1.0).
On the final day of conditioning, day 10, we saw much the same pattern of ST behavior. In cocaine animals, ST respond-ing was significantly greater than BL in both the early and late cue phases for the CS⫹(Tukey: bothp⫽0.0002), but not the CS⫺(Tukey: bothp⬎0.95), resulting in significantly greater ST for the CS⫹ than the CS⫺in both the early and late phases of cue presentation (Tukey: both
p⫽0.0002). In contrast, controls showed ST to the cues that was at BL levels (Tukey: allp⬎0.19) and did not distinguish between CS⫹and CS⫺cues at any phase (Tukey: allp⬎0.35). Therefore, ST for the CS⫹was significantly greater in cocaine than controls during both the early and late cue phases (Tukey: bothp⬍0.008), whereas there were no differences in ST between groups to the CS⫺(Tukey: early and late,p ⬎0.95). However, for neither group did the amount of ST change statistically between days 5 and 10 (Tukey: allp⬎0.96), suggesting that ST rates, particularly for the CS⫹, were stable relatively early in conditioning.
For GT behaviors (Fig. 4B), we found almost exactly the inverse pattern of conditioned approach as we did for ST. An ANOVA using the same factors as for ST revealed significant interactions between drug⫻day⫻phase,F(4,80)⫽3.38,p⫽0.01, drug⫻cue⫻phase,
F(2,40)⫽5.18,p⫽0.01, and a nearly significant interaction of drug⫻
day⫻cue⫻phase,F(4,80)⫽2.37,p⫽0.059. Here, controls showed
more robust GT than cocaine subjects across days. Although there were no differences in in GT rates between groups for any of the stimuli or phases on day 1 (Tukey: allp⫽1.0), control rats showed a significant increase in GT approach from day 1 to day 5 for both the CS⫹cue and CS⫺cue (Tukey: both early and late phases, allp⫽ 0.0002). From day 5 to day 10, GT during the CS⫹increased during the early phase (Tukey:p⫽0.0002; late phase,p⫽0.71) and de-creased during the CS⫺in both phases (Tukey: bothp⫽0.0002). Therefore, GT during the CS⫹was significantly greater than the
CS⫺on both day 5 and on day 10 (Tukey: both early and late phases, p⫽0.0002).
Cocaine animals showed a significantly diminished rate of GT responding compared with controls. Cocaine rats saw increases in GT behavior between day 1 and day 5 only during the late phase of the cue (Tukey:p⫽0.0002; early phase,p⫽0.99) and not at all between day 5 and day 10 (Tukey:p⬎0.79, both phases). Likewise, cocaine rats only showed increased GT behavior for the CS⫹over the CS⫺on day 10 during the late cue phase (Tukey:p⫽0.0002; early phase,p⫽0.85), but not at any point on day 5 (Tukey:p⬎0.28 both phases). Indeed, GT responding on both day 5 and day 10 was only greater than BL during the late phase (Tukey: bothp⫽0.0002) and not during the early phase (Tukey: day 5,p⫽0.09; day 10,p⫽ 0.99). As a result, GT behavior in controls was significantly greater during the CS⫹than cocaine rats on both day 5 (Tukey: late phase, p⫽0.002; early phase:p⫽0.12) and day 10 (Tukey: late phase:p⫽ 0.013; early phase,p⫽0.83). In contrast, there were no differences in GT behavior for the CS⫺cue during any phase on any day (Tukey: allp⬎0.92).
Despite these wide disparities in percentage of time in GT and ST, the total amount of behavior (sum of time approaching either stimulus) performed by animals in each group during the cue was essentially the same (Fig. 4C). Looking at the summated ST and GT behavior for each subject with a multifactor ANOVA (same factors as for ST and GT analysis above), there was no main effect of drug,F(1,20)⫽0.39,p⫽0.54, or any interaction of drug with Bregma +2.00 Bregma +1.80 Bregma +1.60
Control:
GT
Bregma +2.00 Bregma +1.80 Bregma +1.60
Control:
ST
Bregma +2.00 Bregma +1.80 Bregma +1.60
Cocaine:
GT
Bregma +2.00 Bregma +1.80 Bregma +1.60
Cocaine:
ST
cue or day (all ANOVA interactions,p⬎0.23). Indeed, using the samepost hoccomparisons as above, we found no differences between drug groups for any cue on any day or during any phase of the cue presentation (Tukey: allp⬎0.92). Given this equiva-lency, these data suggest that both groups of animals were equally able to perform the Pavlovian discrimination, but the manner in which they deployed their conditioned approach behavior dif-fered based on drug experience.
We also found that it was not just the amount of time spent with the different stimuli that varied, but the speed with which animals approached the different stimuli. The first contact index (i.e., if first contact [entry into the cue zone] was with the cue light after trial onset, it was scored as a⫹1, whereas if first contact was with the food cup zone, the trial was scored as a⫺1) showed a similar pattern as the percentage of time measure for ST (Fig. 4D). An ANOVA using drug, day, and cue type as factors indi-cated a significant main effect of drug,F(1,20)⫽8.98,p⫽0.007,
and a significant interaction of drug⫻cue⫻day,F(2,40)⫽5.46,
p⫽0.008. This effect was carried by a strong shift in the first-contact response bias in the cocaine group. On day 1, all subjects showed a strong bias toward responding first to the food cup regardless of drug background (Tukey: cocaine vs control, CS⫹, p⫽1.0; CS⫺,p⫽0.99). By day 5, cocaine subjects shifted their responding first to the cue light during the CS⫹(Tukey: day 1 vs day 5,p⫽0.004), but not the CS⫺(Tukey:p⫽1.0), whereas controls showed no change in their first-contact response from day 1 to day 5 for either cue (Tukey: both CS⫹and CS⫺,p⫽
0.99). However, both groups’ first-contact responses were stable between day 5 and day 10 (Tukey: day 5 vs day 10, all cues,p⬎ 0.93). Therefore, the first-contact responding was significantly biased in the cue direction (i.e., more positive) for cocaine ani-mals compared with controls for the CS⫹on day 5 (Tukey:p⫽ 0.04) and day 10 (Tukey:p⫽0.002), whereas CS⫺responding was not different between groups on any day (Tukey: allp⬎0.99) and was more food cup biased (i.e., more negative).
Putting these measures together using a modified version of the PCA index (Meyer et al., 2012b), an ANOVA using drug, day, and cue as factors indicated a similar result as above (Fig. 4E). There was a main effect of drug,F(1,20)⫽7.6,p⫽0.01, and an
interaction of drug⫻day⫻cue,F(2,40)⫽3.78,p⫽0.03. Cocaine
rats show a significantly more ST-biased PCA score compared with controls, but only for the CS⫹cue. On day 1, both groups showed similar PCA scores (biased toward the food cup; Tukey: p⫽1.0 for both CS⫹and CS⫺), whereas cocaine rats showed more ST bias during the CS⫹than controls on day 5 (Tukey:p⫽ 0.02) and day 10 (Tukey:p⫽0.001). Indeed, there was signifi-cantly enhanced PCA bias for the CS⫹versus the CS⫺on day 10 in cocaine animals (Tukey:p⫽0.01), but not in controls (Tukey: p⫽0.99). There were no differences in PCA scores for the CS⫺ stimuli between groups on any day (Tukey: allp⫽1.0).
Given the robust differences in cue performance, it was im-portant to make certain that the rats were equally motivated to obtain the food once delivered (Fig. 4F). Looking at the percent-age of time in the food cup during the first 5 s after reward
1 5 10
-1.0 -0.5 0.0 0.5
Day
PC
A
I
n
dex
* **† 0
10 20 30 40
Day
1 5 10
††
**
@
** †
%Time ST (Cue)
-20 0 20 40 60 80
Day
1 5 10
**
@@
† *
@@
%Time GT (Cue)
Control: CS+ Control: CS-Cocaine: CS+ Cocaine:
CS--1.0 -0.5 0.0 0.5 1.0
Day
First-C
o
n
ta
c
t In
dex *
† **
1 5 10
0 20 40 60 80
Day
%Tim
e Foo
d
c
up
(
R
e
w
ard
)
1 5 10
@@
††
@@
††
@
† 0 20 40 60 80
Day
%Time
TOTAL (GT +
ST
)
@@
†† @@
††
1 5 10
C
B
A
F
E
D
delivery, a factorial ANOVA using drug, day, and reward (food delivery vs equivalent post-CS⫺period) indicated a main effect of day,F(2,40)⫽39.92,p⬍0.00001, reward,F(1,20)⫽193.86,p⬍
0.00001, and day⫻reward,F(2,40)⫽34.65,p⬍0.00001, but no
main effect of drug or any interaction of drug with any other factors (allp⬎0.31).Post hoccomparisons indicated that rats increased food cup time during the reward from day 1 to day 5 (Tukey: both control and cocaine,p⬍0.001) and again from day 5 to day 10 (Tukey: both control and cocaine,p⬍0.01), whereas there was no difference in food cup time during the post-CS⫺ across days (allp⬎0.76). Therefore, there was more time spent in the food cup after reward delivery than during the post-CS⫺ period on day 5 (Tukey: control,p⬍0.001, cocaine,p⬍0.002) and on day 10 (Tukey: control and cocaine,p⬍0.0001). There were no differences between drug groups for either outcome on any day (Tukey: allp⫽1.0).
Individual differences in conditioned approach phenotype and other behaviors
Given the dramatic role that cocaine experience played in altering conditioned responding, we next wanted to know whether indi-vidual differences in drug intake differentially altered other as-pects of motivated behavior. Based on PCA scores relative to the CS⫹cue from scored behavior on day 10 (thus including some subjects that were excluded above due to missing data from days 1 and 5), we identified 5 ST (PCA⬎0) and 15 GT (PCA⬍0) in the control group and 11 ST and 4 GT in the cocaine group, a distribu-tion that was significantly different (2⫽6.239,p⫽0.0125). Using
these classifications, we then investigated whether GT and ST rats displayed differential behavior during self-administration. In co-caine rats, those that were identified as ST during FOC were found to have pressed at a higher rate (and thus had more total cocaine intake over the course of the experiment) than those that displayed GT during FOC,t(11)⫽2.27,p⫽0.04 (Fig. 5A). In contrast, ST and
GT controls showed equivalent pressing rate during the earlier water self-administration,t(13)⫽0.55,p⫽0.59. Likewise,
co-caine ST rats were significantly more likely to show significantly elevated rates of extinction pressing than cocaine GT rats,t(9)
⫽2.76, p⫽ 0.02, whereas control ST and GT rats showed
similar rates of extinction pressing, t(12) ⫽ 0.03, p ⫽ 0.98
(Fig. 5B).
However, ST and GT status during FOC had no effect on subsequent SOC (Fig. 5C). For the first 2 d of SOC, there was
a significant interaction between SOC cue type (baseline, SOC⫹, SOC⫺) and drug,F(2,112)⫽5.17,p⫽0.0072, which
supported our earlier observation that controls showed signif-icant increases in food cup approaches for the SOC⫹relative to the baseline and SOC⫺, as well compared with cocaine SOC⫹, whereas cocaine subjects showed no differences be-tween any of the stimuli. However, there was no effect of PCA type (ST vs GT),F(1,56)⫽1.50,p⫽0.23, or any interaction of
PCA by any other factor. Indeed, planned comparisons be-tween food cup approaches during the SOC⫹and SOC⫺cues indicated that rats showed greater approach during the SOC⫹ than the SOC⫺in both control ST (Tukey: p⫽0.027) and control GT (Tukey:p⫽0.0001) subjects, but not in the co-caine ST (Tukey:p⫽0.98) or cocaine GT (Tukey:p⫽0.59) subjects. Furthermore, there was no reliable difference in food
cup approach during the SOC⫹between ST and GT rats in
either controls (Tukey:p⫽0.71) or cocaine rats (Tukey:p⫽ 0.97). Therefore, cocaine experience appeared to selectively alter the shape of the associative response during FOC, but to more generally abolish the ability to learn second-order associations.
FSCV during FOC
After 9 d of FOC and with the discrimination well learned, real-time DA release patterns were measured in the NAc core (control, n⫽7; cocaine,n⫽8) or shell (control:n⫽7; cocaine:n⫽9) using FSCV while rats performed the Pavlovian task.
In the NAc core (Fig. 6), phasic DA release patterns in controls tracked information about the Pavlovian stimuli (Fig. 6A,C). DA release increased rapidly after cue onset, was greater for CS⫹than CS⫺, and then returned to low levels by the time of reward re-ceipt. In contrast, cocaine subjects showed a different pattern (Fig. 6B,D), with a much more blunted response to the cues and a large DA release event at reward delivery. We quantified these patterns by first looking at average DA release 1 s after cue onset (Fig. 6E). A two-way ANOVA indicated that there was both a main effect of drug,F(1,13)⫽6.97,p⫽0.02, and an interaction of
drug⫻cue,F(1,13)⫽5.71,p⫽0.03, which indicated that control
DA successfully discriminated between CS⫹ and CS⫺ cues (Tukey:p⫽0.02), whereas cocaine DA did not (Tukey:p⫽0.99). Furthermore, DA release for the CS⫹cue was greater in controls than in cocaine subjects (Tukey:p⫽0.01), but did not differ for the CS⫺(Tukey:p⫽0.61).
SOC+
SOC-0 1 2 3
Foo
d
c
u
p E
n
tr
ie
s
(S
O
C
m
inu
s
B
L
) Control (GT)
Control (ST) Cocaine (GT) Cocaine (ST) *
* †
A
Saline Cocaine 0
10 20 30
40 GT
ST
Average Presses / Day
(2 hr sessions)
Saline Cocaine 0
20 40 60 80
100 GT
ST
Extinction Presses
(2 hr session)
C
B
§
§
In contrast to cue encoding, cocaine subjects showed a bias toward greater DA release during rewards (Fig. 4F). Compared with the pretrial baseline, a factorial ANOVA indicated a signifi-cant interaction between drug⫻phase (baseline vs reward pe-riod)⫻reward (food vs post-CS⫺),F(1,13)⫽4.87,p⫽0.04. This
result was due to cocaine animals releasing significantly more DA
during the reward than during the nonrewarded post-CS⫺
period (Tukey:p⫽0.0002); there was no such difference between
reward types in controls (Tukey:p⫽0.11). Further, DA at reward was significantly enhanced in cocaine compared with controls (Tukey:p⫽0.01), though DA to the post-CS⫺did not differ between groups (Tukey:p⫽0.99).
This asymmetry in cue and reward encoding was then quan-tified by subtracting peak DA at reward from peak DA during the CS⫹(Fig. 6F, inset). DA at the cue minus DA at the reward was significantly different between the groups,t(13)⫽3.15,p⫽0.008;
A
∆DA ∆DA
CS+
CS-0 25 50 75 100 125
Peak [DA] at Cue (nM)
Control
Cocaine
*†
E
Reward
PostCS-0 25 50 75
Peak [DA] at Reward (nM)
*†
CS+
CS-0 2000 4000 6000 8000
AUC (∑Cue+Reward [DA] n
M
)
Control
Cocaine
*
*
G
-10 CS+ Rew 20
time (s) -0.4
-0.4 1.3 Eapp
3 Current (nA)1 0 -1 -2
-10 CS+ Rew 20
time (s) -0.4
-0.4 1.3 Eapp
3 Current (nA)1 0 -1 -2
1 nA 0.5V 1 nA
0.5V
B
F
C
D
-10 CS+ Rew 20 -10 CS+ Rew 20
-100 -50 0 50 100
Pre
d
ic
ti
o
n
E
rro
r
(R
e
w
a
rd
C
u
e
[
D
A
])
§ §
CS+ Cocaine CS- Cocaine
25nM CS+ Control
CS- Control
25nM
this difference was significantly greater than chance (i.e., cue bi-ased) in controls,t(6)⫽4.15,p⫽0.006, but significantly less than
chance (i.e., reward biased) in cocaine subjects,t(7)⫽ ⫺8.51,p⬍
0.0001.
Next we examined the cumulative DA release (AUC) for the cue and reward periods (Fig. 6G). This analysis summates the DA concentration in each 100 ms bin across the 10 s cue period and 2 s of the reward period and captures slower DA release kinetics that may not be apparent from peak values at cue and reward onset. Surprisingly, there was no effect of drug,F(1,13)⫽0.55,p⫽
0.47, or interaction of drug⫻cue,F(1,13)⫽1.91,p⫽0.29;post
hoctests indicated that there was more total DA released for the CS⫹/reward than the CS⫺/post-CS⫺ trials in both controls (Tukey:p⫽0.004) and cocaine subjects (Tukey:p⫽0.04), but
that there was no difference in total DA between groups during the CS⫹/reward (Tukey:p⫽0.61) or CS⫺/post-CS⫺stimuli (Tukey:p⫽0.99).
The NAc shell showed a different pattern of both encoding and sensitivity to cocaine exposure. Example traces show repre-sentative trials in controls (Fig. 7A) and cocaine subjects (Fig. 7B) for the CS⫹. DA release patterns in the shell of controls generally tracked differences in associative cue value for the different stim-uli, with greater DA for both the cue and reward receipt during the CS⫹trials than in the CS⫺(Fig. 7C). In contrast, shell DA release in cocaine subjects was strongly attenuated, and showed little difference in encoding between any stimuli (Fig. 7D). To quantify this, a two-way ANOVA compared peak baseline sub-tracted DA after the cue for the stimuli by group (Fig. 7E). Here,
A
B
∆DA 1 nA
0.5V
-0.4
-0.4 1.3
-10 CS+ Rew 20
3 Current (nA)1 0 -1 -2
-10 CS+ Rew 20
∆DA
-10 CS+ Rew 20
-0.4
-0.4 1.3
-10 CS+ Rew 20
3 Current (nA)1 0 -1 -2
1 nA 0.5V
C
D
E
F
G
CS+
CS-0 25 50 75
Peak [DA] at Cue (nM)
Control
Cocaine
*†
Rew PostMin 0
25 50 75
Peak [DA] at Reward (nM)
*†
CS+
CS-0 1000 2000 3000 4000 5000
AUC (∑Cue+Reward [DA] nM)
*†
Control
Cocaine
-75 -50 -25 0 25 50 75
Pre
d
ic
tio
n
Er
ro
r
(R
e
w
ar
d
C
u
e
[D
A
])
CS+ Control CS- Control
25nM
CS+ Cocaine CS- Cocaine
25nM
a significant interaction of drug⫻cue,F(1,13)⫽11.85,p⫽0.004,
indicated that more DA was released after the CS⫹than the CS⫺ in controls (Tukey:p⫽0.0006), whereas there was no such dif-ference in cocaine subjects (Tukey:p⫽0.77). Although there was greater DA release during the CS⫹for controls relative to cocaine subjects (Tukey:p⫽0.008), DA for the CS⫺was similar between groups (Tukey:p⫽0.99).
Next, we quantified reward-related DA release. Unlike in the core, DA release in the shell closely tracked the reward receipt in controls, but less so in cocaine animals (Fig. 7F). A two-way ANOVA found both a main effect of drug,F(1,13)⫽6.11,p⫽
0.03, and an interaction of drug⫻reward,F(1,13)⫽8.52,p⫽
0.01, which indicated that reward-evoked DA release in controls was greater than the corresponding post-CS⫺period (Tukey: p⫽0.005), whereas this difference did not exist for cocaine sub-jects (Tukey:p⫽0.25). Indeed, there was greater DA release for the reward in controls than for cocaine subjects (Tukey:p⫽ 0.005), but similar amounts of DA for the post-CS⫺period for both groups (Tukey:p⫽0.99). Therefore, unlike in the core, there was no reliable difference between cue-evoked and reward-evoked DA in either group (Fig. 7F, inset).
Finally, the total amount of DA release in the shell (AUC) during the cue and reward was strikingly different from what was seen in the core (Fig. 7G). Although there was no main effect of drug,F(1,13)⫽2.87,p⫽0.11, there was an interaction of drug⫻
cue/reward,F(1,13)⫽13.56,p⫽0.003, which indicated greater
DA release in controls for the CS⫹/reward trials than in the CS⫺/ post-CS⫺trials (Tukey:p⫽0.0006) or in CS⫹/reward trials in cocaine subjects (Tukey:p⫽0.02). There was no difference in the cocaine group between CS⫹/reward and CS⫺/post-CS⫺trials (Tukey:p⫽0.90). Therefore, cocaine experience decreased asso-ciative NAc shell DA release in general, unlike in the core, where changes in release patterns after cocaine were stimulus specific.
DA release in GT and ST
Previous work has suggested that differences in patterned DA release are associated with GT and ST behaviors (Flagel et al., 2011;Saunders and Robinson, 2012). Specifically, in ST, DA in-creases for the predictive and “salient” cue while decreasing for the predicted reward, whereas in GT, DA remains similar for the cue and reward. Although this has been demonstrated in the NAc core, it is unknown whether this is specific to the subregion or if it is a general property of the mesolimbic DA system. To test this, we analyzed trials from subjects in the NAc core and shell in cocaine and control groups based on whether the subject gener-ally showed ST or GT behavior, as determined from their PCA index.
In the NAc core, controls (Fig. 8A–C) showed a pattern of DA peak release markedly consistent with previous reports (Flagel et al., 2011), but this changed with drug experience. A 3-way ANOVA indicated a significant effect of drug,F(1,149)⫽10.95,
p⫽0.001, and an interaction of drug⫻approach (i.e., ST vs GT)⫻event (i.e., cue vs reward),F(1,149) ⫽10.83,p⫽0.001.
Specifically, in GT controls, there was no difference between CS⫹ and reward-evoked DA (Tukey:p⫽0.96), whereas in ST con-trols, the CS⫹elicited significantly greater DA than the reward (Tukey:p⫽0.005). Therefore, DA at the CS⫹was significantly greater in ST than GT (Tukey:p⬍0.0001), whereas there was no difference in DA between ST and GT at the reward (Tukey:p⫽ 0.81;Fig. 8C). In contrast, cocaine subjects failed to show this pattern (Fig. 8D–F). GT cocaine subjects failed to show differ-ences in peak DA release between CS⫹ and reward (Fig. 8F; Tukey:p⫽0.38), whereas ST cocaine subjects showed a signifi-cant difference due to greater DA at the reward than the CS⫹cue (Tukey:p⬍0.0001). Therefore, ST and GT cocaine subjects did not show differences at the time of the CS⫹(Tukey:p⫽0.90), but there was reliably more DA at the reward for ST than GT
CS+ Reward
0 50 100 150 200
Peak [DA] (nM)
GT
ST
*§
CS+ Reward
0 50 100 150 200
Peak [DA] (nM)
GT
ST *§†
E
A
B
C
D
F
-10 Cue Rew 20
time (s)
CS+ (GT: Control) CS- (GT: Control)
25nM
time (s)
CS+ (ST: Control) CS- (ST: Control)
25nM
-10 Cue Rew 20
time (s)
CS+ (GT: Cocaine) CS- (GT: Cocaine)
25nM
-10 Cue Rew 20
time (s)
CS+ (ST: Cocaine) CS- (ST: Cocaine)
25nM
-10 Cue Rew 20
subjects (Tukey:p⫽0.02). Finally, cocaine experience selectively impaired peak DA release in ST, but not GT rats. During the CS⫹ cue, control ST rats released significantly more DA than cocaine ST rats (Tukey:p⬍0.0001), whereas there was no difference in DA release at the CS⫹for GT subjects (Tukey:p⫽0.72). How-ever, cocaine experience did not modulate DA release at reward in either ST (Tukey:p⫽0.42) or GT (Tukey:p⫽1.0) subjects.
The NAc shell showed a similar pattern of peak DA release as the core in controls (Fig. 9). In the shell, a 3-way ANOVA indi-cated a main effect of drug,F(1,131)⫽20.71,p⬍0.0001, a
signif-icant interaction of drug⫻approach,F(1,131)⫽3.99,p⫽0.048,
and a trend toward significance for an interaction of drug⫻ approach⫻event,F(1,131)⫽2.76,p⫽0.09. Specifically, in GT
controls, there was no difference between CS⫹ and reward (Tukey:p ⫽0.90), whereas in ST controls, there was a trend toward greater DA at the CS⫹than reward (Tukey:p⫽0.08). Directly comparing these groups, there was significantly greater peak DA in ST controls than GT controls (Tukey:p⫽0.003), whereas there was no difference in reward between ST and GT (Tukey:p⫽0.99). In contrast, there was no difference between CS⫹and reward in either GT cocaine (Tukey:p⫽1.0) or ST cocaine (Tukey:p⫽0.84) subjects, nor did ST and GT cocaine subjects differ in peak DA signaling for either the CS⫹(Tukey: p⫽1.0) or reward (Tukey:p⫽1.0). Comparing the effects of cocaine on these measures, ST controls showed significantly greater DA release than ST cocaine subjects for both the CS⫹ (Tukey:p⫽0.0001) and the reward (Tukey:p⫽0.02), but GT controls and GT cocaine subjects did not differ on either measure (Tukey: CS⫹,p⫽0.94; reward,p⫽0.44).
If DA release supports ST behaviors, then animals with the greatest ST should also show the greatest amounts of DA release to predictive cues. We assessed correlations between peak DA
release from both core and shell to the cue and reward relative to average ST and GT behavior displayed by individual subjects (Fig. 10A–D). In controls, there was a significant positive corre-lation between the amount of ST behavior and DA release at the CS⫹(r⫽0.56,p⫽0.03;Fig. 10A), but not at the reward (r⫽ 0.08,p⫽0.77;Fig. 10B), whereas there was no correlation be-tween the rate of control GT behaviors and DA at CS⫹(r⫽0.11, p⫽0.69;Fig. 10C) or reward (r⫽0.004,p⫽0.99;Fig. 10D). In contrast, cocaine rats showed no significant correlations between DA release and ST or GT behaviors at either the CS⫹(ST:r⫽ 0.06,p⫽0.85,Fig. 10A; GT:r⫽0.11,p⫽0.14,Fig. 10C) or the reward (ST:r⫽0.01,p⫽0.96,Fig. 10B; GT:r⫽0.03,p⫽0.92, Fig. 10D). Indeed, during the CS⫹cue, the slope of the correla-tion between ST and DA in controls was significantly different from that in cocaine subjects,F(1,24)⫽6.32,p⫽0.02 (Fig. 10A),
but drug-based comparisons of correlational slopes were not dif-ferent for ST and DA during reward (Fig. 10B) or for any GT comparisons (Fig. 10C,D; all ANOVAp⬎0.20).
Finally, we wanted to understand whether motivation for co-caine self-administration and total amount of drug intake was related to DA signaling on the Pavlovian task. Here, we assessed how the amount cocaine intake during self-administration (Fig. 11A) and the rate of drug-loading presses, which is considered a measure of motivation for the cocaine reward (Ahmed and Koob, 1998;Wheeler et al., 2008;Fig. 11B), was related to a measure of prediction error. We computed a prediction-error-type signal by subtracting DA evoked by the CS⫹from DA evoked by the re-ward. With this measure, the greater the DA release elicited by the reward relative to the cue, the greater the prediction error. We found that there was a strong positive correlation between this prediction error DA signal in the core and shell and the total cocaine intake during self-administration,r⫽0.74,p⫽0.015,
CS+ Reward
0 25 50 75 100 125
Peak [DA] (nM)
GT
ST CS+ Reward
0 25 50 75 100 125
Pe
a
k
[
D
A
]
(n
M
)
GT
ST *#†
†
B
C
A
D
E
F
CS+ (GT: Control) CS- (GT: Control)
25nM
-10 Cue Rew 20
time (s) time (s)
CS+ (ST: Control) CS- (ST: Control)
25nM
-10 Cue Rew 20
time (s)
CS+ (GT: Cocaine) CS- (GT: Cocaine)
25nM
-10 Cue Rew 20
CS+ (ST: Cocaine) CS- (ST: Cocaine)
25nM
time (s)
-10 Cue Rew 20
Figure 9. NAc shell population DA concentrations (i.e., average of trials) for ST (controls:n⫽28; cocaine:n⫽70) and GT subjects (controls:n⫽70; cocaine:n⫽56). In controls, the CS⫹cue generally elicited more DA release than the CS⫺in both GT (A) and ST (B) subjects.C, Peak DA for controls showed greater DA at the CS⫹in ST than GT, but similar DA at the reward. Cocaine-experienced animals showed no discrimination between cues in both the GT (D) and ST (E) groups.F, Peak DA in cocaine subjects did not differ at the cue or reward between ST and GT. #p⬍
Cocaine
r = 0.74, *P = 0.015
Cocaine
r = 0.76, *P = 0.010
B
A
50 75 100 125
-100 -50 0 50 100
Total Cocaine Intake (mg)
Pr
edict
ion Err
o
r
(R
e
w
a
rd
- Cu
e
[D
A
]) (n
M
)
0 2 4 6
-100 -50 0 50 100
Drug Loading (presses)
Prediction Erro
r
(R
e
w
a
rd
-
C
u
e
[
D
A
])
(
n
M
)
Figure 11. DA signals of prediction-error-type signal (i.e., DA at reward minus DA at cue) from both the core and shell were significantly correlated with the total amount of cocaine ingested during self-administration (A) and the average number of drug loading presses (average number of presses made during the first 5 min of a session on the last 4 self-administration days) during stable self-administration (B).
Control
r = 0.56, *P = 0.03
Cocaine
r = 0.06, P = 0.85
Control
r = -0.08, P = 0.77
Cocaine
r = 0.01, P = 0.96
Control
r = -0.17, P = 0.69
Cocaine
r = 0.11, P = 0.71
Control
r = 0.00, P = 0.99
Cocaine
r = 0.03, P = 0.92
B
A
D
C
0 50 100
-50 0 50 100 150 200
% SignTrack
Pe
ak
CS+ [DA] (nM)
Control
Cocaine
0 50 100
-50 0 50 100 150 200
% SignTrack
Pea
k
R
e
w
a
rd
[
D
A]
(
n
M
)
Control
Cocaine
0 50 100
-50 0 50 100 150 200
% GoalTrack
Peak CS+
[D
A]
(
n
M
)
Control
Cocaine
0 50 100
-50 0 50 100 150 200
% GoalTrack
Peak R
e
ward [D
A]
(
n
M
)
Control
Cocaine
indicating that, as rats self-administered more cocaine, they be-came more likely to encode reward rather than cue information. Likewise, the rate of drug loading was strongly correlated with the prediction error signal,r⫽0.76,p⫽0.010, suggesting that higher motivation for drug taking similarly shifted rats away from nor-mal DA encoding patterns. Consistent with drug loading being a measure of motivation, the rate of loading was strongly positively correlated with the number of presses in extinction (r⫽0.89,p⫽ 0.0005), but the relationship between total drug intake and ex-tinction pressing did not reach significance (r⫽0.53,p⫽0.12).
Discussion
Here, cocaine self-administration induced abnormal effects on both patterns of DA release within NAc subregions and on vari-ous aspects of DA-linked associative behaviors. Specifically, whereas core DA release in controls displayed encoding that both discriminated between different cues and was biased toward the encoding of cues rather than rewards, cocaine experience im-paired the ability for phasic DA release in the NAc core to dis-criminate between cues and instead biased release toward encoding of reward delivery. In contrast, phasic DA release in the shell was almost completely abolished in cocaine-experienced rats, whereas in controls, DA release was robust for both cue and reward and discriminated between cue type. Surprisingly, co-caine appeared to decouple the normal relationship between DA and conditioned approach. Although increased DA release for the CS⫹cue positively correlated with the rate of ST behavior in controls, cocaine subjects failed to show this relationship. Strik-ingly, cocaine rats displayed significantly greater rates of ST be-havior than controls while simultaneously releasing less DA to reward-predictive cues. Collectively, these findings suggest that cocaine experience is capable of fundamentally and persistently altering the dynamics of multiple DA signals in the NAc, making it likely that these abnormal signals may contribute to the cogni-tive deficits and altered decision-making behavior exhibited by chronic cocaine addicts.
Cocaine self-administration experience altered various as-pects of conditioned Pavlovian behavior. Consistent with previ-ous reports (Saddoris and Carelli, 2014), cocaine-experienced rats successfully learned a first-order association (CS⫹/food), but were unable to learn a second-order association (SOC⫹/ CS⫹). More surprisingly, we found that first-order conditioned approach behaviors strikingly varied between cocaine and con-trol groups; cocaine rats preferentially displayed ST behaviors for Pavlovian food associations, whereas controls were more likely to display GT behaviors.
Previous work has suggested that individual differences in approach behaviors are an intrinsic feature of the animal. For example, rats identified as ST in a food-based conditioned ap-proach task show greater sensitivity to subsequently trained cocaine-conditioned cues than GT rats (Saunders and Robinson, 2010;Meyer et al., 2012a;Yager and Robinson, 2013), suggesting that the shape of the conditioned approach behavior is consistent within a subject across multiple CS–US contingencies. Here, however, because our rats were randomly assigned to a drug con-dition, our findings support the idea that cocaine experience sig-nificantly alters individual response biases. Consistent with this, whereas previously identified ST rats showed a greater overall approach to cocaine cues than GT rats, both GT and ST rats showed a significant increase in ST behaviors after repeated co-caine exposure in a dose-dependent manner (Yager and Robin-son, 2013). Similarly, previous experience with alcohol (McClory and Spear, 2014;Spoelder et al., 2015) or amphetamine (
Robin-son et al., 2015) induces increases in ST in subsequent food-paired conditioning procedures. Therefore, the ability for drugs to push subjects into an ST phenotype may illuminate why re-lapse is such a common feature of drug addiction. For drug-experienced animals, cues can become endowed with powerful motivational significance and elicit intense feelings of craving to resume drug taking (Wheeler et al., 2011). Although ST animals are inherently already at elevated risk of relapse (Yager and Rob-inson, 2013;Saunders et al., 2014), repeated drug intake appears to shift even GT animals into a more ST behavioral mode, thereby establishing a vicious cycle wherein more drug intake increases the likelihood of ST behaviors, which then may induce more stimulus-driven craving and higher incidence of relapse.
Against this behavioral background, DA release in the core and shell exhibited a complex relationship with ST and GT behaviors. In controls, cue-related DA release was potentiated in ST relative to GT, consistent with previous work (Flagel et al., 2011). For ST control rats, DA release during the CS⫹was greater than at reward and was also greater than at the CS⫹for GT controls. In contrast, GT con-trols showed similar levels of DA release to the CS⫹and reward. Indeed, the amount of DA released during the cue reliably predicted the proportion of time the control rats spent displaying ST, but not GT, behaviors. That these factors were true in both the core and shell suggests that enhanced ST-related DA release is a general feature of mesolimbic DA signaling rather than necessarily being confined to core- or shell-specific circuits.