Impact of short-chain galactooligosaccharides on the
gut microbiome of lactose-intolerant individuals
M. Andrea Azcarate-Perila,b,1, Andrew J. Ritterc, Dennis Savaianod, Andrea Monteagudo-Meraa,b, Carlton Andersone, Scott T. Magnessf,g,h,i, and Todd R. Klaenhammerj,2
aDepartment of Cell Biology and Physiology, School of Medicine, University of North Carolina at Chapel Hill, Chapel Hill, NC 27514;bMicrobiome Core Facility, School of Medicine, University of North Carolina at Chapel Hill, Chapel Hill, NC 27514;cRitter Pharmaceuticals, Inc., Los Angeles, CA 90067; dDepartment of Nutrition Science, Purdue University, West Lafayette, IN 47907;eAdvanced Analytics Core, School of Medicine, University of North Carolina at Chapel Hill, Chapel Hill, NC 27514;fDepartment of Medicine, School of Medicine, University of North Carolina at Chapel Hill, Chapel Hill, NC 27514; gDepartment of Biomedical Engineering, School of Medicine, University of North Carolina at Chapel Hill, Chapel Hill, NC 27514;hDepartment of Cell and Molecular Physiology, School of Medicine, University of North Carolina at Chapel Hill, Chapel Hill, NC 27514;iAdvanced Analytics Core, School of Medicine, University of North Carolina at Chapel Hill, Chapel Hill, NC 27514; andjDepartment of Food, Bioprocessing and Nutrition Sciences, North Carolina State University, Raleigh, NC 27695
Edited by Ralph R. Isberg, Howard Hughes Medical Institute/Tufts University School of Medicine, Boston, MA, and approved November 30, 2016 (received for review May 6, 2016)
Directed modulation of the colonic bacteria to metabolize lactose effectively is a potentially useful approach to improve lactose di-gestion and tolerance. A randomized, double-blind, multisite pla-cebo-controlled trial conducted in human subjects demonstrated that administration of a highly purified (>95%) short-chain galac-tooligosaccharide (GOS), designated “RP-G28,” significantly im-proved clinical outcomes for lactose digestion and tolerance. In these individuals, stool samples were collected pretreatment (day 0), after GOS treatment (day 36), and 30 d after GOS feeding stop-ped and consumption of dairy products was encouraged (day 66). In this study, changes in the fecal microbiome were investigated using 16S rRNA amplicon pyrosequencing and high-throughput quantita-tive PCR. At day 36, bifidobacterial populations were increased in 27 of 30 of GOS subjects (90%), demonstrating a bifidogenic response in vivo. Relative abundance of lactose-fermentingBifidobacterium,
Faecalibacterium, andLactobacilluswere significantly increased in response to GOS. When dairy was introduced into the diet, lactose-fermentingRoseburiaspecies increased from day 36 to day 66. The results indicated a definitive change in the fecal microbiome of lac-tose-intolerant individuals, increasing the abundance of lactose-metabolizing bacteria that were responsive to dietary adaptation to GOS. This change correlated with clinical outcomes of improved lactose tolerance.
prebiotic
|
GOS|
lactose intolerance|
microbiomeA
limited ability to digest lactose occurs when the intestinal lactase enzyme is reduced in the brush border of the small bowel mucosa. Consumption of dairy foods by lactose-intolerant individuals may result in clinical symptoms including abdominal pain, diarrhea, bloating, flatulence, and abdominal cramping. In these cases, lactose travels through the gastrointestinal tract and is fermented in the colon, producing acetate, carbon dioxide, hydrogen gas, and methane by gas-producing microbes. Ap-proximately 75% of the global human population are lactose maladsorbers (1, 2). In the United States, it is estimated that up to 80 million Americans are at risk for lactose intolerance.Efforts to address lactose intolerance include avoidance of dairy foods, reduction in the lactose content of milk through treatment with microbial lactases, and the use of lactase enzymes to process milk before dairy consumption (3). Savaiano et al. conducted a randomized, double-blind, parallel-group, placebo-controlled study at two sites in the United States (4). A high purity (>95%) galactooligosaccharide (GOS/RP-G28) or a pla-cebo (Sweetose; Tate & Lyle Ingredients) was administered in increasing doses to 62 lactose-intolerant subjects for 36 d. Subjects refrained from consuming lactose during the GOS treatment pe-riod. After GOS treatment, subjects reintroduced dairy products into their diets for an additional 30 d and then were challenged for
lactose digestion and were evaluated for symptoms improvement via a Likert scale. Subjects consuming GOS trended toward improve-ment in overall symptoms after 36 d of GOS feeding and for an additional 30 d after GOS treatment that included a dairy diet. Subjects on GOS were six times more likely than control subjects to claim they were lactose tolerant after dairy foods had been reintroduced into their diets posttreatment (P=0.0389).
GOS are short-chain galactooligosaccharides comprising two to five residues of galactose terminating with an N-terminal glucose that form lactose as a terminal disaccharide within the molecule. These oligosaccharides are not digestible by humans but are readily fermented by some members of the commensal microbiota capable of fermenting GOS and lactose, notably lac-tobacilli and bifidobacteria, and also by other microbial members of the intestinal community (5). The pathway for GOS utilization was demonstrated forLactobacillus acidophilus(6) and was shown
Significance
Approximately 75% of the global human population are lactose malabsorbers. In a previous clinical trial, it was shown that feeding a high-purity galactooligosaccharide (>95% GOS) could improve symptoms of lactose-intolerant subjects, attaining lac-tose tolerance in a majority of subjects. To investigate the mechanism, we examined the microbiome of human subjects before and after GOS feeding. The results show a significant shift in the microbiome of responsive individuals, including lactose-fermenting microbes in their stools. The high-purity prebiotic GOS resulted in adaptive shifts in the microbiome and correlated with improvement in clinical symptoms.
Author contributions: M.A.A.-P., A.J.R., D.S., and T.R.K. designed research; M.A.A.-P., A.J.R., D.S., A.M.-M., C.A., and T.R.K. performed research; M.A.A.-P., S.T.M., and T.R.K. contributed new reagents/analytic tools; M.A.A.-P., A.J.R., and T.R.K. analyzed data; and M.A.A.-P., A.J.R., D.S., and T.R.K. wrote the paper.
Conflict of interest statement: This study was funded by Ritter Pharmaceuticals, Inc., of which A.J.R. is the founder, and by the North Carolina Agriculture Foundation. T.R.K. and D.S. are on the scientific advisory board for Ritter Pharmaceuticals, Inc. and assisted in the design, management, and conduct of the study and in the interpretation of data from the study. The work at the University of North Carolina at Chapel Hill Microbiome Center also was funded in part by Ritter Pharmaceuticals, Inc. and by the North Carolina Agri-culture Foundation. Ritter Pharmaceuticals, Inc. was the sole source of highly purified galactooligosaccharide (>95%) GOS that was available for the study. The results of these studies have been scientifically judged and interpreted independently by the authors without bias based on the funding or industrial partners involved.
This article is a PNAS Direct Submission.
Freely available online through the PNAS open access option.
1Present address: Division of Gastroenterology and Hepatology, Department of Medicine, School of Medicine, University of North Carolina at Chapel Hill, Chapel Hill, NC 27514. 2To whom correspondence should be addressed. Email: [email protected].
This article contains supporting information online atwww.pnas.org/lookup/suppl/doi:10.
1073/pnas.1606722113/-/DCSupplemental.
MICRO
BIOLOGY
PNAS
to be driven by the LacS permease that transports both lactose and GOS into the bacterium. GOS then is broken down intracellularly by galactosidases, and eventually β-galactosidase hydrolyzes the terminal lactose. GOS consumption has been reported to promote the growth of bifidobacteria in the human gastrointestinal tract, a bifidogenic response widely considered beneficial because intrinsic Bifidobacteriumpopulations were elevated (5).
The objective of this study was to investigate whether a shift occurred in the fecal microbiome of lactose-intolerant human subjects who were treated with GOS and a dairy diet and who exhibited a clinical response toward lactose tolerance. Fecal samples were taken at day 0, day 36, and day 66, and microbiome changes were evaluated by 16S rRNA amplicon sequencing and high-throughput quantitative PCR (qPCR) within each subject over the three time points to determine if changes occurred in the microbiome of lactose-intolerant individuals consuming GOS.
Results
Experimental Design and Chemical Composition of GOS/RP-G28. Subjects with a self-reported history of lactose intolerance were assessed via a hydrogen breath test (HBT) after a 25-g lactose challenge. Individuals with a minimum symptom score and a positive HBT were randomly assigned to either GOS- or placebo-treatment groups (2:1). The placebo was corn syrup (Sweetose) with a consistency and sweetness similar to GOS and was used at the same dosing schedule and with the same packaging. GOS and placebo were escalated in 5-d increments from 1.5 g to 15 g consumed once a day. The subjects avoided dairy during the 35-d treatment. After completion of the treatment period, subjects
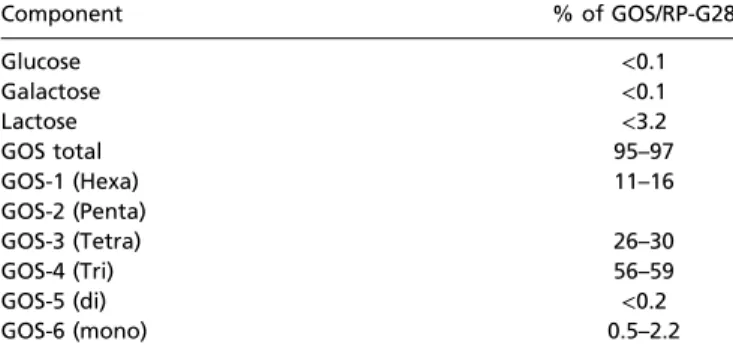
samples from the treatment and placebo groups were collected at days 0, 36, and 66 (4). The GOS preparation used throughout this study and in the prior clinical study by Savaiano et al. (4), designated “RP-G28”(Ritter Pharmaceuticals, Inc.), was>95% GOS (Table 1).
Characterization of the Gut Microbiome of Lactose-Intolerant Individuals. Microbiome metrics of fecal samples from patients enrolled in a randomized, double-blind, parallel-group, placebo-controlled study conducted to test the effectiveness of RP-G28 in two sites in the United States (4) by terminal restriction length polymorphism analysis (T-RFLP) and 16S rRNA amplicon pyrosequencing. T-RFLP analysis was conducted in all treatment and placebo samples (n=380). At the time of this analysis, T-RFLP was a cost-effective method for analyzing the composition of the gut microbiome in a large number of samples. Placebo samples were analyzed only by T-RFLP and showed no changes in microbiome composition over time (Fig. 1A); therefore we performed 16S rRNA gene sequencing only on GOS samples. In the GOS group, the baseline samples (day 0) served as each individual’s own control. T-RFLP analysis is based on PCR amplification and endonuclease restriction-generated fragments which permit a qualitative assessment of unique bacterial groups present, even rare ones, but do not provide information about the relative abundance of any given bacterial spe-cies. In this study, peak files for all samples were compressed in silico to identify unique terminal restriction fragments (TRFs). A direct comparison of unique TRFs represented in at least 3% (if TRFs were binned, 2% if not) of the total samples from treatment and placebo showed a significant change in the number of TRFs that were dif-ferentially represented (over- or underrepresented) (79 unique peaks) in day 36 samples from the treatment group compared with the placebo group (Fig. 1A). Moreover, a dramatic change oc-curred in the GOS treatment group at day 66, after the cessation of GOS at day 36 and the addition of dairy to the diet. This analysis represents only changes in number of unique TRFs without discriminating between positive or negative changes.
We next performed 16S rRNA amplicon pyrosequencing only on samples from the treatment group (n=307). We included the three fecal samples obtained from each subject at three time points (a total of nine samples per individual). Amplicon se-quencing yielded a total of 911,970 sequences (2,990±1,677 reads per sample) and an average of 2,990±1,679 operational taxonomic units (OTUs) per sample. Sequencing data assigned the ma-jority of OTUs to the phyla Firmicutes (48.7 ±27.1%), Bac-teroidetes (43.9 ± 26%), and Proteobacteria (1.0 ± 1.6%);
used in the present study
Component % of GOS/RP-G28
Glucose <0.1
Galactose <0.1
Lactose <3.2
GOS total 95–97
GOS-1 (Hexa) 11–16
GOS-2 (Penta)
GOS-3 (Tetra) 26–30
GOS-4 (Tri) 56–59
GOS-5 (di) <0.2
GOS-6 (mono) 0.5–2.2
Fusobacteria, Tenericutes, Elusimicrobia, Actinobacteria, Syn-ergistetes, Cyanobacteria, and Lentisphaerae were detected at levels<1%, in agreement with previous reports of the human gut microbiome composition (7). In addition, 5.5±4% of sequences were not assigned to any bacterial phylum. It should be noted that while our study was underway the sequencing primers used for 16S rRNA amplicon sequencing were reported to underrepresent the phylum Actinobacteria and specifically Bifidobacteriumspecies (8).
More in-depth analysis by unweighted Unifrac similarity ma-trices and subsequent analysis of similarities (ANOSIM) and permutational multivariate analysis of variance (PERMANOVA) analyses revealed a significant correlation (ANOSIMR=0.218, P=0.0001; PERMANOVA pseudo-F=3.4318,P=0.0001) be-tween microbiome composition and the day when GOS-fed sub-jects were sampled (day 0 or baseline, and day 36 and day 66 as categories) (Fig. 1B). The variance percent explained in the principal coordinate analysis (PCoA) suggested that the micro-biome of fecal samples from individuals at day 36 was not dra-matically impacted by GOS, but at day 66, when dairy had been reincorporated in the diet, the microbiome shifted to specific microbial clusters. Grouping of samples by individual patient was also statistically significant (ANOSIMR = 0.7064, P = 0.0001; PERMANOVA pseudo-F = 2.1239, P = 0.0001). Finally, a small but statistically significant (ANOSIMR<0.2;P<0.05, PERMANOVA pseudo-F>1, P= 0.0001) effect on variables was observed for the following factors: sex, weight, bloating, cramping, and abdominal pain, and for the combined strata of bloating, cramping, and abdominal pain by day. No effect was observed for the factors location, diarrhea, and flatulence (ANOSIM<0.2,P>0.05) (Table S1).
We observed significant differences (ANOVA with Tukey pairwise comparisonsP < 0.05) in Shannon diversity (H) and species richness (S) indexes between groups at different days (Fig. 2). Specifically, all samples had significantly lower diversity
and lower richness at day 66 than at day 0. Additionally, we observed lower microbial diversity and richness values at day 66 in individuals reporting cramping (H=4.38±1.11 and S= 116.38±38.66) than in individuals not reporting this symptom (H = 5.27 ±0.96 and S= 155.56± 37.66). No significant as-sociations were identified between diversity and richness indexes and sex for other gastrointestinal (GI) symptoms (bloating, flat-ulence, diarrhea, or abdominal pain).
Impact of GOS on the Composition and Function of the Gut Microbiome. To identify specific taxa affected by GOS consumption followed by a lactose/dairy diet, we conducted pairwise comparisons at the phylum and genus levels between days 0, 36, and 66 for indi-viduals in the treatment group. Significant differences [Wilcoxon signed-rank test with false-discovery rate (FDR) correctionP< 0.05] in the relative abundance of the phyla Fusobacteria and Actinobacteria were identified. The abundance of Fusobacteria decreased at days 36 and 66 (Fig. S1), whereas Actinobacteria showed a significant increase in responders at day 36 (see Fig. 4) and then a decrease at day 66 following cessation of GOS feeding. Analysis conducted at the genus level showed clear changes in microbiome profiles at days 36 and 66 compared with the baseline (day 0) (Fig. 3AandTable S2), with genera signif-icantly (Wilcoxon signed-rank testP<0.05; with FDR correction P<0.05) or borderline significantly (Wilcoxon signed-rank test P < 0.05; with FDR correction P > 0.05) differentially repre-sented in response to the interventions. In this analysis we in-cluded over- or underrepresented taxa that were of borderline significance because the applied FDR correction tends to be overly restrictive, and because lineages that, based on our ex-perience, were relevant for this study fell into that category. Moreover, the sequencing primers used in the present study have been reported to underrepresent the phylum Actinobacteria and specificallyBifidobacteriumspecies (8).
Fig. 2. Comparisons of Shannon diversity (H; number of species and species evenness) (Left) and species richness (S; number of species) (Right) indexes at day 0, day 36, and day 66 in all individuals (A) and in individuals reporting cramping (B). ANOVA analysis and Tukey tests were performed to identify statistically significant differences in relative abundance between time points (P<0.05). Yes, subject reports cramping; No, subject reports no cramping. Boxes represent 25–75%, and whiskers represent the 1.5 interquartile range. Horizontal lines within boxes represent median values.
MICRO
BIOLOGY
PNAS
The most impacted phylum was Firmicutes, with 25 genera modified, followed by Proteobacteria (five genera), Actinobacteria (four genera), Bacteroidetes (two genera), and Fusobacteria (one genus, Fusobacterium). Cluster analysis of significantly differen-tially represented genera identified four different clusters (Fig. 3B). Cluster I included taxa that were underrepresented at days 36 and 66 (i.e., their relative abundance showed a linear decrease over time), cluster II included taxa that were overrepresented at days 36 and 66 (i.e., their relative abundance showed a linear increase over time), cluster III included taxa that were underrepresented at day 36 but were overrepresented at 66 (compared with the previous time point), and cluster IV included taxa that were overrepresented at day 36 but were underrepresented at day 66. Genera in cluster I, interpreted as taxa suppressed by GOS and dairy, included genera in Enterobacteriaceae,Streptococcus, Clos-tridium, Lachnospira, Anaerotruncus, Ruminococcus, and others. Cluster II, interpreted as taxa enhanced in the long term by GOS, included the health-promoting genera Lactobacillus and Faecali-bacterium; the latter was found at lower population levels in indi-viduals with inflammatory bowel diseases (9, 10). Also enhanced in population were Christensenellaceae (Christensenellaceae_other), a poorly defined family enriched in individuals with a low body mass index (BMI). The cluster also included undefined Lachnospiraceae (Lachnospiraceae_2), Bulleidia, and a poorly characterized group of Tenericutes (RF39_other). Cluster III, interpreted as taxa suppressed by the GOS but not by dairy (or perhaps enhanced by dairy) comprised most of the Firmicutes, in-cluding lactose-fermenting Roseburiaand other potential bu-tyrate producers. Also included in the suppressed cluster at day 36 following GOS feeding wasFusobacterium, a genus that has been widely associated with adenomas and colorectal can-cer (11–13). Finally, cluster IV, interpreted as taxa increased by GOS but decreased when GOS feeding was halted, in-cluded three Actinobacteria lineages:Bifidobacterium, undefined Coriobacteriaceae (Coriobacteriaceae_other2), and Collinsella; two Bacteroidetes:Prevotella and Bacteroidales_other1; and
four Firmicutes: Granulicatellain the Lactobacillales order, Oscillospira, and undefined Clostridiaceae (Clostridiaceae_ other 2) in the Clostridiales order, andCatenibacteriumin the Erysipelotrichales order. Cluster I also included two Proteo-bacteria and Tenericutes genera.
Analysis of predictedβ-galactosidases from our 16S amplicon sequencing dataset using Phylogenetic Investigation of Com-munities by Reconstruction of Unobserved States (PICRUSt) (14) showed a significant (Kruskal–WallisP<0.01) incremental change in the relative abundance of ebgA, an evolvedβ -galac-tosidase subunit α (EC:3.2.1.23), and a borderline significant increase (P=0.07) oflacA,β-galactosidase (EC:3.2.1.23), over time (Table S3). The abundance oflacG, a 6-phospho-β -galac-tosidase (EC:3.2.1.85), showed lower values over time.
Impact of GOS onBifidobacteriumSpecies of the Human Gut Microbiome of Lactose-Intolerant Individuals. Increased abundance of Bifido-bacterium has been reported following prebiotic consumption (15, 16). Therefore,Bifidobacteriumspecies were quantified in stool samples from lactose-intolerant individuals who were clinically responsive to dietary intervention with GOS. Two hun-dred thirty-eight samples (of a total of 366), corresponding to 30 subjects at three time points (days 0, 36, and 66), were analyzed by high-throughput qPCR using specific 16S rRNA gene and GroEL probes. Data showed a significant increase at day 36 (Fig. 4) in the relative abundance of the phylum Actinobacteria (in-creased 25-fold on average in treatment samples), the family Bifidobacteriaceae (increased 14-fold), and the genus Bifido-bacterium(increased onefold on average) in stool samples from individuals consuming GOS as compared with controls (the levels in the same individuals at day 0). At day 66 the abun-dance of these taxa returned to baseline (day 0) levels.
Quantification of Bifidobacterium bifidum, Bifidobacterium longum, Bifidobacterium dentium, Bifidobacterium adolescentis, Bifidobacterium angulatum,Bifidobacterium catenulatum, Bifido-bacterium lactis,Bifidobacterium breve, andBifidobacterium gallicum
was carried out using species-specific 16S and GroEL primers (Fig. 5). The speciesB. longum (increased between 42- and 108-fold, according to data obtained with GroEL and 16S primers, re-spectively),B.adolescentis(increased between 45- and 8,212-fold), B.catenulatum(increased between 25 and 1,874-fold), andB.breve (increased an average of 46-fold detected by the GroEL probe) were significantly overrepresented at day 36 compared with day 0, whereas the abundance ofB.dentiumwas significantly higher at day 66. The abundance ofB.lactisandB.gallicumalso increased at day 36, but the changes did not reach statistical significance. A linear fit analysis was performed to assess the correlation between the 16S rRNA gene and GroEL primers for detection of the same Bifido-bacterium species. The analysis indicated a good correlation (Pearson’sr >0.70) for B. longum, B.adolescentis,B. bifidum, B. angulatum, and B.gallicum(Fig. S2); lower correlation in-dices (Pearson’s r <0.70) were observed for B. catenulatum, B.lactis,B.dentium, andB.breve(Table S4).
Correlations Between Changes in the Gut Microbiome and Clinical Findings.In this study, the longitudinal high-throughput qPCR analysis of samples showed a bifidogenic response in 90% (27/ 30) of treated individuals (Fig. S3A–D), with only three obvious nonresponders (Fig. S3E). Regarding a symptomatic response, 71% (25/35) of treated individuals reported alleviation of at least one symptom (pain, bloating, diarrhea, cramping, or flatulence) after GOS feeding at day 33, and 69% (24/35) reported symptom alleviation at day 66 when dairy was reintroduced into the diet (4). The three subjects who did not show a bifidogenic response were symptomatic responders. All symptomatic nonresponders demonstrated a bifidogenic response.
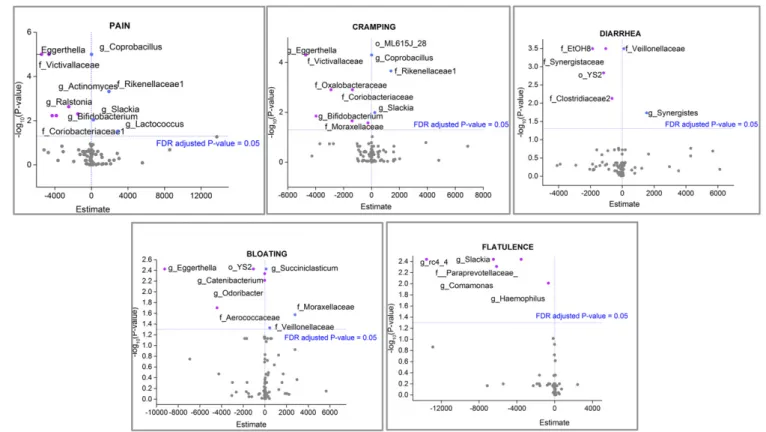
A repeated-measures logistic regression model was applied to identify positive or negative correlations between specific bac-teria and symptoms (Fig. 6). In this model the estimate values indicate how much the response (log odds of reporting each symptom) increases for a one-unit increase in the predictor (bacteria). Our data showed negative estimate values (indicating that an increase in the group was associated with a decreased likelihood of the symptom) for Bifidobacterium in association with pain and cramping outcomes, whereas positive estimates values were observed for Coprobacillus and the family Rick-enellaceae in association with the same symptoms. Fig. 6 shows all positive and negative correlations between bacterial occur-rences and reported symptoms.
Discussion
This study demonstrates modulation of the gut microbiome of lactose-intolerant individuals by GOS. The high-purity (>95%) prebiotic significantly modified the microbiome composition at day 36 (based on T-RFLP analysis) and further manifested sig-nificant alterations in diversity parameters (Shannon diversity index and species richness) after dairy was reintroduced into the
diet of lactose-intolerant participants. The clinical trial included subjects who consumed GOS but refrained from consuming dairy for 36 d, then stopped GOS consumption and reintroduced dairy into their diets for 30 additional days, until day 66. The changes in microbiome composition reported here included increases in lactose-fermenting Bifidobacterium, Lactobacillus, and Faecali-bacterium, and those changes correlated with an improvement of symptoms for lactose-intolerant subjects who were participating in the study (4). In this aligned clinical study, 50% of the subjects with abdominal pain at baseline reported no abdominal pain at the end of treatment with GOS (at day 36), and at 30 d post-treatment (at day 66) (P = 0.0190). Subjects fed GOS were also six times more likely to claim lactose tolerance post-treatment after dairy foods had been reintroduced into their diets (P=0.0389).
Our original hypothesis was that incremental GOS feeding would adapt the microbiome to beneficial lactose-fermenting bacteria that do not produce gas. Analysis of predictedβ -galac-tosidases showed incremental changes in the relative abundance ofebgA, an evolvedβ-galactosidase subunitα(EC:3.2.1.23), and lacA, β-galactosidase (EC:3.2.1.23), over time in response to GOS and dairy feeding, suggesting that such microbiome adap-tation occurred (Table S3). We also noted a decreased diversity in the microbiome of subjects when dairy was reintroduced to their diets (at day 66) after GOS-feeding was halted; this de-creased diversity could be associated with the inde-creased abun-dance of Bifidobacterium and Lactobacillus species and a concomitant increase in the intraluminal concentration of organic acids, including acetate, butyrate, and lactate (17). Moreover, a previous study showed that an animal-based diet (containing cheese products) had a greater impact on the gut microbiota than a plant-based diet consisting of grains, legumes, fruits, and vegetables (18), although the study reported no changes in α-diversity. A further decrease in microbiome diversity was noted in patients reporting cramping at day 66 compared with individuals not reporting that symptom at that time point. There are no reports in the literature of changes in diversity in correlation with abdominal cramping. No other symptom correlated with decreases in diversity. In our study, at least 11 microbial genera were impacted by GOS feeding, in contrast to a previous report (5) in which GOS feeding was reported to enhance bifidobacteria selectively without consistently increasing or decreasing other specific bac-terial lineages. We observed an increased abundance of Bifido-bacterium in response to GOS at day 36 that was confirmed by high-throughput qPCR using bifidobacterial-specific primers. B.longum,B.adolescentis, andB.catenulatumwere increased in response to GOS, as previously reported in vitro and in vivo (5). In addition, the relative abundances ofB.breveandB.dentium were significantly higher at day 36 and 66, respectively. B. lon-gum, B. adolescentis, B. catenulatum, and B. breve have been reported to encode more than one type of β-galactosidase, a Fig. 4. High-throughput qPCR determination of the relative abundance of Actinobacteria (Left), Bifidobacteriaceae (Center), andBifidobacterium(Right) at day 0 (pretreatment), day 36 (GOS consumption), and day 66 (GOS halted, dairy consumption encouraged). ANOVA analysis and Tukey tests were performed to identify statistically significant differences in relative abundance between time points. *P<0.05.
MICRO
BIOLOGY
PNAS
glycolytic enzyme essential for GOS metabolism that typically is genetically linked with a LacS permease responsible for trans-port and internalization of GOS (6). B. dentium has been less thoroughly characterized, is mostly associated with the oral cavity, and recently was shown to be increased in the stools of 100- to 108-y-old centenarians living in Bama, Guangxi (China) as compared with younger (80- to 99-y-old) elderly persons (19). In our study, the longitudinal analysis of a cohort of GOS-consuming individuals showed that 90% (27/30) had a bifido-genic response at day 36 and that three were clear nonre-sponders. These results significantly expand a previous report in which the bifidogenic response to GOS occurred in 50% of subjects fed a daily dose of 5 g/d (responders), whereas the other subjects were consistent nonresponders (5). Our study used GOS that was >95% pure for the oligosaccharide, with <5% con-tamination by glucose, galactose, and lactose.
Faecalibacterium, Lactobacillus, and taxa of the family Chris-tensenellaceae were among the taxa enhanced by GOS and a subsequent dairy diet. Strains of theLactobacillusgenus are widely acknowledged to be beneficial, and their properties have been reviewed extensively (20). Given their widespread association with a variety of different environments, including dairy, meat, vege-table, and grain-fermented foods and as commensals in the
gas-trointestinal tract, this genus has been widely consumed and also has been used in dietary supplements to promote general health and well-being (21–23). Recent human microbiome studies have identified Faecalibacterium prausnitzii as an organism with anti-inflammatory properties and have reported it to be an indicator microbial population that was lowered in subjects with Crohn’s disease and ulcerative colitis (10, 24). In addition to GOS, reported herein, Faecalibacterium also has been shown to be stimulated by the fructooligosaccharide inulin, and specific strains are reported to grow in host-derived substrates such asN -acetyl-glucosamine (25). Finally, the Christensenellaceae family was enhanced by GOS and dairy. This family has been reported to be enriched in persons who have a low BMI. One culturable member of this family,Christensenella minuta, was associated with reduced weight gain and altered the microbiome in mice (26).
With the reintroduction of dairy to the diet, the relative abundance of butyrate producers in the families Clostridiaceae and Lachnospiraceae and the genus Roseburia increased. The abundance of other Clostridia in the generaClostridium, Lach-nospira, Ruminococcus, Dialister, and Anaerotruncus actually decreased at day 36 and day 66, highlighting the diversity of the microbiome environment.
Regression analysis of data identified specific taxa positively or negatively correlated with symptoms.Bifidobacteriumshowed a negative correlation with cramping and pain. Interestingly, also showing a negative correlation with those symptoms was the family Victivallaceae, a taxon that contains one described spe-cies,Victivallis vadensis, originally known as“strain CelloT” be-cause it was isolated using cellobiose as a carbon source (27). Bacterial strains capable of metabolizing cellobiose are also capa-ble of metabolizing lactose. To our knowledge there are no reports of direct correlations between occurrences of specific bacteria and the likelihood of symptom outcome.
It is notable that many studies reported on GOS have used impure material that often comprises only∼50% GOS, with the remainder being monosaccharides (glucose and galactose) and lactose. In this study, highly purified GOS (>95% purity) was found to alter the microbiome of lactose-intolerant subjects significantly, and those changes correlated with positive symptom responses for lactose tolerance (4). GOS plus subsequent dairy consumption modulated a shift in the microbiome with increases in the relative abundance of proven beneficial microbes ( Lac-tobacillus,Bifidobacterium,Faecalibacterium, andRoseburia) and decreases in potentially detrimental taxa (Enterobacteriaceae) in the individuals who responded.
Materials and Methods
Experimental Design.An overview of the original study design has been reported previously (4). The study was a randomized, double-blind, parallel-group, placebo-controlled study conducted at two sites in the United States. The trial was approved by the Independent Investigational Review Board, Inc., Plantation, FL, on February 15, 2011, and the research was carried out in accordance with the clinical research practices defined in the Good Clinical Practice Guidelines of the International Conference on Harmonization. After
informed consent was obtained, 395 eligible subjects underwent screening assessments; of these, 85 were randomized (57 to RP-G28 and 28 placebo). In the randomized population, 42% were male with a mean age of 41 y and mean BMI of 27.1 (the ethnicity breakdown can be found inTable S5). There were no obvious differences in the two treatment groups. Participants had a self-reported history of dairy intolerance. Baseline lactose digestion was measured by hydrogen production via the HBT, and lactose-intolerance symptoms (abdominal pain, flatulence, cramping, bloating, and diarrhea) were measured via a patient-reported symptom-assessment Likert scale after a 25-g lactose challenge. Eligible subjects were required to demonstrate a minimum symptom score and a positive HBT to be eligible for randomiza-tion. Exclusion criteria included diabetes mellitus, GI motility disorders, irri-table bowel syndrome, inflammatory bowel diseases, celiac disease, and surgery that altered the normal function of the GI tract (4). During the clinical trial, participants avoided lactose in their diets and received esca-lating doses of high-purity (>95%) GOS or placebo (Sweetose) in 5-d incre-ments according to a fixed schedule from 1.5 g/d to 15 g/d. At day 36, treatment was stopped, and subjects were encouraged to consume lactose/ dairy until day 66. A total of 468 samples from 52 individuals (GOS and placebo) were collected. Measurements were taken at the end of treatment and 30-d posttreatment to evaluate changes in subjects’lactose digestion and symptoms from baseline.
DNA Isolation.Isolation of DNA and subsequent microbiome analyses were done at the University of North Carolina Microbiome Core Facility. The Microbiome Core is a University-approved recharge facility and Biosafety Level 2 laboratory. Total DNA isolation was carried out using the DNeasy Qiagen Blood and Tissue protocol (Qiagen). The Qiagen protocol was modified to ensure optimal isolation of DNA from Gram-positive bacteria. Briefly, 200 mg of sample were transferred to a microtube containing 0.2 g of autoclaved glass beads (11μm in diameter; Sigma) and 1.4 mL of ASL buffer (Qiagen). Next, samples were homogenized in a TissueLyser II instrument for 2 min at 25 Hz. Two hundred microliters of a lysozyme solution (200 mg/mL) were then added to the mix, which was incubated at 37 °C for 30 min fol-lowing steps performed according to the manufacturer’s protocol. Fig. 6. Volcano plots showing the−log10(Pvalue) (xaxis) versus estimate values (yaxis) of taxa significantly associated with specific symptoms. Estimate values indicate how much the response (log odds of reporting each symptom) increases with a one-unit increase in the predictor (bacteria). A positive es-timate value means an increase in the group was associated with an increased likelihood of outcome. A negative eses-timate value means an increase in the group was associated with a decreased likelihood of outcome. Significant estimate values (FDR-adjustedPvalue<0.05) are represented in pink (negative) and blue (positive).
MICRO
BIOLOGY
PNAS
samples per individual), 380 samples were successfully analyzed by T-RFLP as previously described (28). The individuals 081 and 092 were unable to pro-duce all nine samples, and samples were lacking from subjects 68, 73, 95, 102, 106, 115, and 118. Eighty samples failed despite several attempts. For further details, seeSI Materials and Methods.
16S rRNA Gene Amplicon Sequencing.Stool samples obtained in triplicate at three time points (days 0, 33, and 66) from 36 lactose-intolerant individuals consuming GOS were processed. In total, nine samples from each individual were analyzed by 16S rRNA amplicon pyrosequencing. A total of 18 samples did not yield enough reads and were discarded from subsequent analyses. Individual fecal samples were compared for microbiome changes in that subject from day 0 (prefeeding), at day 36 of GOS feeding, and at day 66, 33 d after the cessation of GOS feeding and the reintroduction of dairy into the diet. The study intentionally used each subject as his or her own control, comparing the microbiome changes occurring within each specific individual at each sampling time point.
Amplification and sequencing of the V1–V2 region of the bacterial 16S rRNA gene was performed on total DNA from collected samples (n=307) as previously described (29, 30). Briefly, reaction master mixes contained the Qiagen Hotstar HiFidelity Polymerase Kit (Qiagen) with a forward primer composed of the Roche Titanium Fusion Primer A (5′ -CCATCTCATCCCTGC-GTGTCTCCGACTCAG-3′), a 10-bp Multiplex Identifier (MID) sequence (Roche), and the universal bacterial primer 8F (5′ -AGAGTTTGATCCTGGCT-CAG-3′) (31). The reverse primer was composed of the Roche Titanium Primer B (5′-CCTATCCCCTGTGTGCCTTGGCAGTCTCAG-3′), the identical 10-bp MID sequence, and the reverse bacterial primer 338R (5′ -GCTGCCTCC-CGTAGGAGT-3′) (32). The 16S rRNA amplicons from the pooled sample were sequenced on a 454 Genome Sequencer FLX Titanium instrument (Roche) in the Microbiome Core Facility of the University of North Carolina at Chapel Hill using GS FLX Titanium XLR70 sequencing reagents and the corre-sponding protocols. Initial data analysis, base-pair calling, and trimming of each sequence to yield high-quality reads were performed by Research Computing at the University of North Carolina at Chapel Hill.
Sequencing Data Analysis.Bioinformatics analysis of 16S amplicon pyrose-quencing data were conducted using the Quantitative Insights Into Microbial Ecology (QIIME) v.1.8.0 software pipeline (33). The combined raw sequencing data were demultiplexed and filtered; all reads with lengths less than 200 bp and with a quality score below 25 were removed. After chimera (34) and singleton removal, sequences were clustered into OTUs at 97% similarity using UCLUST (35) and were aligned to build a phylogenetic tree (36). To ensure an even sampling depth, a random selection of 652 sequences from each sample was used for rarefaction analysis to measure alpha diversity using observed species (S) and phylogenetic diversity metrics on rarefied OTU tables. Eighteen samples had fewer than 652 reads per sample and were excluded from subsequent statistical analysis of differences in diversity and richness between groups. Beta diversity and PCoA also were calculated within QIIME using weighted and unweighted Unifrac distances (37)
be-ilarities between the samples.
PICRUSt Analysis of 16S rRNA Amplicon-Sequencing Data. PICRUSt (14), designed to deduce metagenomic information from 16S rRNA amplicon sequencing data, was applied to sequencing data using the default settings (version 0.9.1). The generated metagenomic tables then were entered into the Human Microbiome Project unified metabolic analysis network (HUMAnN) (38) pipeline (version 0.98) to sort individual genes into Kyoto Encyclopedia of Genes and Genomes (KEGG) pathways representing varying proportions of each imputed sample metagenome.
High-Throughput qPCR Detection of BifidobacteriumSpecies.We used the Fluidigm BioMark HD 192.24 Integrated Fluidics Chip (Fluidigm Corporation) for high-throughput qPCR experiments to detect specificBifidobacterium species genes, as previously described (39). (For further information, seeSI Materials and Methods.) Because of the depletion of DNA from a number of samples, a total of 238 samples including 30 subjects at three time points (days 0, 36, and 66) in triplicate were analyzed.
Statistical Analyses.We computed the distance matrix between OTUs using ANOSIM and PERMANOVA tests within QIIME to evaluate similarities or dissimilarities between groups. Pairedttests were used to identify significant differences in phylogenetic diversity and species richness (S) between the different time points, and the Wilcoxon signed-rank test was used to iden-tify significant differences in bacterial taxa and metagenome pathways between paired samples. All statistical analysis was performed in JMP Genomics 10.0 (SAS). Pvalues <0.05 were considered significant unless otherwise stated.
For high-throughput qPCR data, the relative proportion of Bifidobacte-riumspecies was computed based on the Livak method (40). Quantitation cycle (Cq) values for each sample were normalized against the Cq value for the universal primers. Fold differences in the differentBifidobacteriumspecies were calculated by the 2–ΔΔCtmethod. Pairedttests and ANOVA with Tukey tests were conducted to assess statistically significant differences between groups.
Finally, a repeated-measures logistic regression adjusted for sex with an autocorrelation structure for the within-subject correlation matrix was per-formed for each bacterial species and each condition (bloating, cramping, diarrhea, flatulence, and pain) to identify positive and negative correlations between specific bacteria and symptoms.“Day”was considered in the model as a continuous variable. All the resultingPvalues then were adjusted for multiple comparisons via the FDR method.
ACKNOWLEDGMENTS.This study was funded by Ritter Pharmaceuticals, Inc. and the North Carolina Agricultural Foundation. The Microbiome Core Facility and Advanced Analytics Core of the Medical School of the University of North Carolina at Chapel Hill are supported in part by NIH/National Institute of Diabetes and Digestive and Kidney Diseases Grant P30 DK34987.
1. Itan Y, Jones BL, Ingram CJ, Swallow DM, Thomas MG (2010) A worldwide correlation of lactase persistence phenotype and genotypes.BMC Evol Biol10:36.
2. Scrimshaw NS, Murray EB (1988) The acceptability of milk and milk products in populations with a high prevalence of lactose intolerance.Am J Clin Nutr48(4, Suppl): 1079–1159.
3. Hertzler SR, Savaiano DA, Levitt MD (1997) Fecal hydrogen production and con-sumption measurements. Response to daily lactose ingestion by lactose maldigesters.
Dig Dis Sci42(2):348–353.
4. Savaiano DA, et al. (2013) Improving lactose digestion and symptoms of lactose in-tolerance with a novel galacto-oligosaccharide (RP-G28): A randomized, double-blind clinical trial.Nutr J12:160.
5. Davis LM, Martínez I, Walter J, Goin C, Hutkins RW (2011) Barcoded pyrosequencing reveals that consumption of galactooligosaccharides results in a highly specific bifi-dogenic response in humans.PLoS One6(9):e25200.
6. Andersen JM, et al. (2011) Transcriptional and functional analysis of galactooligosaccharide uptake by lacS in Lactobacillus acidophilus.Proc Natl Acad Sci USA108(43):17785–17790. 7. Qin J, et al.; MetaHIT Consortium (2010) A human gut microbial gene catalogue
es-tablished by metagenomic sequencing.Nature464(7285):59–65.
8. Sim K, et al. (2012) Improved detection of bifidobacteria with optimised 16S rRNA-gene based pyrosequencing.PLoS One7(3):e32543.
9. Sokol H, et al. (2008) Faecalibacterium prausnitzii is an anti-inflammatory commensal bacterium identified by gut microbiota analysis of Crohn disease patients.Proc Natl Acad Sci USA105(43):16731–16736.
10. Hansen R, et al. (2012) Microbiota of de-novo pediatric IBD: Increased Faecalibacte-rium prausnitzii and reduced bacterial diversity in Crohn’s but not in ulcerative colitis.
Am J Gastroenterol107(12):1913–1922.
11. Kostic AD, et al. (2012) Genomic analysis identifies association of Fusobacterium with colorectal carcinoma.Genome Res22(2):292–298.
12. Castellarin M, et al. (2012) Fusobacterium nucleatum infection is prevalent in human colorectal carcinoma.Genome Res22(2):299–306.
13. McCoy AN, et al. (2013) Fusobacterium is associated with colorectal adenomas.PLoS One8(1):e53653.
14. Langille MG, et al. (2013) Predictive functional profiling of microbial communities using 16S rRNA marker gene sequences.Nat Biotechnol31(9):814–821.
15. Tzortzis G, Goulas AK, Baillon ML, Gibson GR, Rastall RA (2004) In vitro evaluation of the fermentation properties of galactooligosaccharides synthesised by alpha-galac-tosidase from Lactobacillus reuteri.Appl Microbiol Biotechnol64(1):106–111. 16. Vulevic J, Drakoularakou A, Yaqoob P, Tzortzis G, Gibson GR (2008) Modulation of the
fecal microflora profile and immune function by a novel trans-galactooligosaccharide mixture (B-GOS) in healthy elderly volunteers.Am J Clin Nutr88(5):1438–1446. 17. Daly K, et al. (2014) Dietary supplementation with lactose or artificial sweetener
enhances swine gut Lactobacillus population abundance.Br J Nutr111(Suppl 1): S30–S35.
18. David LA, et al. (2014) Diet rapidly and reproducibly alters the human gut micro-biome.Nature505(7484):559–563.
19. Wang F, et al. (2015) Qualitative and semiquantitative analysis of fecal Bifidobacte-rium species in centenarians living in Bama, Guangxi, China.Curr Microbiol71(1): 143–149.
21. Azcárate-Peril MA, Sikes M, Bruno-Bárcena JM (2011) The intestinal microbiota, gas-trointestinal environment and colorectal cancer: A putative role for probiotics in pre-vention of colorectal cancer?Am J Physiol Gastrointest Liver Physiol301(3):G401–G424. 22. King S, Glanville J, Sanders ME, Fitzgerald A, Varley D (2014) Effectiveness of pro-biotics on the duration of illness in healthy children and adults who develop common acute respiratory infectious conditions: A systematic review and meta-analysis.Br J Nutr112(1):41–54.
23. Petrova MI, Lievens E, Malik S, Imholz N, Lebeer S (2015) Lactobacillus species as biomarkers and agents that can promote various aspects of vaginal health.Front Physiol6:81.
24. Machiels K, et al. (2014) A decrease of the butyrate-producing species Roseburia hominis and Faecalibacterium prausnitzii defines dysbiosis in patients with ulcerative colitis.Gut63(8):1275–1283.
25. Lopez-Siles M, et al. (2012) Cultured representatives of two major phylogroups of human colonic Faecalibacterium prausnitzii can utilize pectin, uronic acids, and host-derived substrates for growth.Appl Environ Microbiol78(2):420–428.
26. Goodrich JK, et al. (2014) Human genetics shape the gut microbiome.Cell159(4): 789–799.
27. Zoetendal EG, Plugge CM, Akkermans AD, de Vos WM (2003) Victivallis vadensis gen. nov., sp. nov., a sugar-fermenting anaerobe from human faeces.Int J Syst Evol Microbiol53(Pt 1):211–215.
28. Azcarate-Peril MA, et al. (2011) Acute necrotizing enterocolitis of preterm piglets is characterized by dysbiosis of ileal mucosa-associated bacteria.Gut Microbes2(4): 234–243.
29. Devine AA, et al. (2013) Impact of ileocecal resection and concomitant antibiotics on the microbiome of the murine jejunum and colon.PLoS One8(8):e73140. 30. Thompson AL, Monteagudo-Mera A, Cadenas MB, Lampl ML, Azcarate-Peril MA
(2015) Milk- and solid-feeding practices and daycare attendance are associated with differences in bacterial diversity, predominant communities, and metabolic and im-mune function of the infant gut microbiome.Front Cell Infect Microbiol5:3. 31. Edwards U, Rogall T, Blöcker H, Emde M, Böttger EC (1989) Isolation and direct
complete nucleotide determination of entire genes. Characterization of a gene coding for 16S ribosomal RNA.Nucleic Acids Res17(19):7843–7853.
32. Fierer N, Hamady M, Lauber CL, Knight R (2008) The influence of sex, handedness, and washing on the diversity of hand surface bacteria.Proc Natl Acad Sci USA105(46): 17994–17999.
33. Caporaso JG, et al. (2010) QIIME allows analysis of high-throughput community se-quencing data.Nat Methods7(5):335–336.
34. Haas BJ, et al.; Human Microbiome Consortium (2011) Chimeric 16S rRNA sequence formation and detection in Sanger and 454-pyrosequenced PCR amplicons.Genome Res21(3):494–504.
35. Edgar RC (2010) Search and clustering orders of magnitude faster than BLAST.
Bioinformatics26(19):2460–2461.
36. Price MN, Dehal PS, Arkin AP (2010) FastTree 2–approximately maximum-likelihood trees for large alignments.PLoS One5(3):e9490.
37. Lozupone C, Hamady M, Knight R (2006) UniFrac–an online tool for comparing mi-crobial community diversity in a phylogenetic context.BMC Bioinformatics7:371. 38. Abubucker S, et al. (2012) Metabolic reconstruction for metagenomic data and its
application to the human microbiome.PLOS Comput Biol8(6):e1002358. 39. Monteagudo-Mera A, et al. (2016) High purity galacto-oligosaccharides enhance
specific Bifidobacterium species and their metabolic activity in the mouse gut mi-crobiome.Benef Microbes7(2):247–264.
40. Livak KJ, Schmittgen TD (2001) Analysis of relative gene expression data using real-time quantitative PCR and the 2(-Delta Delta C(T)) Method.Methods25(4):402–408. 41. Kent AD, Smith DJ, Benson BJ, Triplett EW (2003) Web-based phylogenetic assign-ment tool for analysis of terminal restriction fragassign-ment length polymorphism profiles of microbial communities.Appl Environ Microbiol69(11):6768–6776.
42. Johnson MC, Devine AA, Ellis JC, Grunden AM, Fellner V (2009) Effects of antibiotics and oil on microbial profiles and fermentation in mixed cultures of ruminal micro-organisms.J Dairy Sci92(9):4467–4480.
43. Li F, Hullar MA, Lampe JW (2007) Optimization of terminal restriction fragment polymorphism (TRFLP) analysis of human gut microbiota.J Microbiol Methods68(2): 303–311.
44. Osborne CA, Rees GN, Bernstein Y, Janssen PH (2006) New threshold and confidence estimates for terminal restriction fragment length polymorphism analysis of complex bacterial communities.Appl Environ Microbiol72(2):1270–1278.
45. Junick J, Blaut M (2012) Quantification of human fecal bifidobacterium species by use of quantitative real-time PCR analysis targeting the groEL gene.Appl Environ Microbiol78(8):2613–2622.
46. Matsuki T, et al. (2004) Quantitative PCR with 16S rRNA-gene-targeted species-specific primers for analysis of human intestinal bifidobacteria.Appl Environ Microbiol70(1): 167–173.
47. Hermann-Bank ML, Skovgaard K, Stockmarr A, Larsen N, Molbak L (2013) The Gut Microbiotassay: A high-throughput qPCR approach combinable with next generation sequencing to study gut microbial diversity.BMC Genomics14:788.
48. Kwon H-S, et al. (2006) Rapid identification of potentially probiotic Bifidobacterium species by multiplex PCR using species-specific primers based on the region extending from 16S rRNA through 23 S rRNA.FEMS Microbiol Lett250(1):55–62.
MICRO
BIOLOGY
PNAS