I
t’s common to hear praise for concentration limits as an important portfolio manage-ment tool. It’s equally common, however, for enforcement of port-folio limits to fall prey to political and budgetary pressures. The challenge of today’s portfolio man-ager is to create a portfolio limit system that is at once both effec-tive in protecting the institution from single credit events and practical in its enforcement.Setting limits isn’t a one-size-fits-all process. Individual consid-erations include:
• The size and nature of the institution.
• Strategy.
• Credit appetite.
• Competitive advantages.
• Systems.
• The existing level of portfolio diversification.
Many banks have expertise in certain sectors or regions that may justify extra concentration of risk. It is worth noting that, diversifica-tion for the sake of diversificadiversifica-tion, particularly in areas where an institution has little expertise, may actually add to risk rather than reduce it.
Healthy, effective limit sys-tems are designed to flag pockets of vulnerability. They create a framework for discussions among Risk Management, the origination groups, and Portfolio Manage-ment. In doing so, they are a key part of a culture that directs the day-to-day activities of an institu-tion around return and risk opti-mization.
Many types of limits are avail-able for a given portfolio of credit exposures. Limits can be set by product, asset class, business lines, ratings, geography, industry, lending office, origination group, obligor, or duration, just to name a few. The appropriate combination of limits depends on the number of business lines, the size and geographic spread, the sophistica-tion of management and staff, the robustness of the systems, and the complexity of product offerings and activities.
There is no one ideal limit system, but since the objective is to manage credit exposure in a way that affords protection against a single credit event, the system should at least be able to report and monitor the credit
Establishing Exposure
Limits for a Credit Portfolio
by James V. Lentino
A
ctive management of concentration is a key objective of
any credit portfolio management effort. This article
out-lines a sound but practical portfolio limit framework that
allows an institution to manage concentration risk yet position itself
to respond quickly to market changes.
portfolio by obligor, industry, and region. This is in line with the minimum information that rating agencies require to evaluate such portfolio structures as CLOs (col-lateralized loan obligations) and CBOs (collateralized bond obliga-tions): issuer concentrations, industry concentrations, and regional or country concentra-tions. Follow-up servicing reports to investors also use such infor-mation to report on the perform-ance of the portfolios. Limits and triggers are often placed on the asset pool in terms of maximum limits for a single obligor and maximum concentration by sector or region. Hedge funds and prime funds also manage themselves within similar limits.
Some corporate finance pro-fessionals would argue that an institution receives no benefit in its share price from diversifying activities because investors are able to diversify on their own. However, many others believe that increasing the number of obligors in any pool diversifies credit risk and reduces the volatil-ity associated with an earnings stream, which, in turn, leads to a higher valuation multiple.
Standard & Poor’s observes that although diversification by sector is beneficial, there is a diminishing marginal benefit to diversifying a portfolio by indus-try. Although S&P tracks expo-sures by 39 industry categories, it assumes that a pool of assets dis-tributed over as few as 13 indus-tries (that is, no sector accounting for more than 8% of assets) is fair-ly diversified. In rating a CLO, ratings agencies will notch a rating down for each obligor in the
sec-tor to the degree by which the sector exceeds the 8% guideline.
It is important to recognize that an institution limited by geography, strategy, or expertise does not always have natural opportunities for diversification. This again highlights the impor-tance of aligning the portfolio management mandate and the limit system with the strategy of the bank.
Loan Equivalent Exposures When an institution sets portfolio limits, it is ultimately trying to manage notional expo-sure. Nevertheless, the vagaries and customization that are avail-able around the credit product make it difficult to compare notional exposure across obligors, sectors, and regions. A $100 mil-lion exposure to a AAA-rated entity is not equivalent to a $100 million exposure to a BB-rated entity; similarly, an unsecured facility to a single-B obligor is not viewed in the same way as a secured obligation in the same amount to another single-B enti-ty. The question is further com-plicated by the increasing num-ber of derivatives products that are available. A $10 million notional interest rate swap with a counterparty does not represent the same risk as a $10 million funded loan to the same counter-party.
If institutions were to build a limit system exclusively around notional limits, the wide variety of credit products and their combi-nations would require an endless number of notional limit combina-tions. It would be necessary to set limits based on region; within region, by borrower; within bor-rower, by rating; within rating, by product type; within product type, by tenor; within tenor, by collater-al type; within collatercollater-al type, by collateral amount; and so forth. Such a system would be unman-ageable and, more important, would be too complicated to be meaningful. Thus, many institu-tions have developed the concept of a loan equivalent exposure. A robust economic capital (EC) and risk-rating system allows an insti-tution to convert the endless vari-ety of ratings, regions, product types, tenors, and collateral types into a single metric; this metric then allows comparisons across exposure types, regions, and busi-ness lines.
A limit system based on eco-nomic capital accommodates a wide variety of exposure types and forms a simple and sound basis for a limit system. As a loan equivalent measure, EC captures many drivers of risk in a single metric. This allows the institution to simplify its limit system and create a single framework for limit setting, capital allocation, and
per-A
L I M I T S Y S T E M B A S E D O N E C O N O M I C C A P I TA L A C C O M M O D AT E S A W I D E VA R I E T Y O F E X P O S U R E T Y P E S A N D F O R M S A S I M P L E A N D S O U N D B A S I S F O R A L I M I Tformance measurement based on risk-adjusted economics. For example, a $300 million unse-cured exposure to a BBB-rated borrower might imply $10 million of EC. That same $10 million of EC would imply a much larger acceptable notional exposure for a one-year facility to a AAA-rated borrower. It would also imply a much lower level of acceptable exposure to a B-rated borrower. Similarly, for a given tenor, that same $10 million of EC might imply one level of notional expo-sure for an unsecured BB-rated borrower but would accommodate somewhat higher exposure for a secured borrower of the same rat-ing and tenor.
Figure 1 highlights such dif-ferences at the industry level as well. Although the financial insti-tutions sector in the sample port-folio represents the largest per-centage of limits, it contributes relatively less in terms of risk to the portfolio as measured by EC.
The utilities sector in this portfo-lio, however, represents a modest percentage of total limits, but it contributes a higher-than-average percentage of risk for the portfolio as evidenced by its high percent-age of the portfolio’s total EC.
Setting Limit Levels
An effective limit system sets limits around EC at three differ-ent levels of the portfolio.
1. A limit is set on the overall EC level consumed by the credit portfolio. This is a very top-down type of limit and is typically set as part of the capital allocation process.
2. Further limits are set at the sector or regional level. For example, an institution may determine that it does not want the EC for any one industry sector or region to exceed a certain dollar amount or a certain percent-age—for example, 8%—of the overall EC for the firm.
3. A limit is set at the single obligor level so that the EC from any single relationship group does not exceed more than a certain dollar amount of EC and the EC from any single relationship group does not exceed a certain percent-age of the firm’s overall EC. A common approach to limits is to set them as a percentage of capital, with a variety of defini-tions available for capital—for example, Tier 1 capital, Tier 2 capital, regulatory capital, market capitalization, or EC. Such limits typically are set with the idea that an institution is willing to bear losses only to a point where its capital is not impaired. For exam-ple, banking regulators often limit exposure for U.S. banks based on some maximum percentage of capital. These legal lending limits vary by state but typically range between 15-25% of book capital.
In theory, this is a sound basis for limit setting. In practice, how-ever, an institution may find that the threshold of pain comes much earlier than the point at which a firm’s capital position is in jeop-ardy. Typically, bonus pools, per-formance metrics, and future employment imply a much lower acceptable loss limit than a capi-tal-based system would imply. Accordingly, in setting limits, some work should be done to evaluate the board’s loss toler-ance, which may be lower than levels implied by more traditional capital-based limits.
It also should be noted that organizations do not “lose” EC. They lose notional exposure. In managing a limit system based on EC, we do not manage the EC Agriculture % of Total Automotive Capital Goods Chemicals Construction Consumer Durables Diversified
Moving Consumer Goods Financial Institutions
HealthLeisureMedia Mining & Metals
Oil & GasReal Estate
Retail /
WholesaleServicesTechnologyTelecomTransport
Transportation Equipment Utilities Industry 14% 12% 10% 8% 6% 4% 2% 0% Figure 1
Economic Capital versus Notional Limits
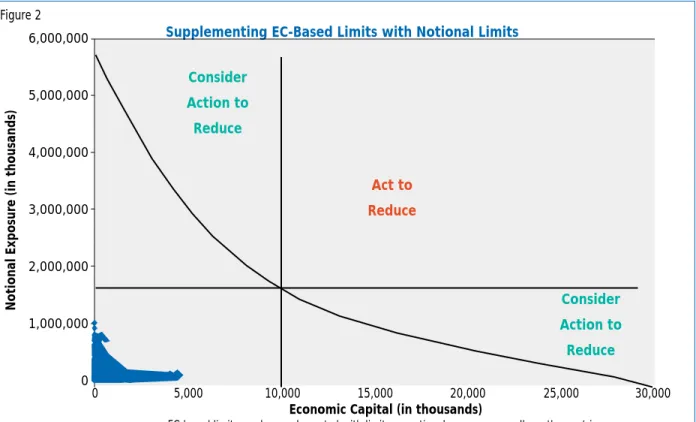
number, per se; we must be equally cognizant of the notional exposure that forms the basis for the EC calculation. For this rea-son, many institutions supplement EC-based limits with some form of notional limits—for example, the exposure to a single borrower should not exceed the lesser of $10 million of EC or $2 billion of notional exposure. Supplementing the EC-based system with a notional limit provides some pro-tection against model risk in cases where model-related issues or improper risk coding incorrectly captures the risk that a particular asset contributes to the portfolio. Figure 2 provides an example of a limit system in which EC limits are supplemented with notional limits.
Other Metrics
Other metrics also are available
to measure and monitor concentra-tions in a portfolio. Limits around EC and notional limits can be sup-plemented by limits around these other metrics, which include the concentration ratio (CR) and the so-called Herfindahl-Hirschman Index, or HHI. The U.S. Department of Justice uses both the CR and the HHI to evaluate concentrations within an industry whenever they measure market share implications of corporate mergers. These ratios can be adapt-ed for use in evaluating concentra-tion in a credit portfolio as well.
The CR in the context of a credit portfolio can refer to the sum of the concentrations of the largest four industries in the port-folio and can be expressed as:
CR = C1+ C2+ C3+ C4
where Ci= the notional exposure or EC tied up in a single sector as
a percentage of total notional exposure or EC in the portfolio.
If the CR were close to zero, it would be an indicator that there is very little concentration in the portfolio. While each firm can set its own target concentration ratio, 40% is often used as the dividing line as to whether concentration exists in a portfolio.
The HHI is a similar concept, but it squares the concentration percentages of each sector to place more weight on the larger concentrations. The calculation includes all of the sectors in the portfolio and not just the top four sectors. The HHI can be
expressed as:
HHIi= C12+ C
22+ C32+ . . . Cn2
where Ci= the notional exposure or EC tied up in a single sector as a percentage of total notional exposure or EC in the portfolio.
Figure 2
Supplementing EC-Based Limits with Notional Limits Consider Action to Reduce Consider Action to Reduce Act to Reduce 6,000,000 5,000,000 4,000,000 3,000,000 2,000,000 1,000,000 0 Notional Exposur e (in thousands) 0 5,000 10,000 15,000 20,000 25,000 30,000
Economic Capital (in thousands)
EC-based limits can be supplemented with limits on notional exposure as well as other metrics. ◆ ◆ ◆ ◆ ◆ ◆ ◆◆ ◆ ◆ ◆ ◆ ◆ ◆ ◆ ◆ ◆◆ ◆ ◆ ◆ ◆ ◆ ◆ ◆◆◆◆◆◆◆ ◆◆◆◆◆◆ ◆ ◆◆◆◆ ◆ ◆ ◆◆ ◆ ◆ ◆ ◆ ◆◆ ◆ ◆ ◆ ◆ ◆ ◆ ◆◆◆◆◆◆ ◆ ◆◆◆◆◆ ◆ ◆◆◆ ◆◆ ◆◆◆◆◆◆◆◆◆◆◆◆◆◆◆ ◆◆◆◆ ◆◆◆◆◆◆◆◆◆◆◆◆◆◆ ◆◆ ◆ ◆ ◆ ◆◆ ◆◆ ◆ ◆ ◆ ◆ ◆ ◆ ◆ ◆ ◆ ◆ ◆◆ ◆ ◆◆ ◆ ◆◆
The highest possible HHI is 10,000, which assumes that a sin-gle sector represents 100% of the portfolio. The HHI can be extreme on the low end, depend-ing on the number of sectors and the sizes of the concentration per-centages. Typically, an HHI of less than 1,000 would be consid-ered a relatively unconcentrated portfolio, while a ratio above 1,800 would be considered a highly con-centrated portfolio.
Ratios such as the CR and the HHI can be measured and moni-tored for a portfolio over time. They provide insight into the movement of concentrations with-in the portfolio. Limits can be set around these ratios. They also can be used to measure the effective-ness of the PM function in man-aging concentration in a portfolio.
Markets-based approach.
Yet another approach to setting limits is what could be considered a markets-based approach. It is possible to look at all debt issued in the market by sector. An insti-tution can then set a policy under which it will not hold any more in a sector than the market is hold-ing. For example, if telecom-relat-ed exposure represents 25% of issuance in the population of
bonds available in the market, a bank would set its telecom limit at no more than 25% of its own book. This is a more difficult poli-cy to maintain. Such an approach would require the creation of a broad index of issuance across investment grade and non-invest-ment-grade issues. Such informa-tion is not always readily avail-able.
Governance and Approval of Exceptions
Regardless of the limit struc-ture employed, governance around the limit system is essen-tial to its effectiveness in helping an organization manage concentra-tions. In most organizations, a sep-aration of powers should exist between those that are setting the limits and those that are account-able for managing the portfolio within the limits. It would be inappropriate for a portfolio man-agement function to set its own limits for the portfolio and approve excesses to those limits without oversight.
In a typical organization, Risk Management could serve in the role of setting portfolio limits. The mandate of Portfolio Management would be to work
with the business to manage the portfolio within the limits set by Risk. Any exceptions to the limits would then be approved by a sep-arate function. For example, the approving body could be Risk Management or even the board of directors directly in those cases where Portfolio Management is housed within the Risk
Management structure. A governance structure around the limit system should incorporate an appropriate separa-tion of duties in which one party, such as the Risk Department, sets the portfolio limits, and another party, such as Credit Portfolio Management, is responsible for managing the portfolio within the limits. The behavior of most insti-tutions indicates that portfolio management groups typically view limits as a management dis-cussion tool rather than a trading rule. In a 2004 survey of portfolio managers conducted by the International Association of Credit Portfolio Managers (IACPM), 47% of respondents indicated that limit excesses are only “occasion-ally” eliminated through sale or hedging. Another 29% indicated they “usually” eliminate through sale or hedge, while only 6% indi-cated limit excesses are “always” eliminated through sale or hedge.
The sound practice therefore appears to be viewing limits more as thresholds rather than hard lim-its that must be executed at any cost. A system that prompts an active dialogue between the appropriate stakeholders to achieve an appropriate action plan for the institution in light of its strategy and objectives will, in the long run, be more effective. A
dra-A
G O V E R N A N C E S T R U C T U R E A R O U N D T H E L I M I T S Y S T E M S H O U L D I N C O R P O R AT E A N A P P R O P R I AT E S E PA R AT I O N O F D U T I E S I N W H I C H O N E PA R T Y, S U C H A S T H ERI S K
D E PA R T M E N T, S E T S T H E P O R T F O L I O L I M I T S,
A N D A N O T H-E R PA R T Y, S U C H A SC
R E D I TP
O R T F O L I OMA N A G E M E N T,
I S R E S P O N S I B L E F O R M A N A G I N G T H E P O R T F O L I O W I T H I N T H E L I M I T S.
conian approach to exposure man-agement can lead to frustration within the institution.
Once the EC for a borrower, sector, or region exceeds its limit, there should be no automatic hedging or disposal of exposure for that client, sector, or region. Instead, the breach of an EC based guideline should prompt the appropriate discussion between Risk, Portfolio Management, the origination group, and if necessary, the board as to the nature of the underlying exposure, what it consists of, the accuracy of the data inputs behind the EC number, and the outlook for the obligor, region, or sector. The governance structure should outline and facilitate the manner in which such discussions take place. These discussions about limit excesses can show whether the institution is comfortable with the existing level of exposure or if an action plan is required that will identify steps to bring exposure down and over what time frame.
The danger of such “thresh-old and discussion” approaches is that corrective action around con-centrations is often discussed but never takes place. While dracon-ian management of limit systems is not realistic, if an organization never takes action on limits, the tool loses credibility in the eyes of the line, Risk Management, shareholders, and regulators. Whether positioned in the public side of the wall or on the private side, the group responsible for managing the limits must have the authority and the infrastruc-ture to execute this mandate. This implies, within reason, the appropriate control over the
assets, the appropriate incentives, the appropriate budget, and the appropriate skills set.
Moving Forward
As the portfolio management mandate evolves in an organiza-tion, the discussions around the management of concentrations also can evolve—from simple standard percentages, such as no more than 8% in a particular industry sector, to a more dynamic system of overweighting and underweighting signals around the standard 8% concentration limit. For example, if 8% is the baseline limit, discussions between Risk, the origination group, and Portfolio Management may lead to a consensus that a combination of positive credit outlooks, favorable market condi-tions, and above-average returns and cross-sell in a sector warrant a more aggressive marketing approach in a particular sector to take advantage of favorable condi-tions. The stakeholders may agree to an overweight position of 10-12% for a particular sector. Other sectors, where perhaps the credit outlook is not as favorable or the returns and cross-sell opportuni-ties have not been forthcoming, may be moved to an underweight status and the constituents may agree to reduce or limit exposure in the sector to no more than 5-6% of the portfolio. By having an infrastructure and governance model that facilitates such dia-logue at regular intervals, an organization is better able to posi-tion its portfolio properly to take advantage of conditions as they evolve in the market. Proactively repositioning the portfolio in this
way should lead to better opti-mization and allocation of the scarce capital resource to those sectors or names that promise the best risk/return evolution.
Active management of port-folio concentrations can be an effective tool. While political pressures often will be severe, a concentration limit system that is disciplined but flexible enough to facilitate dialogue between Risk, the origination group, and Portfolio Management is state-of-the-art portfolio management. An institution that uses this strategy will be better able to take advan-tage of market conditions as they evolve. ❏
Contact Jim Lentino by e-mail at [email protected]. Resources
Diez-Canedo, Javier Marquez, and Castanon, Calixto Lopez, “Concentration Risk in a Bank Loan Portfolio: Measurement, Single Obligor Limits, and Capital Adequacy,” September 1999, www.banxico.org.mx/gPublicaciones/DocumentosI nvestigacion/docinves/doc9902/doc9902.pdf “Global CBO/CLO Criteria,” Standard & Poor’s Structured Finance, a Division of the McGraw-Hill Companies, New York, 1999.
“Industry Concentration,” Quick MBA Economics, www.quickmba.com/econ/micro/indcon.shtml. “A Widget Example of the Herfindahl-Hirschman Index,” Federal Reserve Bank of Minneapolis, January 2000,
http://minneapolisfed.org/pubs/fedgaz/00-01/ HHI.cfm.
“The Herfindahl-Hirschman Index,” U.S. Department of Justice,