Complex Systems Informatics and Modeling Quarterly (CSIMQ) eISSN: 2255-9922
Published online by RTU Press, https://csimq-journals.rtu.lv Article 134, Issue 23, June/July 2020, Pages 23–43
https://doi.org/10.7250/csimq.2020-23.03
Analytics-Enabled Adaptive Business Architecture Modeling
Shreya Srinivas1*, Asif Qumer Gill1, and Terry Roach2
1 School of Computer Science, University of Technology Sydney, 15 Broadway,
Ultimo NSW 2007 Australia
2 Capsifi, 61 York St, Sydney 2000, Australia
[email protected], [email protected], [email protected]
Abstract. In a changing competitive business landscape, organizations are challenged by traditional processes and static document-driven business architecture models or artifacts. This marks the need for a more adaptive and analytics-enabled approach to business architecture. This article proposes a framework for adaptive business architecture modeling to address this critical concern. This research is conducted in an Australian business architecture organization using the action design research (ADR) method. The applicability of the proposed approach was demonstrated through its use in a health insurance business architecture case study using the Tableau and Jalapeno business architecture modeling platform. The proposed approach seems feasible to process business architecture data for generating essential insights and actions for adaptation.
Keywords: Enterprise Architecture, Business Architecture, Analytics, Data Gap Analysis, Adaptive Architecture.
1
Introduction
Enterprise Architecture (EA) is an important discipline for handling organizational design and its underlying complexity [1]. It helps to address the alignment and integration of business and IT [1], [2] through strategy to execution [3] for enabling business value [2]. In particular, EA is a way to take an organization from a high-level strategy to execution, and also provides oversight and governance of their program of works [4].
Several frameworks have been proposed and evolved, which can be used to establish and run an EA practice [5]. For instance, TOGAF and Zachman frameworks have been around for a long time and cover both the EA method and ontology aspects. TOGAF seems to provide an end-to-end architecture development method (ADM) covering architecture planning, design, execution and governance phases. It offers different views to document different EA domains and layers. The Zachman framework provides an ontology, which may guide documenting different architecture views at different levels of abstractions ranging from contextual to operational architecture views.
* Corresponding author
© 2020 Shreya Srinivas et al. This is an open access article licensed under the Creative Commons Attribution License (http://creativecommons.org/licenses/by/4.0).
24 A typical EA consists of four architectural domains: Business Architecture, Data Architecture, Application Architecture and Technology Architecture [6]. Business Architecture (BA) is an evolving domain of EA that has generated significant interest among the community for its effectiveness in business capability-based planning [7]. BA provides a well-rounded view of a business by using standardized artifacts [7] to align the business strategy, governance, organizations and critical business processes [6].
Both TOGAF and Zachman are process and documentation driven frameworks [8]. The artifacts generated from these processes and ontologies, tend to be static and consequently slow in responding to changing stakeholder needs and business environments [5]. Static documentation-driven BA artifacts become outdated over time due to their inability to evolve with the changing business needs and operating environments. Thus, there is an urgent need for a shift from a static document-driven approach to a more flexible and “data” driven approach [9].
Analytics in recent times, specifically business analytics, seems to aid key business stakeholders in making evidence-based decisions. Thus, researchers and practitioners are taking an interest in using analytics to model and infer basic patterns and relationships in data for generating valuable insights and actions for adaptation. This brings us to the need for researching the possible use of business analytics to enable adaptability in BA.
However, the challenge is how to do so? This draws our attention to the following research question: How to enable adaptability in business architecture using business analytics?
This article aims to address this research question and proposes to change the current traditional document-heavy ways of BA modeling. This article focuses on one area of BA modeling (capability modeling) for simplicity. It also provides a step by step approach to implementing adaptability in BA capability maps or models using analytics. This research is timely and relevant to academia and practice within the current context of the digital ecosystem for business innovation and transformation [10], [11]. It is also crucial because it enhances our current knowledge and understanding of the intersection of business analytics and BA by providing a research-based practical approach to implementing business analytics techniques in adaptive BA modeling.
From a practice perspective, UTS (University of Technology Sydney) and Capsifi (our industry partner) were involved in a joint research project in 2018. The scope was to define the proposed analytics-enabled approach to adaptive BA modeling. This practice-driven research need was addressed by an action design research (ADR) method [12], [13] employed in collaboration with UTS, a university and research provider in Sydney, Australia, and Capsifi, a BA specialist industry research partner based in Sydney, Australia.
The structure of this article is as follows: Section 2 provides the research background and motivation. Section 3 describes the ADR research method and data collection. Section 4 presents the adaptive BA approach enabled by business analytics. Section 5 demonstrates the application of the proposed approach with the help of a case study example. Section 6 concludes the findings and provides directions for future work.
2
Research Background and Motivation
2.1 EnterpriseArchitectureEA is defined as the continuous process of planning and designing a holistic view of an enterprise. It focuses on converting business strategy into an executable architecture design for implementation planning and governance [4], [14]. The goal of an EA is to allow organizations to continually remain competitive and adaptable in the business ecosystem [14]. Conventionally, organizations adopt EA for the following use cases [4]:
25 • The business value of IT: Using EA for integrating enterprise siloes for effective communication and coordination of investments in technology for business-IT alignment [4], [7].
• Information accuracy and integrity: Using EA to ensure information accuracy and completeness between the different enterprise layers, as indicated in Figure 1 [4].
• Security architecture: Using EA to address security (including privacy and ethics) as an overarching concern for ensuring confidentiality, integrity and availability of assets across the enterprise [4].
• Enterprise governance: Implementing EA provides an accountability framework for bringing business strategies to operational fruition [4].
EA comprises several domains or layers as seen in Figure 1. For instance, the BA domain consists of several models or views such as business motivation model, business model canvas and business capability model. A business capability model is critical to BA, which provides the anchor model to overlay other architecture models and elements (e.g. data, technology). A capability defines the ability of an organization to achieve an outcome. A capability is composed of four key elements (PPIT): People, Process, Information and Technology [15], [16]. Data or information architecture is another domain, which is used to address the critical data or information management concerns of an organization. Having a clear data architecture in alignment with the business capability map will provide a structured approach to data handling across the enterprise [17]. Application architecture is essential to model the applications that are required to support the business and data architecture. Technology architecture provides the blueprint of a technology landscape, including virtual and physical technology platforms and infrastructure across the enterprise to host and support the applications [17]. Figure 1 presents a concise view of the four main domains of the EA.
Figure 1. Enterprise Architecture Layers [6]
There are several EA frameworks to choose from to model the EA artifacts. However, the four commonly referenced EA frameworks are listed here [18]:
• TOGAF (Open Group) [6]: The most commonly used framework, accounting for 80% of frameworks used in the market.
• The Zachman Framework [19]
• Federal Enterprise Architecture framework [20] • Gartner Framework [21]
With the advent of agile methodologies, practitioners are gravitating towards an agile or adaptive approach to EA to keep up with the changing stakeholder needs and the business environment [5]. It is further highlighted in [5] that 33% of organizations are worried about the artifacts, produced as a part of their EA process, being documentation driven. The static nature of these artifacts causes them to become outdated and unusable in a fast-paced agile environment. The architecture
Enterprise Architecture
Business Architecture
Data Architecture
Application Architecture
26 deliverables are outdated even before their completion or implementation due to recent volatility and agility needs of an adaptive enterprise [5].
2.2 Agile or Adaptive Enterprise Architecture
EA practices need an agile or adaptive approach and adaptive thinking to thrive in this constantly changing dynamic business [22]. However, organizations are often unsure of what they are adapting to and how to adapt. It is essential to understand that an EA is not looking to supply services to an enterprise that makes it adaptive in turbulent environments [18]. It is observed [23] that there are three schools of thought – Architecting, Integrating, and Enterprise Ecological Adaptation. This research paper explicitly examines the third school of thought, which looks at the evolving nature of the enterprise. However, to establish an agile or adaptive EA capability within an organization, we need a systematic and adaptive approach as well [24].
The Gill Framework [9], [18] provides an adaptive approach that discusses the need for using analytics for adaptive EA modeling. The framework refers to the six principles of Agility, Analytics, Design Thinking, Resiliency, Service Science, and Systems thinking to enable adaptive EA modeling. In another relevant approach, Limnios proposes the Resilience Architecture Framework to extend the adaptive principles for enabling enterprise resilience [25]. This article complements the “analytics” principles of predictive, prescriptive or descriptive models for adaptive EA.
Why use analytics? As all unique aspects of an organization are being copied due to globalization, a company can do a few things to remain competitive in this digital age [18], [25]. The first thing is to be resilient and the second is to use their “local facts or evidence” to enable data-driven execution and smart decision making, to extract maximum value from business assets and investments. This provides us with a strong research motivation to explore the possibility of developing an analytics-driven or enabled approach to adaptive BA as a novel class of problem for this ADR project. Furthermore, the research motivation is also informed by the need of our industry partner to have a more adaptive BA approach to handle dynamic business needs, which is not possible using the traditional documentation driven architecture modeling frameworks and approaches.
2.3 Analytics
There are three main types or categories of analytics: descriptive, predictive and prescriptive analytics. Techniques such as Machine Learning, Artificial Intelligence and Simulation are used in analytics to understand “What happened in the past and why it happened” [26]. Table 1 summarises the three categories and high-level questions.
Table 1. Types of analytics
Descriptive Predictive Prescriptive
What happened in the past, and why?
What could happen in the future? What actions can we take?
Descriptive analytics is a reflection of what happened so far, and it could be an indicator of current trends [27]. Predictive analytics provides details about what might happen next. This type of analytics is often used as a forecasting mechanism used to predict future trends based on the information from descriptive analytics [27]. Prescriptive analytics analyses and provides potential future actions that can be taken for the predicted scenarios or trends to achieve the optimum business outcome [27]. Several technology platforms can be used for analytics such as SAS, SAP, IBM, and Microsoft [28].
27 [29] and Amazon. All these organizations have understood the competitive landscape and understood their customers in such a way that let them make effective and timely strategic business decisions in a changing ecosystem [29]. Customer value, market share and continued agility are traits among the organizations that successfully adopted analytics [29]. With the power of analytics, enterprises are proactively using evidence-based approaches to prevent interruptions in business services [30].
Business analytics represents the application of data analytics in business, which is the focus of this article. Business analytics aims to enable decision making within the organization. Having quality data is critical for actionable business analytics and insights. Business analytics has shown much promise in helping organizations with identifying data related to subjects under study and the resulting inefficiencies [31]. One aspect of business analytics is using visualizations to aid organizations with decision-making capabilities. Visual analytics allows the user to visually model, analyze and interpret information and knowledge from complex data. The goal of visual analytics is to “effectively understand, reason and make decisions” [32], [33]. Analytics can also help us decipher the gaps between the current and target state of the BA [34].
While business analytics seems useful, it is not clear how and where to use business analytics in EA, and in particular BA. The next section covers the use of business analytics in EA.
2.4 Business Analytics in EA
Traditional EA modeling and deliverables are composed of static diagrams or viewpoints that are presented to stakeholders and do not change with the changing nature of data. These deliverables often require an expert’s intervention. An analytics-enabled adaptive EA can be viewed as a decision support system for different types of stakeholders’ [18]. [33] proposes an EA Cockpit that dynamically generates interactive visualizations or models to represent the various architecture model relationships and characteristics. This work has been extended by [35] to aid decision analytics in EA Management. It is observed in [18], [25] that advanced qualitative and quantitative analysis and predictive modeling capabilities are important to generate data-driven insights for the business and EA in particular.
Business analytics can be used for BA modeling, and this requires collecting BA data as an input for business analytics. Thus, we need to collect and digitize the “data” about BA elements and their relationships. There could be some challenges with obtaining the most up-to-date data to perform analysis for BA, which needs to be considered when using business analytics for BA. The authors of [36] propose a framework to create IT architecture models from data automatically. The paper proposes a truth algorithm that can utilize heterogeneous data from multiple sources to generate different types of IT architecture models.
[37] proposes seven propositions that examine the benefits of architecture and IT decision making. Architecture artifacts are also increasingly being used to diagnose problems and action them. [38] proposes a hybrid automated and manual modeling of decision support systems using a genetic algorithm. This system recommends and optimizes the EA or BA model, so it aids architects in producing accurate and consistent architecture models. There is an increasing interest among the community to use analytics for EA. The interest is there; however, the challenge is how to do so? This research aims to address this challenge using the ADR method in collaboration with an industry partner.
3
Method and Data Collection
28 The industry research partner for this project is Capsifi. Capsifi offers a cloud-based BA modeling platform, called Jalapeno [41]. Capsifi engaged researchers from the University of Technology Sydney (UTS) in 2018 to help them with the research and development of an analytics-enabled adaptive BA modeling approach which can then be integrated with their existing modeling framework and platform. The deliverables at every stage are inclusive of the ADR building, intervention and evaluation (BIE) stages, involving continuous feedback from experienced business architects at Capsifi and collaboration with the research practitioners at UTS. For the scope of this research, an analytics-enabled adaptive BA modeling approach has been developed for Capsifi. The proposed approach has been evaluated with the help of a case study provided by Capsifi to understand its applicability. The details of the case study and relevant data will be further discussed in the case study section of this article. The continuous two-way feedback between UTS and Capsifi enabled to build and evaluate the analytics-enabled adaptive BA modeling approach. Figure 2 summarizes the overall ADR method stages.
Figure 2. Action Design Research process [40]
• Stage 1: Problem Formulation and Objectives – The main output of this stage is the research problem statement which is covered in Section 1.
• Stage 2: Building, Intervention and Evaluation (BIE) – This stage is classified as an organization-dominant activity BIE, as ADR is applied to build, intervene, and evaluate the required analytics-enabled BA modeling approach in an organizational context using a case study. Section 4 covers the process of Building and Intervening the framework. Sections 5 and 6 evaluate the framework.
• Stage 3: Reflection and Learning – This stage involves research reflection and learnings to improve the artifacts, developed in Stage 2. The Reflection and Learnings from ADR are covered in Sections 5 and 6 of the article.
• Stage 4: Formalization of Learning: This stage involves formalizing the final learning and artifacts from stages 2 and 3 into a generic framework of analytics-enabled adaptive BA. This stage also includes final research implications, limitations, and directions for future research. The Formalization of Learning is discussed in Section 6.
The scope of this research project is limited to BA layer of the EA, and it mainly focuses on one core class or element of the BA – Capabilities. We chose capabilities because it is one of the most tightly connected and referenced classes in BA and is one of the foundational building blocks of a BA [16]. Thus, this article aims to explore the intersection of data analytics and business capabilities in an overall adaptive or agile BA approach, which will provide a strong foundation for further research in this area. Thus, the scope of this research is limited to capability modeling and its PPIT dimensions [42].
The applied ADR process is summarized, as seen in Table 2.
1 • Problem Formulation and Objectives
2
• Iterative building, Intervention and Evaluation (BIE)
3
• Reflection and Learning
4
29
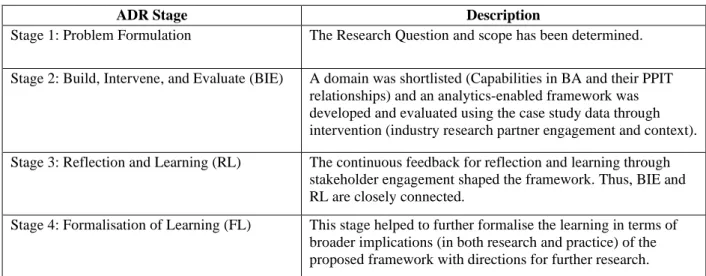
Table 2. Summary of the ADR method
ADR Stage Description
Stage 1: Problem Formulation The Research Question and scope has been determined.
Stage 2: Build, Intervene, and Evaluate (BIE) A domain was shortlisted (Capabilities in BA and their PPIT relationships) and an analytics-enabled framework was developed and evaluated using the case study data through intervention (industry research partner engagement and context). Stage 3: Reflection and Learning (RL) The continuous feedback for reflection and learning through
stakeholder engagement shaped the framework. Thus, BIE and RL are closely connected.
Stage 4: Formalisation of Learning (FL) This stage helped to further formalise the learning in terms of broader implications (in both research and practice) of the proposed framework with directions for further research.
The advantages of using the ADR method are multifold. The iterative nature of the ADR method combined with the continuous artifact development, evaluation for a case study, and communication for feedback resulted in the integration of theoretical intent and practical aspects in the proposed solution [12]. Thus, ADR with an embedded case study approach was selected as a preferred method to address the research problem in hand.
4
Analytics-enabled Adaptive BA Modeling
This section presents the analytics-enabled approach for adaptive BA modeling, developed for Capsifi. Figure 3 provides a conceptual understanding of an analytics-enabled adaptive BA.
Figure 3. Business analytics-enabled BA
An adaptive BA generates data for the analytics process. The Analytics process turns the data into insights for adaptability, which further generates actions for the adaptive BA. Data could be about BA elements such as business capabilities, maturity assessments and projects in flight, etc. Insights could be business insights of a descriptive or predictive nature. These insights, while useful, may not necessarily translate to actions. Insights can be used to generate action items for adaptations. As discussed earlier, due to the large and complex nature of BA, the scope of this research includes only the Analytics slice from Figure 3 and business capabilities in particular. The capability element of a BA has been chosen because it provides a foundational building block for other BA elements [16].
Analytics
Adaptability Adaptive
Business Architecture
Data
30 There are two dimensions to this approach – BA dimension and Analytics dimension.
4.1 Business Architecture (BA)
The BA modeling dimension focuses on modeling the business capabilities and their relationships using the Capsifi BA modeling platform, which is called Jalapeno [41]. The BA modeling stages are listed below. These stages are based on TOGAF [6], BIZBOK [16], The Gill Framework [9], [24] and the CAPSICUM framework [41], [42]. The five modeling stages are described in Figure 4.
Figure 4. BA stages for modeling capabilities
4.2 Analytics
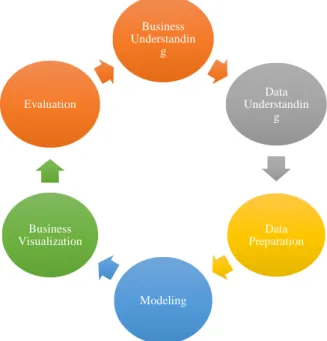
The analytics modeling dimension refers to the well-known CRISP-DM methodology, which we aim to incorporate into BA modeling for creating the analytics-enabled BA modeling approach. CRISP-DM is the cross-industry standard process for data mining, which is recognized by both industry and academia [39]. The six phases of this methodology are Business Understanding, Data Understanding, Data Preparation, Modeling, Evaluation and Deployment. These phases have been tailored to align with the BA modeling dimension as appropriate to the context of this research and Capsifi’s needs (Figure 5).
Figure 5. Customized CRISP-DM phases
Understand the business objectives
View curent state of the capability model
View target state of the capability model
Identify capablity elements and their relationships
Generate business visualizations for data gap analysis
Business Understandin
g
Data Understandin
g
Data Preparation
Modeling Business
31 Other researchers and organizations may have different patterns of CRISP-DM as relevant to them. The modified phases of CRISP-DM used in this context are: Business Understanding, Data Understanding, Data Preparation, Modeling, Business Visualization and Evaluation.
4.3 Integrated Analytics-Enabled Adaptive BA
As discussed in Section 2, various types of analytics, such as Descriptive, Predictive and Prescriptive, can be applied to BA. Organizations can integrate the analytics dimension and the architecture dimensions in several ways. An example of using descriptive business analytics would be to obtain the most relevant data for analysis at the lowest level [43]. Once the most up to date data is obtained, the challenge for architects is to generate visualizations or models based on this data to aid decision making for stakeholders [32]. Decision making via visual analytics helps stakeholders make investment and prioritization decisions. [33] suggests the need for dynamic visualizations that evolve with the changing nature of data without expert intervention.
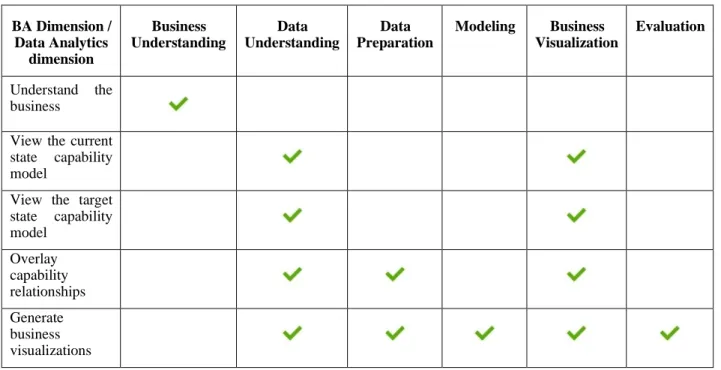
In this article, we focus on integrating the modified CRISP-DM approach (from analytics discipline) as shown in Figure 5 into the BA architecture modeling approach as shown in Figure 4 to create the analytics-enabled BA modeling approach. The alignment and integration of the CRISP-DM and BA modeling dimensions are explained in Table 3. This research contributes to the literature and body of knowledge by providing a combination of both dimensions for integrated analytics-enabled adaptive BA modeling approach, which has not been studied before to any greater detail. Table 3 highlights the intersection of the two dimensions. Each phase of the CRISP-DM methodology in the Analytics dimension is mapped to the BA dimension. The aim is to identify the interaction points for creating an analytics-enabled adaptive BA modeling approach.
Table 3. Analytics-enabled Adaptive BA modeling approach
BA Dimension / Data Analytics
dimension
Business Understanding
Data Understanding
Data Preparation
Modeling Business Visualization
Evaluation
Understand the business
View the current state capability model
View the target state capability model
Overlay capability relationships Generate business visualizations
The rows in Table 3 list the stages of the BA dimension, and the columns list the stages of the Analytics dimension. Each cell looks at the alignment and integration of both dimensions, which are marked using the green tick symbol. The following paragraphs elaborate on these two integrated dimensions:
1. Understand the business
32 organizational objectives. Metrics also need to be defined by the architect in collaboration with the organization’s stakeholders.
2. Visualize the current state capability model
This stage produces the current state business capability model of the organization. As mentioned earlier, a capability defines the ability of an organization to achieve an outcome, and a capability can be decomposed into the four PPIT dimensions. A current state capability model can be used for further assessing and analyzing the current maturity of the capabilities with a “maturity score” or mapping the criticality of the capability and other relevant data points. The choice of an assessment of the current state largely depends on the specific organization needs. The Analytics dimension stages that align with this BA modeling stage are:
• Data Understanding: Understand the data related to current state capabilities and assessments. • Business Visualization: Jalapeno is used to generate the initial business visualizations (the
current business capability model) for this stage. Further, the capability and its current state assessment data are overlayed to provide visual analysis.
3. Visualize the target state capability model
Similar to step 2, this step focuses on modeling the target state of the capabilities mapped in the business capability model. This is done to further perform the gap analysis between the current and target states. The target state would ideally have a complete set of data points for all the areas or capabilities. However, an organization may prioritise complete data availability for only important areas because it may not be feasible to collect, map and analyze the data for all areas or capabilities. It is important to understand the organization’s target state before identifying the gaps. The Analytics dimension stages aligned to this BA modeling stage are:
• Data Understanding: Understand the data related to target state capabilities and the assessment performed.
• Business Visualization: Jalapeno is used to generate initial business visualizations for the target state using the target state capability data points.
4. Overlay capability relationships
This stage aims to model and overlay the four dimensions related to a capability – PPIT. Each of these dimensions refers to a set of data points. For instance, people dimension of a capability may refer to a set of roles or number of staff or organization units as data points. Through this stage, it is essential to analyze the data points that exist across all these four dimensions. The Analytics dimension stages aligned with this BA modeling stage are:
• Data Understanding: The PPIT elements, and their relationships data is mapped to capabilities. • Data Preparation: All available data needs to be collected and made available at this stage so
we can perform initial exploratory data analysis, which is required to understand and prepare the data before detailed analytics.
• Business Visualization: Jalapeno is used to generate initial business visualizations to demonstrate the relationships of PPIT elements for a state-specific (current, target) view of the capabilities.
5. Generate Business Visualizations
The outputs of the previous stages are collected to generate consolidated insights and visualizations to meet the business needs. Tableau and Jalapeno are used for BA modeling and data analysis. However, any other appropriate analytics and modeling technologies can be used for this step. The Analytics dimension stages aligned with this BA modeling stage are:
• Data Understanding: Understand the data obtained from earlier steps for the capabilities. • Data Preparation: Clean and prepare the data for further analysis.
• Business Visualization: Perform data analysis and generate visualizations.
33 The above section provided an overview of the proposed analytics-enabled approach to adaptive BA modeling. It delved with Step 1 (Problem Formulation) and Step 2 (Build, Intervene and Evaluate) of the ADR methodology as outlined in Section 3. The abovementioned framework has been developed after consultation with practitioners at Capsifi and academics at UTS. The next section will look at implementing this framework in a real-world case study.
5
Application Case Study
A case study approach [44] has been used in this ADR project to determine the applicability of the proposed adaptive BA framework. Case study based approach is useful for understanding a phenomenon or concern within a real-life context. Thus, the framework proposed in Section 4 has been applied to a BA case study in the Jalapeno modeling platform for an insurance provider called Vitality Health Insurance. Jalapeno is Capsifi’s cloud-based platform that allows an organization to model their business from strategy to execution [41]. Vitality Health is based on a real health insurance organization, the organization’s name and data have been anonymised for privacy reasons.
The following data was made available for analysis: • Capabilities;
• Capability Map;
• Organization Units (and their relationship to the capability); • Processes (and their relationship to the capability);
• Data Objects (and their relationship to the capability); • Applications (and their relationship to the capability); • Epics (and their relationship to the capability).
Vitality Health wanted to evaluate data gaps and potential dependencies on their capabilities. These dependencies would inform Vitality Health’s investment and decision-making process for their next planning cycle. The BA dataset was stored in Jalapeno, whereas Tableau was used to perform visual analytics on the data. The steps below incorporate the analytics-enabled adaptive BA framework from Section 4 to the case study data.
1. Understand the business scope
Vitality Health’s strategic motivation model was reviewed in terms of their Vision, Mission, Goals, Strategies and Objectives. An example of Vitality’s motivation is to commit to longer, healthier lives by making a difference in the way healthcare is delivered to their customers. It is important to review the organization’s strategic purpose, which provides context to shaping the business data analytics objectives and questions.
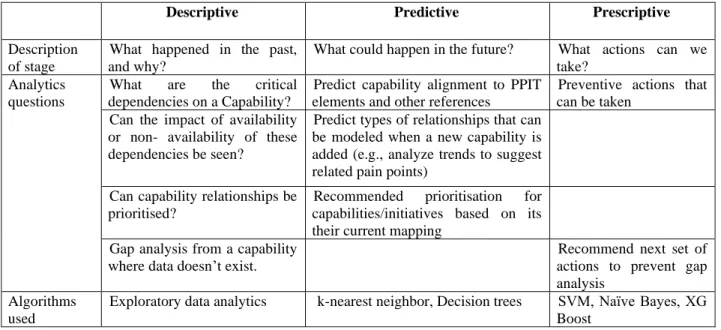
Interviews were conducted with the key stakeholders at Capsifi: the lead business architect, the head of product, the CEO and the lead semantic developer of the Capsifi. The goal of the interviews was to understand the key questions that need to be addressed for Vitality Health Insurance and to understand the dataset. The findings from the interviews were used to create descriptive, predictive and prescriptive analytics questions to help frame the business problem and understand the objectives as shown in Table 4.
34
Table 4. Analytics questions for stakeholders
Descriptive Predictive Prescriptive
Description of stage
What happened in the past, and why?
What could happen in the future? What actions can we take?
Analytics questions
What are the critical dependencies on a Capability?
Predict capability alignment to PPIT elements and other references
Preventive actions that can be taken
Can the impact of availability or non- availability of these dependencies be seen?
Predict types of relationships that can be modeled when a new capability is added (e.g., analyze trends to suggest related pain points)
Can capability relationships be prioritised?
Recommended prioritisation for capabilities/initiatives based on its their current mapping
Gap analysis from a capability where data doesn’t exist.
Recommend next set of actions to prevent gap analysis
Algorithms used
Exploratory data analytics k-nearest neighbor, Decision trees SVM, Naïve Bayes, XG Boost
The questions in Table 4 have been selected based on their relevance to the research question in hand. The success criteria determined by industry partner Capsifi are:
• Application of the analytics-enabled approach to BA; • Providing insights to aid with gap analysis.
2. and 3. Visualize the current and target state capability models
The capability data for Vitality Insurance was collected and provided by Capsifi in the spreadsheet. The data was analyzed and cleaned before importing into Jalapeno BA modeling platform. Data cleaning is a critical step to ensure that the resulting modeling output is logical and does not consist of irrelevant values and columns. Figure 6 shows the current state capability map.
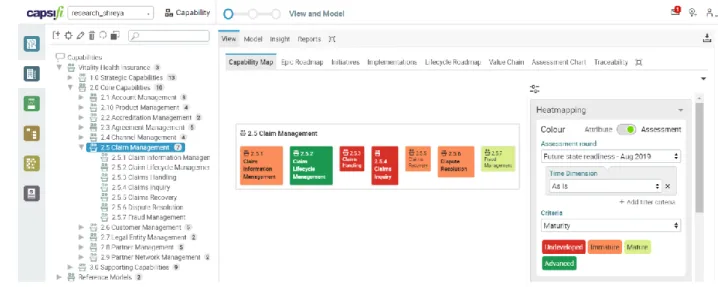
Alongside capability data, assessment data was also provided by Vitality Health for analysis. Figure 7 shows the capability map with a ‘Readiness for future state’ assessment data points applied to it. Figure 8 shows the capability map with a ‘Future state assessment’ added to it. The colours on the capabilities represent the current state maturity data points. The little icons in the top right corner of the capability box represent the target state maturity data points overlayed on the current state to visualize the gap between the two states.
The assessment values for future state readiness referenced in Figure 7 and 8 represent the following:
• Underdeveloped: This indicates that the capability is not future-ready. There appear to be gaps in the availability and implementation of this capability within the organization. The capabilities are currently siloed.
• Immature: The organization has just started the effort to collate the siloed information. Information is still dispersed.
• Mature: There is a continuous and consistent effort by the organization to make the capability future-ready. The capability is clearly defined. There are efforts to maintain and track the capabilities across the whole organization. The capability dimensions and linkages may be slightly ambiguous.
35
Figure 6. Capability Map for Claim Management
Figure 7. Capability Map with a current state assessment heatmap
Figure 8. Capability Map with current state heatmap and target state overlay
36 Unlike traditional static modeling approaches, modeling and viewing the current and target states together in one view with data points, allowed Capsifi architects to analyze and visualize the gaps in an effective manner. For instance, the capabilities in red have the most significant gaps. It can be observed that for some capabilities, the goal is to attain the ‘Advanced Maturity’ level to align with the organization’s strategic motivation. E.g., as seen in Figure 8, the Claims Handling heatmap shows that it is currently ‘Underdeveloped’ in terms of Future State Readiness. The target state for Claims Handling is ‘Mature’ that makes the gap between the current and target state quite significant. For an organization, to be able to view this information provides them with an indication for prioritisation of their efforts and resources. By using business analytics, we can perform data correlations between the different data elements.
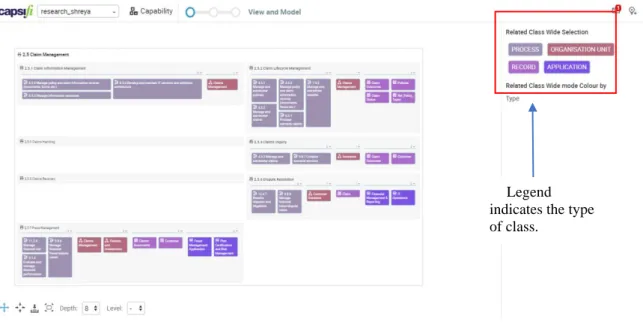
4. Overlay capability relationships
Once the initial capability model is developed based on the capability data points, then the four PPIT dimensions of each capability can be modeled. While there are many other elements (e.g. business services, location, servers, routers) that can be overlayed on the capabilities, however, in this first phase, this research will limit the scope to include only the following elements of the capability.
• People: Organization units • Process: Processes
• Information: Data Objects • Technology: Applications
Figure 9 presents the capability model with above mentioned four dimensions. This visual model clearly demonstrates the ease of viewing the availability and non-availability of capability relationships immediately. It is observed that the two capabilities to the left of the diagram do not have any relationships, which need to be modeled based on the provided data points. The first two capabilities to the right of the diagram do not have any ‘Applications’ related to a capability as observed by the missing blue colour. This is a good example of the visual analysis based on the complex spreadsheet dataset.
Figure 9. Capability map and the PPIT dimensions
5. Generate Business visualizations for gap analysis
Jalapeno BA modeling platform helped us to model the business capability data. For further visual data analytics, we uploaded data from Jalapeno to Tableau. The current and target state data is exported in a tabular format in Tableau (Figure 10). Further, k – means clustering has been used for cluster analysis in order to generate the required business visualizations (visual analytics) in this
37 step. The visualizations represent Vitality’s strategic elements mapped against their tactical elements for obtaining useful insights.
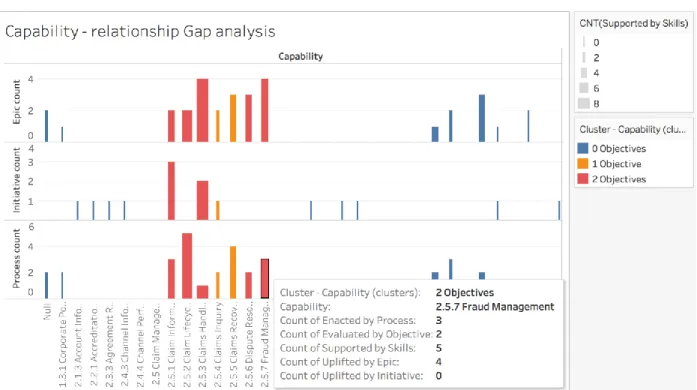
Figure 10. Capability relationship gaps
It can be observed from Figure 10 that the strategic elements (objectives) are used as a base element for the cluster analysis and relevant colour coding. The tactical/execution elements such as Processes, Initiatives and Epics are mapped on the Y-axis with the Capabilities mapped on the X-axis. These views help to highlight the links and gaps between the objectives and their execution. It is observed that other than a few capabilities, which have 1-2 objectives aligned, the rest of the capabilities have 4-6 epics, initiatives and processes, as shown in Figure 10. It means that these are the areas (epics, initiatives) that Vitality is currently investing in; however, these areas seem not to be aligned or linked to any objectives, and thus this provides the insights which indicate the non-strategic alignment of the current investments. This business analytics-enabled approach to BA modeling offered an interesting insight and highlighted a potential gap between strategy and execution (epics, initiatives). This may drive actions such as stopping the certain initiatives which are not aligned to strategic objectives. Thus, this indicates the adaptive nature of the BA as enabled by the analytics and evidence.
38
Figure 11. Capability relationship gap analysis
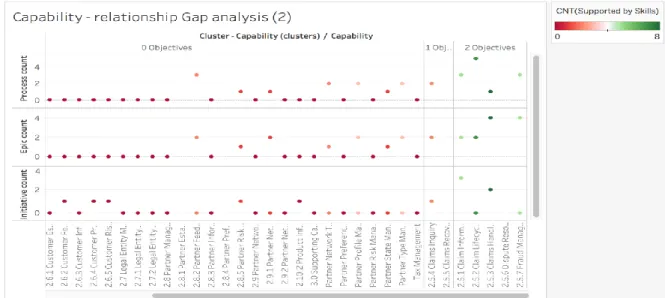
The model in Figure 12 is a representation of the tactical (epics) progress and their relationship to capability uplift. The Y-axis represents the count of Epics executed, and the X-axis shows the capability uplifts. The colours indicate the Epics that are uplifting the capabilities in the X-axis. This model in Figure 12 provides fascinating insights that indicate which of the capabilities do not have any supporting Epics within the ‘Technology’ dimension of a Capability. This may mark the need for required investment in those specific areas of epics or technology to uplift the business capabilities. This is another demonstration of the business analytics-enabled and evidence-based BA modeling approach applicability for identifying useful insights for further actions and adaptation.
Figure 12. Capability Gap analysis
In Table 5 we summarize the findings from this research as per the case study research method [44].
Table 5. Case study summary
Case description
Research Problem Data Sources Investigators Output
1 organization Evaluate data gaps and potential dependencies on their Capabilities
Dataset including Stakeholder Interviews
39
6
Discussion
6.1 Contribution to Research and Practice
A key contribution to research is that this framework builds on the integration of theoretical business analytics and BA domains. This framework also enhances the existing knowledge and understanding of the use of business analytics for adaptive BA, which is the main research question of this article. Thus, based on the learning from this research, it can be suggested that traditional visual notation based static modeling approaches such as ArchiMate and BPMN could be enhanced with business analytics approaches. This is because visual static modeling is not enough to meet the needs of an increasingly digitized and dynamic business environment. If existing modeling approaches can be extended with data and business analytics, it can offer insights beyond a static model in a large textual document. This lays the foundation for further research in this area of analytics-enabled visual modeling.
The proposed framework has also been applied to an insurance organization’s case study, which demonstrates its applicability to practice. The proposed framework can be tailored and applied to other similar contexts and problems. The proposed framework has implications for practice. For instance, it can be used to inform the establishment of analytics-enabled adaptive BA practice in an organization. Furthermore, it can be used to identify the types of data required for a BA element such as business capability, service, events and applications etc. It can also be used for upskilling architects who have an interest in analytics-enabled BA.
6.2 Learning and Reflection
It was useful to obtain and analyze feedback from stakeholders through continuous reflection and learning. Key reflections and learnings are listed here:
• Feedback from the stakeholders was essential in identifying their concerns or questions and required data for iteratively developing and evaluating the framework.
• Establishing a clear understanding of the problem and data within its context was critical for the trustable analytics-enabled adaptive BA and related insights.
• Stakeholder concerns were reviewed to ensure only questions with available datasets and those most relevant to our research question in hand were pursued.
• The use of the case study approach within the ADR method was beneficial to evaluate the applicability of the proposed framework within its real-life context.
• The research also needed to employ project management techniques to ensure all stakeholders had clarity on the research status, tasks pending, and timeframes; so expectations could be balanced. The researchers needed to track project timelines and provide fortnightly updates to all stakeholders regarding the progress.
Research is an ongoing process, and like any other research, this research also has some limitations, which may pose a threat to its validity. The research, framework and results need to be considered with the following limitations:
• The application of the proposed framework within a single organizational context may be considered a limitation. However, proposed framework is adaptable and can be tailored for different organizational contexts, as required.
• There could be a possibility of researcher bias in developing and evaluating the proposed framework. However, this risk was mitigated and minimized through continuous stakeholder engagement and feedback loops.
40 evaluate other elements of the analytics-enabled adaptive BA such as business service, product, events etc.
• The data collection and cleansing were the most time-consuming activities in the proposed analytics-enabled adaptive BA approach. This may require the appointment of additional resources or roles (such as adaptive BA data steward and analyst) to support business architects.
6.3 Future Work
This research opens up several options for further research in this important area.
• The analytics techniques used in this research caters well to tabular data. It does not cater to the more dynamic and schema-less graph-based data. Future work will aim to explore the impact of analytics in graph-based data.
• This research paper mainly focused on exploratory and descriptive analytics techniques for adaptive BA. Future work will aim to implement predictive and prescriptive analytics.
• A data quality check or assessment in the framework can be developed to check the fitness of data for its intended purpose. The data collection and cleaning was the most important and time-consuming activities in the proposed analytics-enabled approach. The team spent significant time in exploring, understanding and cleaning the data to ensure that the data fits for analytics and generating adaptive BA visualisations and models.
• The gap analysis is based on visually charting the tabular data imported into Jalapeno and Tableau. Future work will include dynamic charting depending on metrics that can be calculated through analysis or calculations.
• The scope of analytics-enabled adaptive BA modeling can be extended to include other dimensions of architecture such as Business Services, Products, Events, Value Streams, and Applications etc.
• The proposed approach may require the seamless integration of the BA modeling platforms (e.g. Jalapeno) and analytics platforms (e.g. Tableau, R) for integrated analytics-enabled adaptive BA modeling. This would reduce the time and effort required for exporting and importing data from one platform to another platform.
7
Conclusion
There is an increasing interest among the community to use business analytics for BA modeling. The challenge is how and where to use business analytics in BA. This article presented a business analytics-enabled adaptive BA modeling approach and demonstrated its usefulness with the help of a case study at the industry research partner Capsifi. The aim of this modeling case study was to develop and evaluate the proposed approach against the defined success criteria (Table 6).
Table 6. Metric evaluation outcome
Criteria Outcome
Application of analytics-enabled techniques to BA We have demonstrated the applicability of the proposed approach with the help of a practical case study in Capsifi.
Addressing stakeholder concerns by providing insights to aid with gap analysis and decision making
The business visualizations offer insights to Capsifi stakeholders to aid them with gap analysis and decision making.
41 comprehensive theoretical and practical approaches for adaptive BA modeling. A decision support and automation system can be developed to provide the end to end technology platform for adaptive BA modeling, which can facilitate the integration of both the analytics and visual modeling.
Acknowledgments
We wish to extend our sincere thanks to the industry partner Capsifi for proving financial support and datasets for this research. We also thank to anonymous reviewers of this article who provided us with their valuable feedback to improve the quality of the article.
References
[1] D. De Clercq, M. Bernaert, B. Roelens, and G. Poels, “Simplicity is not simple: how business architecture in one of Belgium’s biggest companies can be simple and easy to use,” Lecture Notes in Business Information
Processing, vol. 235, Springer, pp. 341–355, 2015. Available: https://doi.org/10.1007/978-3-319-25897-3_22
[2] E. Lemey, “Investigating service-oriented business architecture,” Lecture Notes in Computer Science (including
subseries Lecture Notes in Artificial Intelligence and Lecture Notes in Bioinformatics), vol. 7221, Springer,
pp. 220–225, 2012. Available: https://doi.org/10.1007/978-3-642-31875-7_26
[3] P. Ateetanan, S. Usanavasin, K. Shirahada, and T. Supnithi, “From service design to enterprise architecture: The alignment of service blueprint and business architecture with business process model and notation,” Lecture Notes in Computer Science (including subseries Lecture Notes in Artificial Intelligence and Lecture Notes in
Bioinformatics), vol. 10371, Springer, pp. 202–214, 2017. Available:
https://doi.org/10.1007/978-3-319-61240-9_19
[4] P. Saha, Enterprise Architecture for Connected E-Government: Practices and Innovations. IGI Global 2012. Available: https://doi.org/10.4018/978-1-4666-1824-4
[5] T. Kaddoumi and M. Watfa, “A proposed agile enterprise architecture framework,” 2016 Sixth International
Conference on Innovative Computing Technology (INTECH), pp. 52–57, 2016. Available:
https://doi.org/10.1109/INTECH.2016.7845126
[6] The Open Group, “TOGAF Standard Core Concepts,” vol. 2019, Accessed on: 13 September 2019 Available: https://pubs.opengroup.org/architecture/togaf9-doc/arch/chap02.html
[7] W. Ulrich and W. Kuehn, “Business Architecture: Dispelling Twelve Common Myths,” Business Architecture
Associates, 2019.
[8] S. R. Mary and P. Rodrigues, “Survey and Comparison of Frameworks in Software Architecture,” Advances in
Computing and Communications. ACC 2011. Communications in Computer and Information Science, vol. 193,
Springer, pp. 9–18, 2011. Available: https://doi.org/10.1007/978-3-642-22726-4_2
[9] A. Q. Gill, Adaptive cloud enterprise architecture. Intelligent information systems, vol. 4. World Scientific, 2015. Available: https://doi.org/10.1142/9363
[10] M. Anwar, A. Gill, and G. Beydoun, “Using Adaptive Enterprise Architecture Framework for Defining the Adaptable Identity Ecosystem Architecture,” Australasian Conference on Information Systems, pp. 890–900, 2019.
[11] M. J. Anwar and A. Q. Gill, “A Review of the Seven Modelling Approaches for Digital Ecosystem Architecture,”
2019 IEEE 21st Conference on Business Informatics (CBI), vol. 1, pp. 94–103, 2019. Available:
https://doi.org/10.1109/CBI.2019.00018
[12] M. K. Sein, O. Henfridsson, S. Purao, M. Rossi, and R. Lindgren, “Action Design Research,” MIS Quarterly, vol. 35, no. 1, pp. 37–56, 2011. Available: https://doi.org/10.2307/23043488
[13] A. Q. Gill and E. Chew, “Configuration information system architecture: Insights from applied action design research,” Information & Management, vol. 56, no. 4, pp. 507–525, 2019. Available: https://doi.org/10.1016/j.im.2018.09.011
[14] T. Iyamu, “Implementation of the enterprise architecture through the Zachman Framework,” Journal of Systems
and Information Technology, vol. 20, no. 1, pp. 2–18, 2018. Available: https://doi.org/10.1108/JSIT-06-2017-0047
42 [16] Business Architecture Guild, “A Guide to the Business Architecture Body of Knowledge (BIZBOK Guide),”
Business Architecture Guild, 2019. Available:
https://cdn.ymaws.com/www.businessarchitectureguild.org/resource/resmgr/bizbok8_0publicdocc/bizbokv8.0_fin al_toc.pdf
[17] The Open Group, “Phase C: Information Systems Architectures – Data Architecture,” September 2019, Available: https://pubs.opengroup.org/architecture/togaf9-doc/arch/chap09.html
[18] J. J. Korhonen, J. Lapalme, D. McDavid, and A. Q. Gill, “Adaptive Enterprise Architecture for the Future: Towards a Reconceptualization of EA,” 2016 IEEE 18th Conference on Business Informatics (CBI), pp. 272–281, 2016. Available: https://doi.org/10.1109/CBI.2016.38
[19] Zachman International Enterprise Architecture, “The Concise Definition of The Zachman Framework by: John A. Zachman,” 2019.
[20] Federal Government, “Federal Enterprise Architecture Framework,” 2013. Available: https://obamawhitehouse.archives.gov/sites/default/files/omb/assets/egov_docs/fea_v2.pdf.
[21] Gartner Research. Gartner’s Enterprise Architecture Process and Framework Help Meet 21st Century Challenges, 2005. Available: https://www.gartner.com/en/documents/486650/gartner-s-enterprise-architecture-process-and-framework-h
[22] A. Q. Gill, “Applying agility and living service systems thinking to enterprise architecture,” International Journal
of Intelligent Information Technologies, vol. 10, no. 1, p. 1–15, 2014. Available:
https://doi.org/10.4018/ijiit.2014010101
[23] J. Lapalme, “Three Schools of Thought on Enterprise Architecture,” IT Professional, vol. 14, no. 6, pp. 37–43, 2012. Available: https://doi.org/10.1109/MITP.2011.109
[24] A. Q. Gill, “Agile enterprise architecture modelling: Evaluating the applicability and integration of six modelling standards,” Information and Software Technology, vol. 67, pp. 196–206, 2015. Available: https://doi.org/10.1016/j.infsof.2015.07.002
[25] E. A. M. Limnios, T. Mazzarol, A. Ghadouani, and S. G. M. Schilizzi, “The Resilience Architecture Framework: Four organizational archetypes,” European Management Journal, vol. 32, no. 1, pp. 104–116, 2014. Available: https://doi.org/10.1016/j.emj.2012.11.007
[26] K. Lepenioti, A. Bousdekis, D. Apostolou, and G. Mentzas, “Prescriptive analytics: Literature review and research challenges,” International Journal of Information Management, vol. 50, pp. 57–70, 2020. Available: https://doi.org/10.1016/j.ijinfomgt.2019.04.003
[27] S. D. Rowe, “Leveraging the three stages of analytics,” Customer Relationship Management, vol. 21, no. 3, pp. 1– 4, 2017.
[28] Z. Sun, K. Strang, and J. Yearwood, “Analytics Service Oriented Architecture for Enterprise Information Systems,” Proceedings of the 16th International Conference on information integration and web-based
applications & services, ACM, pp. 508–516, 2014. Available: https://doi.org/10.1145/2684200.2684358
[29] Y. Liu, H. Han, and J. E. DeBello, “The Challenges of Business Analytics: Successes and Failures,” Proceedings
of the 51st Hawaii International Conference on System Sciences, pp. 840–849, 2018. Available:
https://doi.org/10.24251/HICSS.2018.105
[30] D. Xu, I. W. Tsang, E. K. Chew, C. Siclari, and V. Kaul, “A Data-Analytics Approach for Enterprise Resilience,”
IEEE Intelligent Systems, vol. 34, no. 3, pp. 6–18, 2019.
[31] T. Gresham, “Data Gap Analysis,” Bizfluent, 2017.
[32] D. Jugel, C. M. Schweda, A. Zimmermann, and S. Läufer, “Tool Capability in Visual EAM Analytics,” Complex
Systems Informatics and Modeling Quarterly, CSIMQ, no. 2, pp. 46–55, 2015. Available:
https://doi.org/10.7250/csimq.2015-2.04
[33] D. Jugel and C. M. Schweda, “Interactive Functions of a Cockpit for Enterprise Architecture Planning,” 2014
IEEE 18th International Enterprise Distributed Object Computing Conference Workshops and Demonstrations,
pp. 33–40, 2014. Available: https://doi.org/10.1109/EDOCW.2014.14
[34] The Business Analyst Job Description, “The complete guide to Gap Analysis,” no. 28, 2019. Available: https://thebusinessanalystjobdescription.com/the-complete-guide-to-gap-analysis/
[35] A. Zimmermann, D. Jugel, K. Sandkuhl, R. Schmidt, C. Schweda, and M. Möhring, “Architectural Decision Management for Digital Transformation of Products and Services,” Complex Systems Informatics and Modeling
43 [36] M. Välja, R. Lagerström, U. Franke, and G. Ericsson, “A Framework for Automatic IT Architecture Modeling: Applying Truth Discovery,” Complex Systems Informatics and Modeling Quarterly, CSIMQ, no. 20, pp. 20–56, 2019. Available: https://doi.org/10.7250/csimq.2019-20.02
[37] M. van den Berg, R. Slot, M. van Steenbergen, P. Faasse, and H. van Vliet, “How enterprise architecture improves the quality of IT investment decisions,” The Journal of Systems & Software, vol. 152, pp. 134–150, 2019. Available: https://doi.org/10.1016/j.jss.2019.02.053
[38] R. Pérez-Castillo, F. Ruiz, and M. Piattini, “A decision-making support system for Enterprise Architecture Modelling,” Decision Support Systems, vol. 131, 2020. Available: https://doi.org/10.1016/j.dss.2020.113249 [39] C. Cobos, J. Zuñiga, J. Guarin, E. León, and M. Mendoza, “CMIN – a CRISP-DM-based case tool for supporting
data mining projects,” Ingeniería e Investigación, vol. 30, no. 3, pp. 45–56, 2010.
[40] A. Q. Gill and E. Chew, “Configuration information system architecture: Insights from applied action design research,” Information & Management, vol. 56, no. 4, pp. 507–525, 2018.
[41] Capsifi. Capsifi Homepage, 2018. Available: https://www.capsifi.com/
[42] T. Roach, “CAPSICUM – a semantic framework for strategically aligned business architecture,” PhD Thesis, University of New South Wales, Australia, 2011.
[43] R. Schmidt, M. Wißotzki, D. Jugel, M. Möhring, K. Sandkuhl, and A. Zimmermann, “Towards a framework for enterprise architecture analytics,” IEEE International Enterprise Distributed Object Computing Workshop,
EDOCW2014, pp. 266–275, 2014. Available: https://doi.org/10.1109/EDOCW.2014.47
![Figure 1. Enterprise Architecture Layers [6]](https://thumb-us.123doks.com/thumbv2/123dok_us/7974710.2116678/3.892.177.729.617.816/figure-enterprise-architecture-layers.webp)
![Figure 2. Action Design Research process [40]](https://thumb-us.123doks.com/thumbv2/123dok_us/7974710.2116678/6.892.298.616.376.618/figure-action-design-research-process.webp)