Dynamics In Primary Somatosensory Cortex: A Role For SI In The Processing Of Tactile Information.
Stephen B. Simons
A dissertation submitted to the faculty of the University of North Carolina at Chapel Hill in partial fulfillment of the requirements for the degree of Doctor of Philosophy in the Department of Biomedical Engineering.
Chapel Hill 2007
Approved by:
Mark Tommerdahl
Oleg Favorov
Bob Dennis
Jeff MacDonald
ABSTRACT
Stephen B. Simons: Dynamics In Primary Somatosensory Cortex: A Role For SI In The
Processing Of Tactile Information.
(Under the direction of Mark Tommerdahl)
Traditional views of primary somatosensory cortex (SI) and its role in the
processing of tactile information have limited its function as a dynamic component in the
somatosensory pathway. Here I present evidence that the response in SI to stimuli at a
given skin site is systematically modified with changes in the stimulus parameters and
displays considerable dynamics. Optical intrinsic signal (OIS) imaging was used to study
the responses (in vivo) evoked by 25 Hz (flutter) vertical skin displacement stimuli to the
forelimb of squirrel monkey and cat. Responses to electrical stimulation were also
measured in rat sensorimotor cortical slices using OIS imaging and local field potential
(LFP) recordings. Results indicate that, contrary to traditional views, the intensive but
not spatial attributes of the SI response are modified by increases in stimulus amplitude.
Increasing the duration of flutter stimulation evokes increases in response magnitude in
cortical regions near to the maximally responding center and simultaneous decreases in
inhibition along the proximodistal axis of the body representation. Cortical slices in the
sagital and coronal planes of the rat somatosensory cortex demonstrated a similar
anisotropy in the distribution and impact of GABAergic inhibition on the horizontal
spread of activity, and lend support to the idea that the non-uniformity observed in vivo
may contain functional relevance. Bilateral stimulation of both forelimbs demonstrated
that, although input to SI has been traditionally regarded as exclusively contralateral, not
only can the response to an ipsilateral stimulus be measured in SI, but when stimulation is
applied bilaterally the spatiotemporal characteristics of the evoked response cannot be
accounted for by the responses of either stimulus alone or by the linear summation of the
pair. All of these results taken together present a strong case for the necessity of strong
dynamics in SI and the role of SI as an important site of cortical information processing
For my parents Ross and Sheila, whose love and support have carried me,
ACKNOWLEDGEMENTS
I would like to acknowledge all those people who have assisted in the completion
of this work. Special thanks go to my colleagues, the members of my committee and,
most especially to my advisor Mark Tommerdahl whose guidance and drive has been an
TABLE OF CONTENTS
TABLE OF FIGURES... ix
CHAPTER 1: Introduction...1
CHAPTER TWO: Experimental Methods...5
In Vivo Methods...5
Cat preparation...6
Imaging Protocol in vivo...7
Histological procedures/identification of cytoarchitectural boundaries...8
In vitro preparation...9
In vitro OIS and stimulation protocol...10
Evoked field potential recordings...10
CHAPTER THREE: SI Response to Changes in Stimulus Amplitude...12
Background...12
Analytical Methods...14
Imaging and Stimulus Protocol...14
Spatial Histogram...14
Correlation Maps...14
Results...15
Background...35
Methods...36
Stimulus Protocols...36
Cluster Analysis...36
Results...37
Squirrel Monkey SI...37
Cat SI...39
Cat SII...46
Discussion...50
CHAPTER FIVE: SI Response to Changes in Stimulus Duration...55
Background...55
Methods...57
Stimulus Protocol...57
Response Recovery...58
Determination of ROI...58
Correlational Methodology...59
Radial Histograms...60
Surround Anisotropy Plots (SAPs)...60
Results...60
Characterization of the temporal response within the maximally activated region..61
Changes in degree of correlated activity with increasing stimulus duration...65
Effects of stimulus duration on spatial extent...67
Characterization of the temporal response in the surround...71
Stimulus site specific suppression...72
Discussion...76
Prolonged stimulation reduces the spatial extent of the responding population...77
Stimulus site-specific SI suppression...78
Functional implications...79
CHAPTER SIX: In Vitro Examination of Pericolumnar Excitability...81
Background...81
Analytical Methods...83
Results...83
Discussion...98
TABLE OF FIGURES
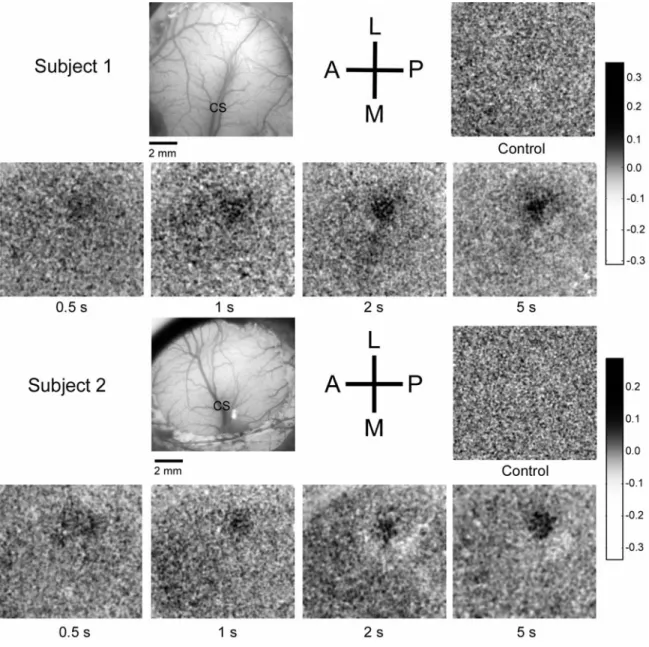
Figure 3.1. OIS response to low vs. high amplitude stimulation………...16
Figure 3.2. Spatial histograms of activity at different amplitudes…...18
Figure 3.3. Absorbance time course and anatomical registration in SI………..….20
Figure 3.4. Time course of absorbance change averaged across all subjects (n=5)...22
Figure 3.5. Radial time space plots………..………....24
Figure 3.6. Time course of absorbance change surrounding the ROI across all subjects (n=5)…….………..……….………25
Figure 3.7. Correlation maps for amplitudes of 50 (left) and 400 (right) microns..……27
Figure 3.8. Spatial plots of activity evoked by low (50mm) and high (400mm) amplitudes of stimulation………...29
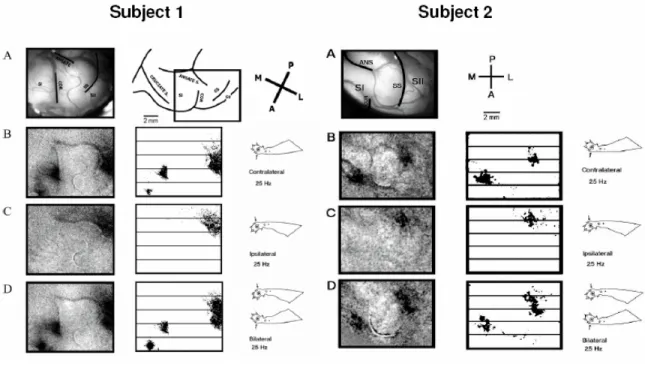
Figure 4.1. OIS response evoked by flutter stimulation of the thenar pad in two subject……….………..…38
Figure 4.2. Optical responses recorded in cat SI and SII to 25 Hz vibrotactile stimulation of the forepaws………...………41
Figure 4.3. Surface plots of absorbance evoked in SI by contralateral, ipsilateral, and bilateral stimulation……….………..….43
Figure 4.4. Time course of the absorbance change within the region of interest (ROI) in SI….……….……..44
Figure 4.5. Comparison of averaged normalized absorbance values (n=5) evoked under 3 different stimulus conditions……….………..………45
Figure 4.6. Optical responses in cat SI and SII to 25 Hz vibrotactile stimulation of the central pad in 2 subjects………..…...…47
Figure 4.7. Time course of the absorbance change in the anterior and posterior SII cortical regions evoked by flutter stimulation of the central pad in 2 subjects…….………..…48
Figure 4.8. Cluster plots of ipsilateral vs. contralateral response of 2 subjects………...49
Figure 5.2. Absorbance time course in one subject………...………..……63
Figure 5.3. Across-subjects absorbance time courses………...……...64
Figure 5.4. Maps of correlated activity in two exemplary subjects…...66
Figure 5.5. Radial absorbance trends across subjects (n=5)………...…...68
Figure 5.6. Surround Anisotropy Plots (SAPs) for one exemplary subject………….…70
Figure 5.7. Time course in medial/posterior region of surround………..…...……72
Figure 5.8. Surround Anisotropy Plots (SAPs) for two different stimulus sites in the same subject……….……….………..74
Figure 5.9. Corresponding skin sites to locations of strongest suppression…………....76
Figure 6.1. OIS images in sensorimotor cortical slices during perfusion with normal ACSF and after application of 2mmol bicuculline methiodide (BMI)...…...85
Figure 6.2. OIS images in cortical slices before and after perfusion with the NMDA antagonist D-AP5……….……..………88
Figure 6.3. Differential effects of GABAA block with BMI and NMDA block with D-AP5 on the distribution of activity in layer 2/3…….……….…...90
Figure 6.4. Recordings of local field potential across layer 2/3……….…….93
Figure 6.5. Distribution of local field potential across layer 2/3 in coronal and sagittal slices..……….……... ………..96
CHAPTER 1: Introduction
Traditionally, primary somatosensory cortex (SI) has been depicted as a stage of
the central nervous system that relays with only minor transformation, somatosensory
information to higher centers that carry out the higher-order processing required for
perception and discrimination. In this scenario, the SI cortical network displays little to
no dynamics in response to transient stimuli, but instead produces a predictable response
which is not significantly affected by nearby sensory inputs or the network’s short term
sensory history (Hubel and Wiesel 1962; Ferster 1992). Opposition to this viewpoint
considers activity in SI as more significantly impacted by the intrinsic intracortical
circuitry. In this case, thalamic input serves as a general framework for which cortical
territories are activated but the more diverse activity patterns which arise can be mostly
attributed to feedback excitation and inhibition from the complex intracortical network
(Ahmed et al. 1994; Douglas et al. 1995; Somers et al. 1995). Recent studies in support
of this view have shown that corticocortical synapses in fact greatly outnumber
thalamocortical synapses (Ahmed et al. 1994; Douglas et al. 1995). To this end, the
extensive lateral arborization of the cortex suggests that responses both in single neurons
and populations of neurons are capable of modification by inputs to cortical sites which
may be spatially remote.
Recent studies have shown that single SI neurons do in fact exhibit significant
temporal dynamics when exposed to more prolonged periods of stimulation (Lee and
and receptive field mapping experiments gave the first evidence of a time-dependent
process involved in the formation of somatosensory cortical activity patterns (Whitsel
and Juliano 1984; Whitsel 1987; Tommerdahl 1989). Discrepancies in the results of these
experiments conducted with contrasting methodologies led to the investigation into the
response of SI cortex to repetitive stimulation and the possible role that cortical dynamics
played in SI pattern formation. These studies (Diamond et al. 1986; Whitsel 1987;
Whitsel and Kelly 1988; Whitsel et al. 1989; Whitsel and Franzen 1989) revealed that the
initial cortical response to a tactile stimulus is not the selective activation of a relatively
few, highly tuned neurons, but rather a complex spatio-intensive pattern of activity
involving very large numbers of neurons. With repetitive stimulation, this extensive and
less differentiated initial activity pattern becomes rapidly sculpted by a dynamic cortical
inhibitory mechanism into a more stimulus-specific spatiotemporal pattern. The spatial
sharpening of the cortical response by lateral inhibition is one example of a dynamic
process in SI.
Multiple animal studies have demonstrated that repetitive stimulation is reliably
coupled with systematic reductions in neuronal responsivity at both peripheral and central
levels of the somatosensory nervous system. For example, such stimulation is
accompanied by a sustained decrease of the responsivity of skin mechanoreceptors
located in the vicinity of the stimulated skin region (Leung 1995), a long-lasting
depression of the responsivity of neurons in the cuneate nucleus of the brainstem
ipsilateral to the stimulus site (OMara et al. 1988), a decrease in the thalamic and cortical
Juliano et al. 1983; Kleinfeld and Delaney 1996; Tommerdahl and Whitsel 1996a;
Tommerdahl et al. 1999a). Reduction in the spatial extent of the responding population
in SI is presumably caused by mechanisms of surrounding cortical inhibition in regions
remote from maximally stimulated neurons. This has been directly shown in the rat
barrel cortex at the population level using voltage sensitive dyes (Kleinfeld and Delaney
1996; Derdikman et al. 2003) and with single cell recordings(Brumberg et al. 1996). The
presence of SI surround inhibition associated with repetitive stimulation has also been
suggested by imaging studies which have used the optical intrinsic signal (OIS).
Although the intrinsic signal is an indirect measure of neuronal activity, many studies
have demonstrated a decrease in signal strength to levels below tonic activity in
surrounding regions of cortex, which has been suggested to reflect underlying inhibition
(Tommerdahl et al. 1999a; Simons et al. 2005; Simons et al. 2007). The importance of
surround inhibition in normal cortical function is poorly understood. One view has been
that intracortical inhibition is nonspecific and serves to maintain the ability of neurons to
selectively respond to stimuli which maximally drive them (Somers et al. 1995). Another
possibility is that surrounding inhibition exists to suppress the response of neurons which
are more weakly activated by intracortical lateral excitatory connections (rather than
directly by thalamocortical connections). In this case, the function of such lateral
inhibition in SI could be the precise localization of responses to more specific cortical
sites for the purpose of behaviors involved in spatial discrimination. This type of
mechanism could be particularly important in regions of SI which represent the hand,
because of its large role in tactile sensibility and its superior spatial discriminative
The majority of studies which have examined primate SI have used the glabrous
hand as the principal site for sensory input, primarily because of the expansive cortical
territory that is devoted to its representation, and also because in most primates this
region occupies a highly accessible territory (i.e. not buried in a sulcus in cerebral
cortex). In primates, the glabrous hand is the primary means for not only tactile
exploration of the environment but also for voluntary manipulations (such as gripping
objects) of this environment. Completion of tasks involving grip requires not only the
coordination of movement but also the continuous incorporation of sensory feedback.
Similar to the rest of the body the glabrous hand is mapped in a highly orderly manner in
SI. However, unlike processing of tactile information from almost all other regions of the
body (i.e. trunk, forearm, legs), proper interpretation of tactile input from the hand likely
requires the integration of information from any number of skin sites that function
cooperatively during tactile exploration. For this reason, the selective dynamic
interaction of multiple cortical regions in SI representing functionally interconnected sites
on the hand seems not only plausible, but almost likely. Understanding cortical dynamics
in normal functioning cortex is necessary to the subsequent comprehension and treatment
of illnesses which originate from cortical dysfunction such as autism and schizophrenia.
Additionally, if the activity in SI is significantly impacted by intracortical dynamics it
could in turn affect the way in which dynamics are viewed across multiple sensory
CHAPTER TWO: Experimental Methods In Vivo Methods
Squirrel monkey preparation
All methods and procedures involving the use of squirrel monkeys are consistent
with USPHS policies and guidelines on animal care and welfare in biomedical research.
They were reviewed and approved by an institutional committee prior to initiation of the
experiments. Squirrel monkeys were used as subjects in studies aimed at the specific
characterization of responses in primary somatosensory cortex (SI). Due to the large
region of SI which is accessible for imaging (on the surface) as well as the fact that the
primate representation of the glabrous hand in SI is extensive, squirrel monkeys make
excellent subjects for investigating the response in SI. Following induction of anesthesia
with 4% halothane in a 50/50 mix of nitrous oxide (N2O) and oxygen, the trachea was
intubated. A veterinary anesthesia machine (Forreger Compac-75) provided an anesthetic
gas mix whose composition could be adjusted (typically 1.5 –3.0% halothane in 50/50
N2O/oxygen) to maintain a stable level of surgical anesthesia. Methylprednisolone
sodium succinate (20 mg/kg) and gentamicin sulfate (2.5 mg/kg) were injected
intramuscularly to lessen the probability of halothane-induced cerebral edema and
prevent bacterial septicemia, respectively. Placement of a valved polyethylene catheter
into a superficial hindlimb vein enabled administration of 5%glucose, 0.9%NaCl, and
A 1.5 cm opening was trephined in the skull overlying SI cortex. A recording
chamber (25 mm i.d.) was placed over the opening and cemented to the skull with dental
acrylic. Wound margins were infiltrated with local anesthetic, closed with sutures and
bandaged, and the dura overlying SI was resected. After the completion of all surgical
procedures subjects were immobilized with norcuron (loading dose 0.25 - 0.5 mg/kg, i.v.;
maintenance dose 0.025 – 0.05 mg/kg/hr). From this point on, the animal was ventilated
with a 50/50 mix of N2O and oxygen and the concentration of halothane was adjusted
(typically between 0.5 and 1.0%) to maintain heart rate, blood pressure, and the EEG at
values consistent with general anesthesia. Rate and depth of ventilation were adjusted to
maintain end-tidal CO2 between 3.0 and 4.5%. Under these experimental/anesthetic
conditions both SI neuron spontaneous and stimulus-evoked spike discharge activity
patterns are highly reproducible over even prolonged (>1 hr) time periods.
Cat preparation
Cats were used as subjects in experiments involving acquisition of optical data
from secondary somatosensory cortex (SII), as well as bilateral studies of SI activity.
The decision to use cats as subjects was made due to the large region of SII which lies
exposed on the pial surface of the cortex, making it easy to image. All surgical
procedures were carried out under deep general anesthesia (1 - 4% halothane in a 50/50
mixture of oxygen and nitrous oxide). After induction of general anesthesia the trachea
was intubated with a soft tube and a polyethylene cannula was inserted in the femoral
vein to allow administration of drugs and fluids (5% dextrose and 0.9% NaCl). For each
dura overlying anterior parietal cortex was incised and removed. Following the
completion of the surgical procedures all wound margins were infiltrated with
long-lasting local anesthetic, the skin and muscle incisions were closed with sutures, and each
surgical site outside the recording chamber was covered with a bandage held in place by
adhesive tape.
Subjects were immobilized with Norcuron and ventilated with a gas mixture (a
50/50 mix of oxygen and nitrous oxide; supplemented with 0.1 - 1.0% halothane when
necessary) delivered via a positive pressure respirator 1-3 hours prior to the data
acquisition phase of the OIS imaging experiments. Respirator rate and volume were
adjusted to maintain end-tidal CO2 between 3.0 - 4.0%; EEG and autonomic signs (slow
wave content; heart rate, etc.) were monitored and titrated (by adjustments in the
anesthetic gas mixture) to maintain levels consistent with light general anesthesia. Rectal
temperature was maintained (using a heating pad) at 37.5 °C.
Euthanasia was achieved by intravenous injection of pentobarbital (45 mg/kg) and
by intracardial perfusion with saline followed by fixative (10% formalin). Following
perfusion fiducial marks were placed to guide removal, blocking, and subsequent
histological sectioning of the cortical region studied. All procedures were reviewed and
approved in advance by an institutional committee and are in full compliance with
current NIH policy on animal welfare.
Imaging Protocol in vivo
After obtaining an image of the exposed cortical surface, the recording chamber
was filled with artificial cerebrospinal fluid and hydraulically sealed using a clear glass
or Cascade 512b from Roper Scentific), light source, guide and filters required for
near-infrared (833 ± 15 nm) illumination of the cortical surface, a focusing device, and a
recording chamber capped by an optical window. Images of the exposed anterior parietal
and surrounding cortical surface were acquired 250 ms before stimulus onset (‘‘reference
images’’) and continuously thereafter for 9.75 sec after stimulus onset (‘‘poststimulus
images’’) at a rate of one image every 250 msec. Difference images were generated by
subtracting the reference image from each post-stimulus image. Averaged difference
images typically show regions of both increased light absorption (decreased reflectance)
and decreased light absorption (increased reflectance), which are believed widely
(Grinvald 1985; Grinvald et al. 1991; Grinvald et al. 1991) to be accompanied by
increases and decreases in neuronal activation, respectively.
All images were examined prior to their inclusion for analysis. Images containing
random high amplitude noise were excluded, and the remaining trials (typically 10-15
were averaged to improve the signal to noise ratio. Images were analyzed using custom
routines written in Matlab. Computational methods for analysis of the optical data varied
depending on the experimental goal and will thus be described in later sections in which
they were used.
Histological procedures/identification of cytoarchitectural boundaries
At the conclusion of each experiment (in vivo), the imaged cortical region was
removed immediately following intracardial perfusion with saline and fixative. The
region then was blocked, postfixed, cryoprotected, frozen, sectioned serially at 30 µm,
300 µm and were plotted at high resolution using a microscope with a drawing tube
attachment. The resulting plots then were used to reconstruct a two-dimensional surface
map of the cytoarchitectonic boundaries within the region studied with optical and
neurophysiological recording methods. The locations of microelectrode tracks and
electrolytic lesions evident in the histological sections were projected radially to the pial
surface and transferred to the map of cytoarchitectonic boundaries reconstructed from the
same sections. As the final step, the cytoarchitectonic boundaries (along with the
locations of microelectrode tracks and lesions whenever present) identified in each brain
were mapped onto the images of the stimulus-evoked intrinsic signal obtained from the
same subject, using fiducial points (made by postmortem applications of india ink or
needle stabs) as well as morphological landmarks (e.g., blood vessels and sulci evident
both in the optical images and in histological sections). Locations of cytoarchitectonic
boundaries were identified using established criteria (Powell and Mountcastle 1959a;
Jones and Porter 1980; Sur et al. 1982).
In vitro preparation
Young adult (21 – 35 day old) wistar rats were used as subjects. Subjects were
immobilized using a conical soft plastic enclosure and decapitated. The whole brain was
excised and immediately transferred to ice cold artificial cerebrospinal fluid (ACSF;
NaCl replaced by sucrose). Composition of ACSF was (in mM) 124 NaCl, 3.0 KCl, 2.5
CaCl2, 25NaHCO3, 1 MgSO4, 1.25 NaH2PO4, and 10 glucose. The hindbrain was cut
away using a straight razor blade and the left and right hemispheres were separated.
Special care was taken to ensure that sections were taken from the region of the brain
using an oscillating tissue slicer (OTS-4000, Electron Microscopy Sciences) and placed
in a reservoir containing warmed (30°C) and oxygenated (using a 95% O2 – 5% CO2 gas
mix) ACSF. Slices remained in the reservoir a minimum of 1 hour prior to being
transferred (via pipette) into the recording chamber. While in the recording chamber
slices were held in place using a fine nylon mesh and continuously perfused at a rate of
2-3 ml/min with oxygenated ACSF at room temperature. In experiments in which GABAA
block was performed bicuculline methiodide was added to the ACSF at a final
concentration of 2µM and perfused normally. Stimulation was stopped for 10 minutes to
allow for complete perfusion.
In vitro OIS and stimulation protocol
Slices were transilluminated using unfiltered light from a halogen light source
(Oriel) and images were obtained at 2x magnification using an inverted microscope
(Diaphot 200, Nikon) and a cooled CCD camera (Quantix 5714, Photometrics). Images
were acquired continuously for 4s before stimulus onset and 11s following stimulus onset
(15s total acquisition time) at a rate of 2 fps. Difference images were generated by
subtracting the first image acquired from each subsequent image. Acquisition of a full 4s
of pre-stimulus data allows for easy demonstration of baseline levels before stimulus
delivery. Stimulation was delivered using a 50µm tip bipolar electrode at the layer
VI/white matter (WM) border. The standard stimulus for evoking an OIS was delivered
with a current amplitude of 150-200µA at a frequency of 20Hz for 1 second using a
programmable pulse generator (Master A; AMPI).
Measures of neural population electrical activity were made using a glass
micropipette pulled with a vertical puller (Narishige PP-83) and filled with 1-2M NaCl.
The micropipette was positioned on the surface of layer 2/3 and responses to single pulse
(0.2 ms duration, 1.5x threshold) stimulation were recorded at a number of closely spaced
locations (across layer 2/3) in order to obtain a spatial profile of the activity evoked by
single site stimulation at the layer VI/WM border. At each location a series of 10 single
pulses were delivered (ISI of 10 seconds) and responses were averaged. Recordings were
sampled at 20 kHz, amplified and bandpass filtered (10-300 Hz) before being stored and
analyzed (pClamp 6.0; Axon Instruments). Typical field potential recordings reflect both
subthreshold and spiking activity of local neurons and contain elements of presynaptic
CHAPTER THREE: SI Response to Changes in Stimulus Amplitude Background
The way in which stimulus intensity is represented in primary somatosensory
cortex has remained an intriguing question in the study of cortical correlates of
perception. Although there have been numerous studies of somatosensory cortical
response to changes in stimulus intensity, few have focused on the population response of
the cortex with regard to this subject. Thus, a dearth of information about the cortical
network response to changes in stimulus intensity exists – current knowledge of the
subject depends predominantly on reconstruction of predictions of the cortical response
from afferent recordings (Werner and Mountcastle 1965; Johnson 1974; Connor et al.
1990; Whitsel et al. 2000; Guclu and Bolanowski 2002) and single unit cortical
recordings(Mountcastle et al. 1963; Simons 1978). Very few studies have examined the
population response of the somatosensory cortex to varying stimulus intensity at
resolution sufficient to provide details of cortical response that would provide
information necessary to increase understanding about the primary somatosensory
network dynamics involved in processing stimuli of different intensities.
A number of studies have examined the population response with imaging
techniques such as fMRI (functional Magnetic Resonance Imaging) (Arthurs et al. 2000;
of cortex could be correlated with increases in stimulus intensity. These studies
predicted that amplitude could be coded for by not only the average firing rates but also
by the total aggregate of responding neurons. However, although each of these imaging
techniques uses measures which are indirectly related to neuronal activity, the resolution
is limited in two important ways. First, it is difficult to determine the nature of the
neuronal activity being imaged (whether or not it is excitatory or inhibitory) and second,
fMRI and MEG studies have limited spatial resolution, which is typically on the order of
~1mm2 (Arthurs et al. 2000; Backes et al. 2000; Iguchi et al. 2002; Torquati et al. 2002;
Nelson et al. 2004).
Recently, Chen and colleagues used the intrinsic signal to demonstrate that a
proportionally greater response (magnitude) is evoked in SI cortex of squirrel monkeys as
the amplitude (as measured by force) of a flutter stimulus is increased (Chen et al. 2003).
However, the primary focus of their report was that the response to simultaneous
stimulation of multiple adjacent sites on the skin produced a smaller, more intense region
of cortical activation than would be normally predicted by summation of the two, and
their findings did not detail the effects of amplitude on the dynamics of the population
response to a flutter stimulus at a single locus on the skin. In this report, we extend the
aforementioned work by imaging the optical intrinsic signal (OIS) evoked in primary
somatosensory cortex (SI) of squirrel monkeys to a range of amplitudes of flutter
stimulation. Our results suggest that large amplitude stimuli evoke patterns of
proportionally higher absorbance, which although more intense, do not occupy a larger
cortical territory than responses evoked by smaller amplitude stimuli. These spatially
suggesting the presence of an inhibitory zone which may contribute to the cortical
processing of stronger stimuli.
Analytical Methods
Imaging and Stimulus Protocol
In each of five experiments, the OIS evoked in SI by cutaneous flutter (25 Hz)
stimuli on the thenar region of the forelimb was recorded. The flutter stimulus was
delivered at 50, 100, 200 and 400µm and was interleaved in order to prevent conditioning
of the response. Images of the exposed anterior parietal and surrounding cortical surface
were acquired 200 ms before stimulus onset (‘‘reference images’’) and continuously
thereafter for 22 s after stimulus onset (‘‘poststimulus images’’) at a rate of one image
every second. Exposure time was 200 ms.
Spatial Histogram
Difference images acquired from the time of stimulus onset to 5 seconds after
stimulus offset were summed and their activity characterized using linear segmentation.
The activity was measured along a line through the region of interest in 200 x 40 µm bins
and plotted as a function of their distance along the line. Such segmented analysis
typically produces a Gaussian profile of absorbance values with the local maximum
corresponding to the center of the ROI.
Correlation Maps
Correlation maps were constructed for comparison of spatial characteristics of the
OIS response. This method of analysis has been previously described in detail
reflectance value of each pixel (i , j) and the average reflectance value within the
reference region over the time from stimulus onset to stimulus offset. The region selected
as the reference was defined by a boxel (π mm2 area) centered on the region of interest
(ROI). Each pixel ( i , j ) on the correlation map is represented by a coefficient of
determination r2ij ( -1 < r2< 1; - 1 indicates negative correlation; + 1 indicates positive.
The statistical significance of each of the correlations was tested with an independent
samples t-test.
Results
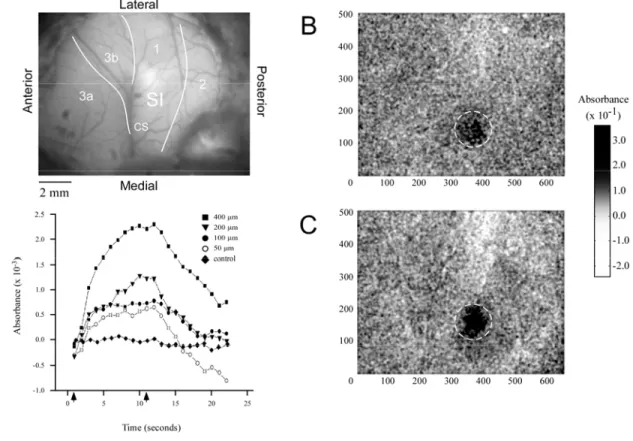
Figure 3.1 illustrates typical examples of the intrinsic signal detected in SI of
three different subjects (A-C) in the absence of stimulation (control), and during low
(50µm) versus high (400µm) amplitude stimulation. Each image shown in Figure 3.1
represents the sum of frames taken from the time of stimulus onset to 5 seconds after
stimulus offset (frames 1-16). Areas of high absorbance are indicated by dark patches
within each image; regions of high absorbance in each case correspond to the SI locus
that represents the stimulated site on the skin. In each of the three subjects the increase in
absorbance within the region of interest (ROI) in SI detected under the 400µm condition
was larger than that measured under the 50µm condition. Moreover, in each subject the
increase in absorbance appears more evenly distributed and less diffuse throughout the
Figure 3.1. OIS response to low vs. high amplitude stimulation. Paired OIS images taken from three
experiments (A, B, C). All images are anatomically oriented as shown in top left green filter image;
location of central sulcus (CS) as well as cytoarchitectonic boundaries are drawn in and relevant
cortical areas (1, 2, 3a, 3b) are labeled. Images were obtained by averaging across 10 experimental
trials and then summing frames taken from the time of stimulus onset to 5 seconds after stimulus offset
to better show regions of activation indicated by dark pixels (gray-scale bar at bottom left). The left
column represents responses measured at the 50 µm stimulus amplitude while the right column shows
the same respective experiment with a stimulus amplitude of 400 µm.
Spatial histograms were constructed in order to allow identification of the
boundaries of the SI regions that underwent an increase in absorbance in response to skin
flutter stimulation. Figure 3.2 illustrates the average results obtained from all
the top panel. Pixels along the line were binned (bin size 40 x 200 µm) and absorbance
values averaged and plotted as a function of distance along the line. The plots
demonstrate that at all amplitudes of stimulation, the spatial extent of the region of
above-background absorbance (ie. absorbance values larger than control) is similar and at
every stimulus amplitude occupies a circular-shaped territory in SI between 1.8 – 2.24
mm in diameter. The ROI (to be used for further analysis) was therefore defined as the
region displaying above background levels of absorbance within the activated region of
SI.
Figure 3.3 demonstrates the method used to evaluate the time course of the
stimulus-evoked SI absorbance change in one exemplary subject. Panel A shows an
image of the cortical surface which highlights the cortical vasculature. Panels B&C
demonstrate the OIS responses evoked by the low (50µm) and high (400µm) stimulus
amplitudes respectively. The ROI is the circular territory enclosed by the dashed white
lines. Absorbance values within the ROI were averaged for each amplitude of stimulation
and plotted as a function of time. The time course of the absorbance values measured
between 1 and 22 sec after stimulus onset is plotted for each of the stimulus conditions,
and in the absence of stimulation (“control”). Arrows along x-axis of plots at bottom left
of Figure 3.3 indicate stimulus onset (1 sec) and stimulus offset (11 sec), and reveal how
absorbance increased with increasing amplitude of stimulation. For each stimulus
Figure 3.2. Spatial histograms of activity at different amplitudes. Absorbances were measured at each
amplitude along the red line shown in the OIS image at top left. Anatomical orientation for the image
is shown in the green filter image shown to the right; location of central sulcus (CS) as well as
cytoarchitectonic boundaries are drawn in and relevant cortical areas (1, 2, 3a, 3b) are labeled. Each
plotted value represents an average of pixels spanning 200 µm above and below the line and a distance
of 40 µm along the line (total bin size was 40 x 400 µm). The control condition is plotted on each
graph to indicate levels of above and below background absorbance. Dashed lines on plots indicate
where stimulus evoked activity crosses background absorbance levels (indicating the boundaries of
above background absorbance). Histograms indicate no significant change in cortical territory
displaying above background absorbance with respect to stimulus amplitude.
The analytical approach illustrated in Figure 3.3 was performed on the data
obtained from all subjects (n=5) and the resulting absorbance plots were averaged (Figure
3.4). All data were normalized prior to averaging. Similar to Figure 3.3, the plots in
Figure 3.4 demonstrate that SI absorbance increases with increasing stimulus amplitude.
To quantify this relationship a measure of ∆Absorbanceevoked was used.
∆Absorbanceevoked was defined as the difference between the absorbance measured at 1
sec (prior to stimulus onset) and 11 sec (point of stimulus offset) - shown in the plot at
the bottom of Figure 3.4. The plot of ∆Absorbanceevoked vs. amplitude is well described
(coefficient of determination R2=0.9921) by the linear function (solid line)
∆Absorbanceevoked = (4 x 10⁻⁶)*d + 0.0005. This type of analysis, however, gives little or
no information about the spatial properties of the response.
Radial histograms were constructed to better visualize the spatiotemporal
From the ROI center (as determined by spatial histogram analysis), average absorbance
values were determined for the pixels within concentric rings located at progressively
larger
Figure 3.3. Absorbance time course and anatomical registration in SI. A) Green filter image of SI
cortex in vivo, used for anatomical registration of OIS images. Location of central sulcus (CS) as well
as cytoarchitectonic boundaries are drawn in and relevant cortical areas (1, 2, 3a, 3b) are labeled.
B&C) Resulting OIS image obtained from averaging across 10 experimental trials and then summing
frames taken from the time of stimulus onset to 5 seconds after stimulus offset: B) at stimulus
amplitude 50 µm, C) at 400 µm. Absorbance values are indicated by gray-scale bar at right. Dashed
circles enclose the ROI within SI. Bottom left) Graph of the averaged optical response measured within
the ROI. Arrows indicate time of stimulus onset (1s) and stimulus offset (11s). Measurements were
distances from the center at each frame acquired. Absorbance values are color coded (red
areas indicate high absorbance; blue areas indicate low absorbance) and plotted as a
function of time and radial distance from the center of the ROI. Figure 3.5 demonstrates
that the major differences that exist in the SI global responses to different amplitudes of
stimulation are differences in the magnitude of absorbance, but not in the spatial
properties of the absorbance pattern (this also is apparent in the spatial histogram analysis
of Figure 3.2). As would be expected based on the absorbance curves shown in Figures
3-3 & 3-4, higher stimulus amplitudes evoked a more intense and discrete region of
increased absorbance than did the lower amplitudes. Interestingly, one of the more
robust differences between low- and high-amplitude stimulation, is the magnitude of
decreasing absorbance detected in the territory that surrounds the region in which
absorbance increases. This response is most pronounced under the 400µm condition
where it can be seen to occur much sooner after stimulus onset at radial distances as small
as 1.5mm from the ROI center. Spatially, the regions of above- and below-background
absorbance are nearly the same at each stimulus amplitude, with the above-background
portion extending nearly 1mm away in all directions from the center of activity, whereas
the below-background portion of the response comprises a ring beginning at a radial
distance of 1.5mm from the ROI center and extending out beyond the area that was
Figure 3.4. Time course of absorbance change across all subjects (n=5). (Top) Plots of average
absorbance and standard deviation. All data was normalized prior to being averaged. Plotted
absorbances were measured within the ROI which was defined as all pixels within a 1mm radius of the
center of activation which was defined empirically. Control conditions in which no stimulus was
administered are plotted simultaneously for comparison to test conditions. (Bottom) Plot of
∆Absorbanceevoked which was defined as the change in absorbance measured from frame 1 (prior to
stimulus onset) to frame 11 (point of stimulus offset). The plot is fit with a linear function (solid line)
described by the equation A = (4 x 10⁻⁶)d + 0.0005 where A is absorbance and d is stimulus amplitude
(displacement). Coefficient of determination for the linear regression (R2) is also shown.
Using similar techniques to those we used to analyze above-background activity
in the ROI (as in Figures 3-2 & 3-3), regions outside the designated ROI were examined
to determine whether a similar amplitude-dependency could be established for the time
courses of the below-background absorbance observed in the surround. Figure 3.6 shows
plots constructed from averaging the absorbance values in pixels lying 1.5 – 2 mm away
from the center of the ROI. Data were normalized and then averaged across experiments
(n=5). It is apparent that the time courses at different amplitudes of stimulation are
different with respect to the stimulus timing, (compared with above background levels of
activity, all of which show maximum absorbance at the point of stimulus offset).
Consequently, a different measure was adopted to quantify this relationship: In this case
∆Absorbancemax was defined as the difference between the minimum absorbance and the
maximum absorbance value obtained at any point during the recording. Interestingly, the
relationship between stimulus amplitude and ∆Absorbancemax in the surround is not linear
(Figure 3.6b). Instead, each of the higher stimulus amplitudes employed (100-400µm)
between each of the curves shown in 3-6a is the time required to reach the peak of the
decrease in absorbance. That is, as amplitude is increased from 100 to 400µm the point
of minimum absorbance was attained earlier in time. This same result also is apparent in
Figure 3.4.
Figure 3.5. Radial time space plots. Radial histograms were performed on OIS data at all stimulus
amplitudes. Radii were measured from the center of activation chosen empirically and held constant
over each amplitude as demonstrated by panel at top-left. The dashed blue line is the maximum radial
distance used in the maps shown. The schematic at bottom left indicates the anatomical orientation of
the cortex in the OIS image above. Absorbance values in maps shown represent an average at each
radial distance for each second in the recording. Green arrows indicate stimulus onset (1s) while red
arrows indicate stimulus offset (11s). All graphs were normalized over the spectral range of the entire
Figure 3.6. Absorbance trends surrounding the ROI across five experiments. (Top) Plots of
absorbance and standard deviation averaged across all experiments (n=5). Plotted absorbances were
measured at radial distances between 1 and 1.5mm away from the center of activation (defined earlier).
(Bottom) Plot of the maximal change in absorbance (absolute value) as a function of stimulus
amplitude. The linear trend, obtained from averaged absorbances, measured at the ROI (dashed line
from figure 3) has been plotted alongside to demonstrate the significant differences between the two
regions.
Correlation maps were constructed to further characterize the spatial properties of
the SI response to 25 Hz flutter. A correlation map compares every pixel in the image
with the signal referenced from the ROI, and assigns a coefficient of determination (r2) to
the location of the pixel being compared. This gives a fairly good approximation of the
signal at all locations in the image. Since there is no significant difference in the spatial
properties between stimuli at intermediate amplitudes (as demonstrated by radial and
spatial histograms) only the 50 and 400µm amplitudes will be compared with this
technique. Figure 3.7 shows correlation maps of the OIS responses to stimulus
amplitudes of 50 and 400µm (Top panels). The bottom panels of the figure show the
input signal (solid dark red line) used for correlation of each pixel in the map, and the
negative (opposite) of the input signal (dotted blue line). A coefficient of determination
of +1 (although it never appears in the map) indicates that a pixel’s time course perfectly
matches the input signal while a coefficient of determination of –1 indicates that pixel’s
time course perfectly matches the opposite of the input signal (dotted blue line). At
pronounced and well-defined positive correlation within the ROI that is more evenly
distributed throughout the ROI. A large region of negatively correlated activity
(corresponding to strong below background activity) surrounds the ROI in the
Figure 3.7. Correlation maps for stimulus amplitudes of 50 (left) and 400 (right) microns. The entire
field of view is correlated with the selected ROI (shown in OIS image at top-left encircled by dashed
line). The schematic at top-right indicates the anatomical orientation of the OIS image as well as all
maps: A-anterior, M-medial, P-posterior, L-lateral. Color bars show correlation coefficient values for
each map. The correlated signal, obtained from averaging of absorbance values within the ROI at each
frame, is shown under each map. Only the portion of the signal enclosed within the dashed lines
(corresponding to the stimulus duration, green-on, red-off) is correlated. A correlation of +1 would
correspond to the signal shown in dark red while a correlation of -1 would correspond to the signal in
dark blue.
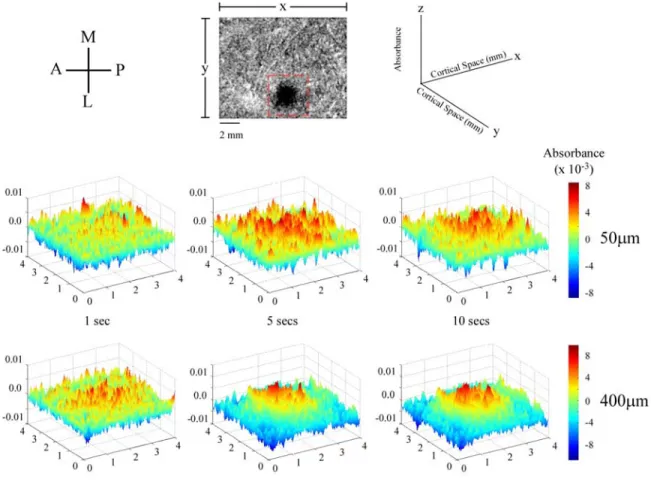
To examine the spatial dynamics of the SI response in more detail we examined
the patterns of activity generated by low- and high-amplitude stimulation in a 16mm2
(4x4) area centered around the ROI. Figure 3.8 demonstrates the patterns of activity
evoked at three time intervals during the delivery of the stimulus. The 3D surface plots
show activity measured within the boxel indicated by the dashed box in the image at the
top. In each 3D plot absorbance is plotted in two-dimensional space and is indicated by
two measures: height of the peak along the z-axis (as shown in the schematic at the top
right), and the color (indicated by the color bar to the right of each row of 3D plots).
These data make it apparent that after a short period of stimulation (1 sec) the activity
pattern is very similar for the different amplitudes. That is, at this early time interval both
patterns are diffuse and occupy much of the ROI. However as stimulus duration
increases, the pattern of increased absorbance evoked by high-amplitude stimulation
tends to become restricted to the center of the ROI and within this region becomes
Figure 3.8. Spatial plots of activity evoked by low (50µm) and high (400µm) amplitudes of
stimulation. The schematic at the top-left indicates the anatomical orientation of the cortex: A-anterior,
M-medial, P-posterior, L-lateral. Absorbances were measured within the voxel shown in the
top-middle panel. The schematic (top-right) shows how each frame is spatially represented with respect to
the voxel of interest. Both stimulus amplitudes are mapped 1, 5 and 10 seconds after the onset of the
stimulus. Absorbance values at each pixel (x,y location) are represented two fold both by their height
along the z-axis and by their color. Each stimulus amplitude displays similar dimensions of activated
cortical space at each frame. However within the activated area the pattern of activated pixels displays
significant dynamics over time as does the activity in the surrounding regions.
high-amplitude surface plots were 0.1415 and 0.1166 respectively. Average standard
deviation across all sets of maps (n=5) differs very little from these values (0.1448 at low
high-amplitude (but not low-high-amplitude) stimulation the territory surrounding the ROI becomes
dominated by below-background changes in absorbance.
Discussion
This series of experiments evaluated the global response of contralateral SI cortex
to different amplitudes of flutter stimulation by imaging the optical intrinsic signal (OIS).
The OIS indirectly reflects both cortical neuronal spike discharge activity and the local,
subthreshold changes in neuronal membrane potential evoked by sensory stimulation
(MacVicar and Hochman 1991; Holthoff and Witte 1996; Kohn et al. 2000). As a result,
the observed tendency for absorbance in the same localized region of area 3b to increase
with increasing stimulus amplitude (Figures 3-3 & 3-4) most likely is due to the
amplitude-dependence of the average firing rate of neurons in the same region (Whitsel et
al. 2003). An increase in SI absorbance in response to an increase in vibrotactile stimulus
intensity has been reported previously by Chen et al (Chen et al. 2003). The observed
increase in the stimulus-evoked SI OIS that accompanies increases in stimulus amplitude
is well described by a linear function.
One important distinction between previous work done using the OIS and the
present study is the use of infrared light for illumination during acquisition of the OIS.
The OIS obtained using infrared light has been shown to be highly correlated with light
scattering effects that accompany astrocyte swelling subsequent to the clearance of
extracellular K+ and neurotransmitter (Holthoff and Witte 1996; Kohn et al. 2000; Lee et
al. 2005) and local increases in blood volume (Frostig et al. 1990; Ba et al. 2002).
compared to the contributions of light scattering effects (Ba et al. 2002). Additionally,
OIS imaging using near-infrared illumination not only minimizes the contributions of
artifacts introduced by changes in the vasculature (which can dominate the OIS at lower
wavelengths) (Frostig et al. 1990), but the time course of the OIS detected at shorter
wavelengths (600 nm) is markedly different (shorter) than the protracted OIS observed in
this study (Frostig et al. 1990; Kohn et al. 2000; Chen et al. 2003).
Previous studies from our laboratory have reported that the SI optical response
evoked by an extended period (>1 sec) of flutter stimulation not only consists of an
increase in absorbance in the region that receives its input from the skin site that was
stimulated, but also decreases in absorbance (frequently to levels well
below-background) that occur in the surrounding cortex (Tommerdahl et al. 2002). The present
study demonstrates that the below-background component of the SI optical response to
flutter stimulation is particularly evident at large stimulus amplitudes (figures 3-5, 3-7 &
3-8). However, unlike the increase in absorbance evoked by flutter, the relationship
between the magnitude of the stimulus-evoked decrease in absorbance and stimulus
amplitude is not satisfactorily described by a linear function. Indeed, the results shown in
Figure 3.6 suggest that this component of the optical response to skin flutter (the decrease
in absorbance) is either absent or extremely small at small stimulus amplitudes, but once
stimulus amplitude exceeds an intensity sufficient to evoke it, it then remains maximal or
near-maximal even though amplitude is further increased across a wide range of values.
Interestingly, the stimulus-evoked decrease in absorbance that occurs in the surround of
ROI); in addition, as amplitude is increased it tends to develop at a progressively earlier
time after stimulus onset.
The correlation maps shown in Figure 3.7 provide a comprehensive overview of
the time course of absorbance at each location in the image. The optical signal at each
pixel is cross-correlated with a known input signal. In this case, it is the average
absorbance measured within the ROI. The assigned coefficient of determination
indicates the degree of similarity between a pixel’s time course of absorbance and the
input signal. Therefore pixels with a large positive correlation undergo increases in
absorbance very similar to the input signal, while pixels with a large negative correlation
undergo a decrease in absorbance which more closely resembles the opposite (negative)
of the input signal. Figure 3.8 suggests that at high amplitudes of stimulation the ROI in
SI becomes more homogeneously activated with longer stimulus duration. Some
evidence for this is indicated by the large discrepancy (between low- and high-amplitude
surface plots) in the standard deviations measured within the ROI. Further studies are
required to investigate absorbance distribution and patterning within the ROI.
Examination of spatial histograms (Figure 3.2) and the maps in Figures 3-5 & 3-7
also reveal that the size of the SI region that undergoes an increase in absorbance does
not increase with increasing stimulus amplitude, but rather remains relatively constant.
Regardless of stimulus amplitude, the activated cortical region appears circular in shape
and occupies an area approximately 2mm in diameter. Within the ROI average
absorbance increases progressively with increasing stimulus duration. The dimensions of
in diameter (Shoham and Grinvald 2001; Chen et al. 2003). One possible explanation for
this discrepancy is the level and type of general anesthesia used in the different studies.
Previous studies have reported that anesthetics (e.g. ketamine) which block NMDA
receptors or enhance GABAA receptor mediated inhibition (barbiturates), significantly
reduce the dimensions of the receptive field of individual SI neurons; actions that would
reduce the size of the responding SI neuronal population (McKenna et al. 1982). Chen et
al. previously reported similar (~2mm) sized regions of activation in response to flutter
stimulation of the digit tips in squirrel monkey anesthetized with isofluorane, as well as
showing in the same report that use of pentothal anesthetic confined the response to a
much smaller (~1mm) region (Chen et al. 2001).
It has been suggested that the amplitude of skin flutter stimulation is coded by
both the number of activated SI neurons as well as by their level of spike discharge
activity (Johnson 1974). This suggestion is based largely in part on the fact that
larger-amplitude stimuli, through transduction of the laterally-transmitted mechanical wave
produced by sinusoidal skin displacement, recruit larger numbers of RA afferents and
therefore lead to a spatially more widely distributed pattern of afferent input to SI cortex.
Combined metabolic tracer and neurophysiological studies have shown that the initial
response to a repetitive tactile stimulus occupies an extremely large cortical territory. As
the repetitive mechanical stimulation is continued, however, the response is quickly
sculpted by cortical inhibitory mechanisms, leading to an activity pattern that becomes
confined to a relatively restricted region in SI (Juliano and Whitsel 1987; Whitsel et al.
1989; Tommerdahl and Whitsel 1996a). The results obtained in the present study and
amplitude contributes importantly to the shaping (via lateral inhibitory mechanisms) of
the SI response to protracted skin flutter.
Conclusions
This study investigated the global response of SI cortex to flutter stimulation of
the skin using the OIS. An increase of the amplitude of the flutter stimulus was
associated with an increase in absorbance within the region of SI cortex that receives its
input from the stimulated skin field. The relationship between the maximal change in
absorbance and stimulus amplitude is well characterized by a linear function within the
range of amplitudes studied. Measurement of the spatial extent of the activated SI region
showed that higher amplitudes of stimulation do not produce a more extensive region of
SI activation. Instead, as amplitude is increased, while average peak absorbance within
the same ~ 2mm diameter SI region increases with amplitude of stimulation, and at the
same time the region of surrounding cortex undergoes a prominent decrease (frequently
to levels well below background) in absorbance. Further studies are required to establish
the relationship between the effect of different amplitudes of skin flutter stimulation on
CHAPTER FOUR: The Effects of Bilateral Stimulation Background
The activity evoked by tactile stimulation of the skin mechanoreceptors projects
primarily to thalamocortical neurons in the middle laminas of primary somatosensory
cortex (SI) in the contralateral hemisphere. Traditionally, the impact of ipsilateral input
on contralateral SI has been trivialized. However, imaging and neurophysiological
studies (in monkeys, (Iwamura et al. 2002; Lipton et al. 2006) and in humans,(Allison et
al. 1989a; Korvenoja et al. 1995; Nihashi et al. 2005; Hlushchuk and Hari 2006))
described modifications of SI (specifically area 3b) activity in response to input evoked
by either mechanical stimulation of an ipsilateral skin site or electrical stimulation of an
ipsilateral peripheral nerve.
The concept of SI as a processor of tactile information arising exclusively from
the contralateral body surface has coexisted with the idea that fusion of tactile
information from contralateral and ipsilateral sites occurs at an early stage of cortical
information processing. This chapter characterizes the effects of 25 Hz vibrotactile
(“flutter”) stimulation of the ipsilateral thenar eminence on the SI response to an identical
stimulus applied to the contralateral thenar eminence. The results suggest that the
spatiointensive characteristics of the SI response to contralateral stimulation are
significantly modulated by the addition of an ipsilateral input to the skin. Furthermore
the results provide insight into the possible mechanisms of the observed response
Methods
Stimulus Protocols
Sinusoidal vertical skin displacement stimulation (25 Hz, 200 µm, stimulus
duration 5sec, interstimulus interval 60sec - “skin flutter”) was delivered to the thenar
eminence of both forelimbs in squirrel monkeys, and to the central pads of the forelimbs
in cats, using two servo-controlled transducers (Cantek Enterprises, Canonsburg, PA).
The probe of each stimulator was advanced so that in the absence of stimulation the
probe of each stimulator delivered a static indentation (500 µm) to the skin. Skin contact
was detected and signaled by the force transducer and readout circuitry of each
servo-controller. The flutter stimuli were delivered (1) independently to each member of a pair
of mirror-symmetric ipsilateral and contralateral skin sites, and (2) simultaneously to the
two sites (bilateral stimulation). Contralateral, bilateral, and ipsilateral stimuli were
interleaved on a trial by trial basis. The sinusoidal contralateral and ipsilateral
components of each bilateral flutter stimulus always were in-phase and synchronized so
that the two stimuli started and stopped at the same time.
Cluster Analysis
Cluster plots were generated by considering the maximally responding (top 10%)
pixels in response to contralateral and ipsilateral stimulation as two separate samples. In
each plot the activity of a single pixel is plotted as a function of its (normalized) evoked
absorbance by ipsilateral stimulation (x-axis) and contralateral stimulation (y-axis).
analysis was used in Figure 4.7 to demonstrate the relative preference of anterior or
posterior SII to stimulation of the ipsilateral or contralateral stimulation respectively.
Results
Squirrel Monkey SI
The response of SI in the right hemisphere to vibrotactile stimulation of the thenar
eminence on each hand was studied in 5 squirrel monkeys. The goal in each
experiment/subject was to assess the influence, if any, of ipsilateral stimulation on the
response evoked from the mirror-symmetric contralateral skin site.
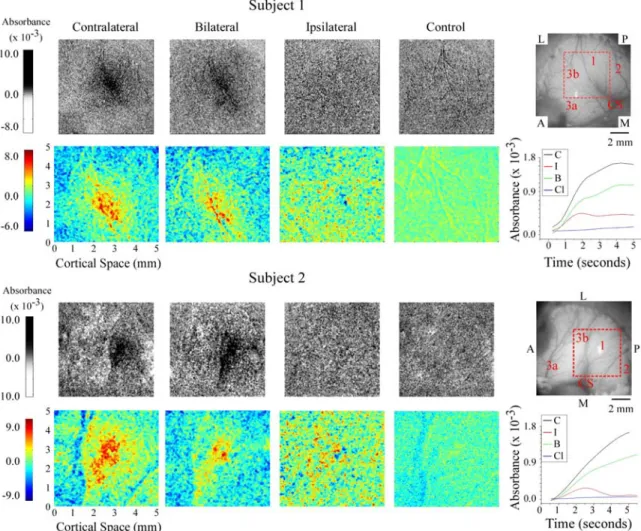
The patterns of absorbance change recorded in the hand representational region of
SI in 2 of the 5 subjects are shown in Figure 4.1. The grayscale average difference images
in the top and 3rd rows of Figure 4.1 show not only the response of the SI hand region to
each of the three conditions of skin flutter stimulation (i.e., “contralateral, bilateral,
ipsilateral”), but also the spatiointensive pattern of absorbance values recorded in the
no-stimulus controls in the same SI region. Visual inspection of these grayscale images
reveal that in both exemplary subjects (1) the magnitude of the response to contralateral
flutter greatly exceeds the response to flutter stimulation of the mirror-symmetric
ipsilateral skin site alone, whereas (2) although differences between the responses to
contralateral vs. bilateral skin flutter can be discerned, they are relatively slight.
Color maps of the responding region within each average difference image (ROI;
the 5 x 5 mm region centered on the maximal response evoked by the contralateral
stimulus – outlined in red in the image of the cortical surface shown at right of the top
and 3rd rows in Figure 4.1) demonstrate more clearly the differences between the
bilateral stimulation evokes a weaker and spatially less extensive response than that
evoked by contralateral skin flutter. Second, although the response to ipsilateral flutter is
Figure 4.1. OIS response evoked by flutter stimulation of the thenar pad in two subjects. 1st & 3rd
Row: Average difference images evoked by contralateral, bilateral, and ipsilateral stimuli and the
no-stimulus control condition. All images within a subject group are oriented as indicated in the green filter
image at the right; P (posterior), A (anterior), M (medial) and L (lateral). 2nd
& 4th row: Magnified
view of selected ROI (identified in image at far right of 1st & 3rd row) from difference images for each
subject. Absorbance time courses are plotted and color-coded for each stimulus condition at far right;
of absorbance values evoked by the ipsilateral stimulus is distinctly different from the
responses (i) evoked by stimulation of the contralateral site and (ii) obtained in the
absence of stimulation (the no-stimulus condition) – i.e., in each subject ipsilateral flutter
evoked a unique and spatially inhomogeneous pattern of absorbance values within the
ROI. For both subjects shown in Figure 4.1 the average across-ROI increase in
absorbance evoked by ipsilateral flutter is substantially smaller than that evoked by
contralateral flutter, although it is also evident that at numerous loci within the ROI the
absorbance values attained during ipsilateral skin flutter exceed by far the values
measured at the same locations in the absence of stimulation.
The plots of absorbance time course shown at the right of Figure 4.1 (2nd and 4th
rows from top) show absorbance values at successive time intervals averaged within the
4mm2 region that responded maximally to contralateral stimulation; see Simons et al.,
2005 for methodological details). Such plots quantitatively confirm the impression
(gained from visual inspection of the grayscale difference images) that the response in SI
of each subject to bilateral skin flutter was substantially weaker than the response to
contralateral flutter. In addition, the plots demonstrate that the SI responses (absorbance
increases) to contralateral vs. bilateral skin flutter follow a very similar time course.
Cat SI
Similar results were found in the cat which offers the unique advantage of
allowing simultaneous imaging of SI and SII (second somatosensory cortex). The
responses to contralateral only, ipsilateral only and bilateral stimulation are shown in
Figure 4.2. Also shown is an image of the exposed cortex used for anatomical orientation
difference images in panels B-D indicate that although a response is evoked in SI during
contralateral only and bilateral stimulation, no response is visible in SI during ipsilateral
only stimulation. However, the exposed region of SII displays activity in response to all
Figure 4.2. Optical responses recorded in cat SI and SII to 25 Hz vibrotactile stimulation of the
forepaws. A) View of the cortical surface, showing the vascular pattern and coronal (COR), ansate
(ANS), and suprasylvian (SS) sulci. Exposed regions of SI and SII are labeled. Below: Averaged
absorbance images for responses evoked by B) contralateral, C) ipsilateral and D) bilateral stimuli.
Difference images were generated by subtracting a single pre-stimulus (reference) image from each
corresponding post-stimulus image and subsequently dividing by the reference image (∆A/A). Stimulus
locations are indicated by figurines. Scale bar is 2 mm. Orientation of images indicated by P (posterior),
A (anterior), M (medial) and L (lateral) axes.
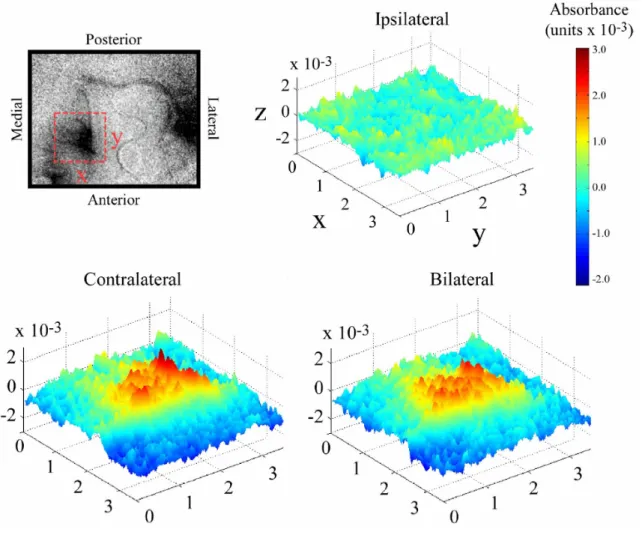
Figure 4.3 compares the stimulus evoked response of SI to contralateral vs.
bilateral stimulation at 5 seconds after stimulus onset. The top left panel indicates the
orientation and location of the sampled region of interest (ROI) in SI. Also visible is the
SII response located posterior and lateral relative to the maximally responding region in
SI. The surface plots show the absorbance values at each location in the imaged field
(absorbance values are indicated both by height along the z-axis and by color). Consistent
with the results observed in SI of squirrel monkey, the response evoked by ipsilateral
stimulation is near-background (or nonexistent), whereas the responses to contralateral
and bilateral stimulation are localized and robust. Close visual inspection of these
surface plots also reveals that the magnitude of the SI response evoked by contralateral
Figure 4.3. Surface plots of absorbance evoked in SI by contralateral, ipsilateral, and bilateral
stimulation. Data displayed is a subset of the data displayed in Figure 1. Region of interest is indicated
by the dashed box shown in the OIS image (top left). Orientation of the ROI is indicated by X
(medial-lateral) and Y (anterior-posterior) labels on the dashed box and axes (in ipsilateral map). Cortical space
along X and Y axes is measured in mm. Z axis is absorbance which is represented by both the height of
the graphic as well as the color indicated by the color bar to the right. Surface plots represent
absorbance values within the ROI at 5 seconds after stimulus onset and demonstrate that the 1) response
in SI to ipsilateral stimulation is small or nonexistent and, 2) magnitude of evoked absorbance in
response to contralateral stimulation is slightly larger than the response evoked by bilateral stimulation.
Figure 4.4 displays the time course of the absorbance change in two subjects within the