SCREENING DISINFECTION BYPRODUCTS AND PHENOLIC COMPOUNDS FOR ESTROGENIC ACTIVITY
Paul Ebohon
A thesis submitted to the faculty of the University of North Carolina at Chapel Hill in partial fulfillment of the requirements for the degree of Master of Science in the Department of Environmental Sciences and Engineering.
Chapel Hill 2011
Approved by:
Howard S. Weinberg, D.Sc.
Rebecca Fry, PhD
ii © 2011 Paul Ebohon
iii ABSTRACT
PAUL EBOHON: Screening Disinfection Byproducts and Phenolic Compounds for Estrogenic Activity
(Under the direction of Howard S. Weinberg and Rebecca Fry)
Very few of the more than 600 individual disinfection byproducts (DBPs) identified in drinking water are currently regulated based on their carcinogenic potential. Endocrine disruption is another potential mechanism through which DBPs could affect human health but limited research has evaluated this threat.
This thesis evaluates the potential endocrine activity of several DBPs and phenolic compounds using an in vitro yeast estrogen screen. The rank order of tested compounds demonstrates that while estrogenic activity is observed only at concentrations that are two to three orders of magnitude higher than typical environmental concentrations, the
unregulated DBPs such as mucochloric acid and dibromoacetonitrile show higher potency than the regulated dibromo- and trichloroacetic acids. It is also clear that the presence of a halogen in the DBP is responsible for the observed estrogenic activity since the non halogenated structures (acetic acid and acetonitrile) showed no activity in the same concentration range.
iv
ACKNOWLEDGEMENTS
I would like to thank Dr. Howard Weinberg for his support, research input, and help with editing this thesis. I would also like to thank my other committee members (Dr. Rebecca Fry and Jill Stewart) for their encouragement, research ideas, and suggestions for editing this thesis. I would like to thank Benjamin Stanford, Lisa Smeester, Jayne Boyer, Lamar Perry, Pearl Kaplan, and Bonnie Lyon for addressing questions regarding the biological assay used during this study, help with instrumentation, providing training on specific laboratory procedures, and answering research questions. I am really grateful for the yeast estrogen screen assay training provided by Erin Yost from Dr. Seth Kullman’s research group at North Carolina State University. I am also very grateful for the financial support provided by
v
TABLE OF CONTENTS
LIST OF TABLES.………..……….……….viii
LIST OF FIGURES...……….………...x
LIST OF ABBREVIATIONS...………..……….………..xiii
CHAPTER 1.0 INTRODUCTION ... 11.1 Literature Review... 2
1.1.1 Risks of Waterborne Disease ... 2
1.1.2 Drinking Water Treatment and Disinfection ... 4
1.1.3 Disinfection By-Products ... 5
1.1.4 U.S. Regulation of DBPs ... 6
1.1.5 Evolving DBP Regulation and Implications for Drinking Water Treatment Plants ... 8
1.1.6 Presence of DBPs in Drinking Water Treatment Plants ... 9
1.1.7 Health Effects Associated with DBPs Found in Drinking Water ... 12
vi
1.1.9 Mechanisms through which DBPs in Drinking Water can Cause
Adverse Health Effects ... 15
1.1.10 Supporting Evidence of the Effect of Endocrine Disruptors Wildlife and Humans ... 17
1.1.11 Pathways for EDCs into Drinking Water Sources ... 19
1.1.12 Occurrence Levels of Steroid Hormones and EDCs in U.S. Streams and Drinking Water ... 22
1.1.13 Source Water Quality Protection ... 24
1.1.14 The Endocrine System – A Master Regulator of Development ... 25
1.1.15 Genomic Mode of Action of Steroid Hormones ... 26
1.1.16 Mechanisms by which EDCs could Influence the Endocrine System ... 28
1.1.17 Predicting Estrogenic Activity of Exogenous Chemicals ... 29
1.1.18 Response to the Presence of EDCs found in the Environment ... 32
1.1.19 Assays Employed for Measurement of Estrogenic Activity of EDCs ... 33
1.2 Research Questions ... 42
1.3 Research Objectives ... 43
2.0. MATERIALS AND METHODS ... 44
2.1 Materials ... 45
vii
2.2.1 The Recombinant Yeast Estrogen Screen ... 47
3.0 RESULTS ... 52
3.3.1 Estrogenic Activity of Known EDCs towards the YES Assay ... 52
3.3.2 Estrogenic Activity of Selected DBPs towards the YES Assay ... 58
3.3.3 Possible Role of Chlorine and Bromine Atoms in Estrogenic Activity of DBPs .... 68
4.0 DISCUSSION ... 73
4.1 Estrogenic Activity of Selected DBPs and Phenolic Compounds towards the Yeast Estrogen Screen ... 73
5.0 CONCLUSIONS... 81
5.1 Implications of Results ... 81
5.2 Proposed Future Research Efforts ... 83
APPENDIX A: Yeast Estrogen Screen (YES) Assay Protocol ... 87
APPENDIX B: Instructions for working with YES data in Graphpad Prism 4.03... 101
APPENDIX C: Preparation of DBP Stock and Working Solutions ... 104
APPENDIX D: Figures Showing Duplicate Results for DBPs and Phenolic Compounds .. 108
viii
LIST OF TABLES
ix
x
LIST OF FIGURES
Figure 1.1 Pathways for EDCs in Drinking Water Sources (Herberer, 2002)
Figure 1.2 Relative Estrogenic Activities of some EDCs found in
Drinking Water Sources
Figure 1.3 Genomic Mode of Action of the Steroid Hormone (Purves, 1998)
Figure 1.4 Structures of Hormones and other Chemicals with Confirmed
Estrogenic Activity
Figure 1.5 Structures of Pharmaceuticals and DBPs with Suspected Estrogenic Activity
Figure 1.6 Structures of Phenolic Compounds Lacking Estrogenic Activity
Figure 1.7 Schematic of the Molecular Basis for the YES Assay (Linden et al., 2007)
Figure 3.1 Dose Response Curve for Estradiol (E2) in the YES Assay
Figure 3.2 Dose Response Curve for 17--ethinylestradiol (EE2) in the YES Assay
Figure 3.3 Dose Response Curve for Estriol (E3) in the YES Assay
Figure 3.4 Dose Response Curve for 4-nonyphenol (4-NP) in the YES Assay
Figure 3.5 Dose Response Curve for 2,4-dichlorophenol (2,4-DCP) in the YES Assay
Figure 3.6 Dose Response Curve for Estradiol (E2) Analyzed Simultaneously on the same plate with 2,4-dichlorophenol in the YES Assay...
Figure 3.7 E2: Saturated Response (0.853)
Figure 3.8 E2: Saturated Response (0.903)
Figure 3.9 E2: Saturated Response (1.044)
Figure 3.10 E2: Saturated Response (1.018)
Figure 3.11 Dose Response Curve for Dibromoacetic acid in the YES Assay
Figure 3.12 Dose Response Curve for Trichloroacetic acid in the YES Assay
xi
Figure 3.15 Dose Response Curve for Dibromoacetonitrile in the YES Assay
Figure 3.16 Dose Response Curve for Dichloroacetonitrile in the YES Assay
Figure 3.18 Dose Response Curve for 2-bromoacetamide in the YES Assay
Figure 3.19 Dose Response Curve for 2-chlorophenol in the YES Assay
Figure 3.20 Dose Response Curve for 2,4,6-trichlorophenol in the YES Assay
Figure 3.21 Cytotoxic Dose Response Curve for Iodoacetic acid in the YES Assay
(absorbance measured at 600nm)
Figure 3.22 Cytotoxic Dose Response Curve for 2-bromoacetamide in the YES Assay (absorbance measured at 600nm)
Figure 3.23 Dose Response Curve (lower concentration range) for Acetonitrile
in the YES Assay
Figure 3.24 Dose Response Curve (lower concentration range) for Dichloroacetonitrile in the YES Assay
Figure 3.25 Dose Response Curve (lower concentration range) for Acetic acid
in the YES Assay
Figure 3.26 Dose Response Curve (lower concentration range) for Dibromoacetic acid in the YES Assay
Figure 3.27 Dose Response Curve (higher concentration range) for Acetonitrile
in the YES Assay
Figure 3.28 Dose Response Curve (higher concentration range) for Acetic acid
in the YES Assay
Figure A.1 YES Assay Template
Figure D.1 Dose response curve for 2, 4, 6-trichlorophenol in the YES assay
Figure D.2 Dose Response Curve for 2, 4-dichlorophenol in the YES assay
Figure D.3 Dose Response Curve for 2-chlorophenol in the YES assay
Figure D.4 Dose Response Curve for Dibromoacetic acid in the YES assay
xii
Figure D.6 Dose Response Curve for Dibromoacetonitrile in the YES Assay
Figure D.7 Dose Response Curve for Dichloroacetonitrile in the YES Assay
Figure D.8 Cytotoxic Dose Response Curve for 2-bromoacetamide in the YES Assay
Figure D.9 Dose Response Curve for 2-bromoacetamide in the YES Assay
xiii
LIST OF ABBREVIATIONS
2,4-DCP 2,4-dichlorophenol 4-NP 4-Nonylphenol
8-OH-dG 8-hydroxydeoxyguanosine ACF Aberrant Crypt Foci
ADME Absorption, Distribution, Metabolism, and Excretion ALP Alkaline Phosphatase
AWWARF American Water Works Association Research Foundation BPA Bisphenol A
CaCO3 Calcium Carbonate
CCL Contaminant Candidate List CCL3 Contaminant Candidate List 3
CDC Centers for Disease Control and Prevention CHO Chinese Hamster Ovary
Conc. Concentration
DBPs Disinfection By-Products
DDT Dichlorodiphenyltrichloroethane
DEPA Danish Environmental Protection Agency DES Diethylstilbestrol
DNA Deoxyribonucleic acid DWS Drinking Water Strategy
DWTPs Drinking Water Treatment Plants
xiv E2 17--Estradiol
E3 Estriol
EC10 Effective Concentration10
EC50 Effective Concentration50
EDCs Endocrine Disrupting Compounds EDSP Endocrine Disruptor Screening Program
EDSTAC Endocrine Disruptor Screening and Testing Advisory Committee EE2 17--ethinylestradiol
EEQ Estradiol Equivalents
ELISA Enzyme-Linked Immunosorbent Assay ER Estrogen Receptor
ER-CALUX Estrogen Receptor-mediated Chemical-Activated Luciferase gene Expression assay
ERE Estrogen Response Elements FQPA Food Quality Protection Act HAA5 Sum of 5 Haloacetic acids HAA9 Sum of 9 Haloacetic acids hER Human Estrogen Receptor alpha hER Human Estrogen Receptor beta
HPLC High Performance Liquid Chromatography
HPLC-UV High Performance Liquid Chromatography with Ultraviolet detector ICR Information Collection Rule
xv IUGR Intrauterine Growth Restriction LGW Laboratory Grade Water LOD Limit of Detection
Max Maximum
MCL Maximum Contaminant Level MCLGs Maximum Contaminant Level Goals MDA Malondialdehyde
MELN MCF-7-ERE-Glob-Luc-Neo mRNA Messenger Ribonucleic Acid
MX 3-Chloro-4(dichloromethyl)-5-hydroxy-2(5H)-furanone NCI National Cancer Institute
NCRI National Cancer Research Institute NDEA N-nitrosodiethylamine
NDMA N-nitrosodimethylamine NDPA N-nitroso-di-n-propylamine
NIEHS National Institute of Environmental Health Sciences NOM Natural Organic Matter
NOMS National Organics Monitoring Survey NOR National Organics Reconnaissance Survey NPDWRs National Primary Drinking Water Regulations NPYR N-nitrosopyrrolidine
NSDWRs National Secondary Drinking Water Regulations
xvi o-NPG o-Nitrophenyl--Galactosidase OWCs Organic Wastewater Contaminants
RO Reverse Osmosis
ROS Reactive Oxygen Species RSD Relative Standard Deviation SAR Structural Activity Relationship SDWA Safe Drinking Water Act
SMCLs Secondary Maximum Contaminant Levels STP Sewage Treatment Plant
THM4 Sum of 4 Trihalomethanes THMs Trihalomethanes
TOC Total Organic Carbon TOX Total Organic Halide TTHMs Total Trihalomethanes
U.S. EPA United States Environmental Protection Agency U.S. United States
USGS United States Geological Survey WHO World Health Organization WWTPs Waste Water Treatment Plants YES Yeast Estrogen Screen
1.0 INTRODUCTION
The disinfection of drinking water with chlorine in the U.S. has played a major role in the reduction of waterborne diseases that had exacted a heavy toll in illness and deaths prior to its use in 1908. Despite this benefit, the reaction of chlorine with natural organic matter (NOM), bromide, iodide and anthropogenic contaminants in surface and groundwater during treatment generates disinfection by-products (DBPs) (Rook 1974). The presence of these compounds in drinking water has been a health concern over the last 35 years following their discovery and subsequent epidemiological studies associating them with increased risk of bladder cancer, spontaneous abortion, and low birth weight (Villanueva et al., 2007; Waller et al., 1998; Wright et al., 2003). Results from in vitro studies using laboratory animals showed that these compounds (administered at elevated concentrations) caused
spermatoxicity, developmental abnormalities, fetal death and growth retardation (Linder et al., 1994; Hunter et al., 1996; Smith et al., 1992).
2
combinations, but this generates a different suite of DBPs, some of which have been shown to be more cytotoxic and genotoxic than their regulated counterparts (Plewa et al., 2007)
Human exposure to complex mixtures of DBPs in drinking water is a public health concern yet very few studies have been conducted to determine if they induce estrogenic activity. Some in vivo studies have suggested that chloroform and dibromoacetic acid are suspected endocrine disrupting compounds (EDCs) (Brittebo et al., 1987; Goldman & Murr 2003). Before addressing whole drinking water samples containing complex mixtures of DBPs, it is helpful to generate a comparative database of their estrogenic activity when acting as single compounds. Such information would help determine which DBPs need more study, including occurrence levels and effective treatment technologies to reduce their formation, in order to minimize human health risks associated with their possible estrogenic activity in drinking water.
1.1 Literature Review
1.1.1 Risks of Waterborne Disease
3
respectively. Between 1930 and 1940, the incidence of this waterborne disease decreased by 41 and 60 percent, respectively, and by 1960, approximately 88 percent reduction had been recorded by the Centers for Disease Control and Prevention (CDC, 1999). The introduction of disinfection of public water supplies in the U.S. since 1908 contributed to a significant reduction in all waterborne illnesses in the U.S. including typhoid fever, cholera, and amoebic dysentery (CDC, 1999; Ohanian et al., 1989) to the point where these have essentially been eradicated from public water supplies.
4
water source (Lake Michigan) by human sewage and cattle effluent containing the
cryptosporidium oocyst. The Milwaukee Water Works failed to properly monitor its water treatment process and this led to more than 400,000 people being infected with
cryptosporidiosis (Dillingham et al., 2002).
1.1.2 Drinking Water Treatment and Disinfection
The need for potable drinking water dates back as far as 1500 B.C. During this era, not much was known about the science of how microorganisms in water could cause
waterborne diseases and illness. The goal was to have palatable water and processes such as boiling and exposing water to sunlight were used for drinking water treatment (U.S. EPA, 2000). The weakness during this era was that palatable water was assumed to be safe for consumption. In 500 B.C, the first cloth filter bag was invented by Hippocrates, who also believed that palatable water was safe for consumption (Baker & Taras 1981).
Awareness on the need for potable drinking water increased in 1676 when Anthony Von Leeuwenhoek discovered microorganisms in pond water by looking through a
microscope (Becker et al., 2009). During this era, awareness of the need for drinking water treatment heightened and individuals employed the use of domestic water filters made from sponges, charcoal, and wool (Baker & Taras 1981). In 1804, the first municipal water treatment plant that supplied water to residents was built in Scotland. This plant and another built in Paris in 1806 mainly employed filtration to treat drinking water (U.S. EPA, 2000; Baker & Taras 1981).
5
water supplied from a particular source were more likely impacted. The cholera incidence was linked to sewage contamination of one of the water supplies and Snow stopped the outbreak by persuading the local council to disable the Broad street well pump by removing its handle. Results from this incident as well as discoveries by other scientists that particles in source water could harbor pathogens, prompted use of filtration as well as chlorination in the drinking water treatment process worldwide (U.S. EPA, 2000). In 1908, Jersey City (N.J., U.S.A.) became the first city in the U.S. to apply chlorine as a disinfectant in its water
treatment process. Over 1000 U.S. cities were employing chlorination in their drinking water treatment processes by 1918 (U.S. EPA, 2000; Fowle & Kopler 1986). At the present time, the use of chlorine as a means to destroy harmful microorganisms continues to be a major technique in drinking water treatment and is most effective when used following coagulation and sedimentation in combination with filtration (Hitzfeld et al., 2000; Betancourt & Rose 2004).
1.1.3 Disinfection By-Products
Studies on the health effects associated with the use of chlorine during drinking water treatment were not conducted until 50 years after it was initially used as a disinfectant (Fowle & Kopfler 1986). Results from an in vivo study conducted in 1968 showed that there were no health effects from the presence of chlorine in drinking water (Drukery 1968), but an article published in 1969 highlighted that chlorine in drinking water could be mutagenic (Lederberg 1969). Apart from inactivating and killing microorganisms that would normally cause
6
During the early 1970s, the first class of DBPs known as trihalomethanes (THMs) which includes chloroform was identified (Bellar et al., 1974; Rook 1974).
After the discovery of DBPs in drinking water, subsequent studies were undertaken to determine their possible health effects. The first epidemiological studies conducted in
Louisiana showed a correlation between prostrate/breast cancer and chlorinated drinking water received from the Mississippi River (Page et al., 1976). It is important to note that results generated from this study did not address confounding factors such as alcohol and tobacco use by individuals as well as patients with cancer who migrated to the state. A report produced by the National Cancer Research Institute (NCRI) showed that chloroform was a carcinogenic compound that caused kidney and liver tumors in laboratory animals (NCI, 1976) while other studies conducted in the U.S., Israel and Canada using the Salmonella/mammalian microsome assay showed that organic extracts from concentrated chlorinated drinking water were mutagenic (Loper et al., 1978; Nestmann et al., 1979; Glatz et al., 1978). Results from these studies showed that despite the advantages of using chlorine in treating water, its potential harmful health effects could not be ignored.
1.1.4 U.S. Regulation of DBPs
7
EPA, 1998b). One class included the haloacetic acids, which are generally formed at the next highest concentrations compared to THMs (Singer 2004). The sum of the concentrations of five haloacetic acids (HAA5: bromoacetic, dibromoacetic, chloroacetic, dichloroacetic and trichloroacetic acid) were given a MCL of 60 µg/L. These HAA5 were chosen for regulation based on their available occurrence data. In addition to inadequate occurrence data, the other four chlorine- and bromine-containing haloacetic acids were not included for regulation as adequate methods and standards were unavailable for their measurement at the time of promulgation. Bromate (a DBP formed during ozonation) was regulated at 10 µg/L and chlorite, formed as a result of chlorine dioxide treatment, was regulated at 1000 µg/L. The U.S. EPA Stage 1 DBP Rule required the running annual average of samples collected from a water utility distribution system to be below the MCL for each regulated DBP.
The MCL set for each DBP under the Stage 1 Rule was meant to provide protection against any adverse health effect; however, these limits cannot guarantee protection and risks associated with unidentified DBPs. In order to address this issue, this Rule also stressed the use of enhanced coagulation to improve the removal of NOM in a conventional water treatment plant (U.S. EPA, 1999). This rule applied to all systems using surface and groundwater during conventional drinking water treatment processes involving filtration, coagulation, sedimentation, and softening as well as those using a water source that
8
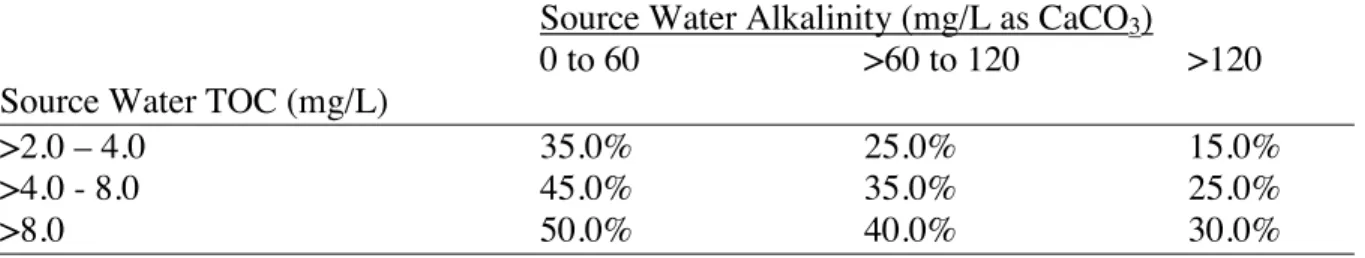
conducted at a large number of utilities (Chowdhury et al., 1997) and relate to the TOC and alkalinity of the source water. A water source with higher alkalinity requires a lower TOC removal because of the difficulty in using a coagulant to depress the pH of the water into a range between 5.5 and 6.5 (where TOC removal is optimal).
Table 1.1 Required Removal of TOC by Enhanced Coagulation as Specified under Stage 1 Rule
Source Water Alkalinity (mg/L as CaCO3)
0 to 60 >60 to 120 >120 Source Water TOC (mg/L)
>2.0 – 4.0 35.0% 25.0% 15.0%
>4.0 - 8.0 45.0% 35.0% 25.0%
>8.0 50.0% 40.0% 30.0%
1.1.5 Evolving DBP Regulation and Implications for Drinking Water Treatment Plants
9
The changes made by the U.S. EPA based on reduction of the MCL for TTHMs, regulation of other classes of DBPs, and the involvement of locations as specified under the Stage 2 Rule made compliance difficult for water utilities using chlorine for disinfection. In order to address this issue, many utilities switched to using alternate disinfectants such as chloramines, chlorine dioxide and ozone or combinations of them. The use of these alternate disinfectants has been shown to reduce the formation of some of the regulated THMs and HAA5 but they produce other classes of DBPs that might be more carcinogenic and genotoxic than their regulated counterparts (Richardson et al., 2007; Plewa et al., 2007; Plewa et al., 2002). For example, chloramines form reduced levels of haloacetic acids (Singer 2004) but higher levels of N-nitrosodimethylamine (NDMA) which has been shown to be carcinogenic in studies using laboratory animals (U.S. EPA, 1993b). Iodoacetic acid is another DBP of concern that is found in waters treated with chloramines (Weinberg et al., 2011). A study using mammalian cells has shown that this DBP is the most potent in terms of genotoxic activity (Plewa et al., 2004). The use of alternate disinfectants also produces DBPs whose health effects remain unknown. Chloropicrin, which can be produced during
ozonation followed by chlorination (Merlet et al., 1985; Hoigne & Bader 1988), is an example of such a DBP with no carcinogenic activity data listed under the U.S. EPA Integrated Risk Information System (IRIS).
1.1.6 Presence of DBPs in Drinking Water Treatment Plants
10
utilities was conducted by the American Water Works Association Research Foundation (AWWARF) in 1987 and all 4 of the regulated THMs (THM4) were detected in finished water (McGuire & Meadow 1988). Another study conducted from 1988 to 1989 involving 35 utilities showed that the trihalomethanes and haloacetic acids accounted for the largest class of DBPs detected in finished water at treatment plants (Krasner et al., 1989) and this result was complemented by those provided under the Information Collection rule (ICR) (McGuire et al., 2002). The THM4 represents the sum of the concentrations of chloroform, bromoform, bromodichloromethane and chlorodibromomethane and is often referred to in the literature as total trihalomethanes (TTHM). The median TTHM levels from early studies including the ICR are summarized in Table 1.2. An important trend is that TTHM levels significantly decreased over the years due to water utilities complying with DBP regulation.
Previous DBP occurrence studies still did not provide enough information on the identity of DBPs and their levels in consumers’ drinking water but an EPA priority study involving 12 drinking water treatment plants that employed different treatment options and disinfectants partially addressed this issue (Weinberg et al., 2002). DBP selection for this study was based on results from an extensive Structural Activity Relationships analysis (SAR) that prioritized these chemicals based on their genotoxic and carcinogenic potential (Woo et al., 2002). Results from the SAR analysis showed that the halomethanes, haloacids, haloacetonitriles, haloacetates, haloketones, haloacetaldehydes, halonitromethanes,
11
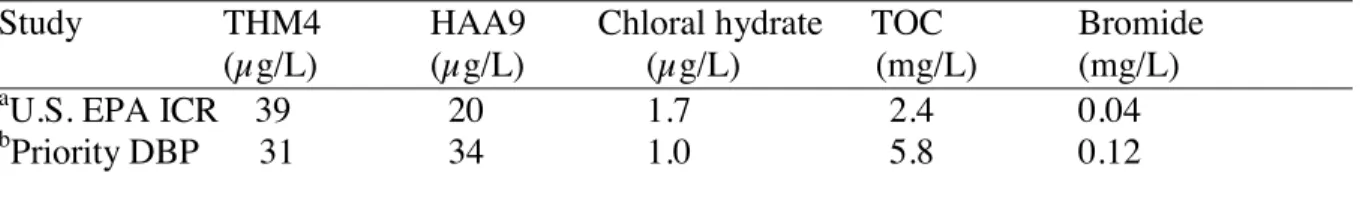
DBP study as shown in Table 1.3 varied slightly when compared to those from the ICR, while that for chloral hydrate (one of the haloacetaldehydes) was similar. It is important to note that in order to detect the priority DBPs, the 12 treatment plants were targeted because the water sources had high TOC and bromide content. Occurrence levels for selected DBPs from the 12 treatment plants are shown in Table 1.4.
Table 1.2 Snapshots of TTHM Levels in U.S. Drinking Water
Study Number of Utilities tested Median Conc. (µg/L) Reference
aNOR 80 41 Symons et al., 1975
b
NOMS Phase I 111 45 Brass et al., 1997
c
AWWARF 727 39 McGuire et al., 1988
U.S. EPA 35 36 Krasner et al., 1989
dU.S. EPA ICR 500 39 McGuire et al., 2002
a
NOR: National Organics Reconnaissance Survey; bNOMS: National Organics Monitoring Survey cAWWARF: American Water Works Association Research Foundation; dU.S. EPA ICR: U.S. EPA Information Collection Rule.
Table 1.3 Median Precursors and Occurrence Levels of DBPs from Different Water Sources
Study THM4 HAA9 Chloral hydrate TOC Bromide (µg/L) (µg/L) (µg/L) (mg/L) (mg/L)
a
U.S. EPA ICR 39 20 1.7 2.4 0.04
b
Priority DBP 31 34 1.0 5.8 0.12
aU.S. EPA ICR: McGuire et al., 2002. b
Priority DBP: Krasner et al., 2006.
12
Table 1.4 Occurrence Levels of Some Priority DBPs in U.S. Drinking Watera
DBP Minimum (µg/L) Median (µg/L) Maximum (µg/L)
2-Bromoacetamide ND ND 1.1
Bromonitromethane ND ND 0.3
Bromopicrin ND ND 5.0
Chloral hydrate ND 1.0 16
Chloronitromethane ND ND 0.8
Chloropicrin ND 0.2 2.0
Cyanogen chloride ND 2.5 8.4
Dibromoacetonitrile ND 0.2 2.0
Dichloroacetaldehyde ND 1.0 14
Dichloroacetonitrile ND 1.0 12
ND: Not detected.
a
Krasner et al., 2006.
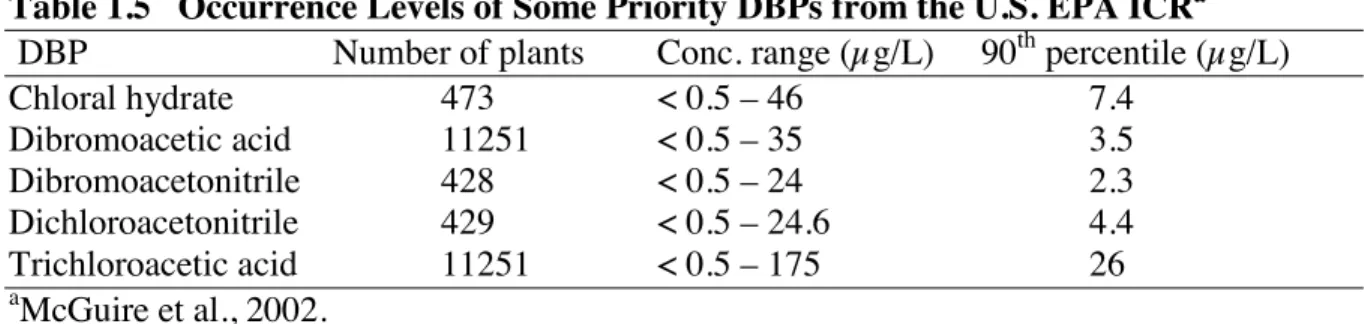
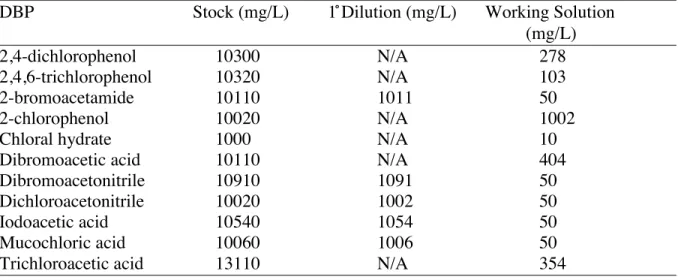
Table 1.5 Occurrence Levels of Some Priority DBPs from the U.S. EPA ICRa
DBP Number of plants Conc. range (µg/L) 90th percentile (µg/L)
Chloral hydrate 473 < 0.5 – 46 7.4
Dibromoacetic acid 11251 < 0.5 – 35 3.5
Dibromoacetonitrile 428 < 0.5 – 24 2.3
Dichloroacetonitrile 429 < 0.5 – 24.6 4.4 Trichloroacetic acid 11251 < 0.5 – 175 26
aMcGuire et al., 2002.
The occurrence levels of priority DBPs as shown in Table 1.5 represent a very small fraction of DBP levels that consumers are actually exposed to via drinking treated water. A great deal of work still has to be done to characterize the unknown fraction of DBPs (Hua & Reckhow 2007; Krasner et al., 2006; Weinberg 1999) that might possibly affect human health including the human endocrine system when acting alone or in complex mixtures with other compounds.
1.1.7 Health Effects Associated with DBPs Found in Drinking Water
13
drinking water. Some toxicological studies using laboratory animals have shown that DBPs such as trichloroacetic acid, dibromoacetic acid, dichloroacetic acid, bromodichloromethane, and chloral hydrate at elevated concentrations caused spermatoxicity (Linder et al., 1994; Klinefelter et al., 1995; Katz et al., 1981; Bhat et al., 1991). Orally administered
dichloroacetic acid at elevated concentrations caused growth retardation, fetal death and malformation in developing rats (Smith et al., 1992) while developmental toxicity in rats have been reported due to trichloroacetic acid exposure (Smith et al., 1989). In vivo studies showed that 3-chloro-4-(dichloromethyl)-5-hydroxyl-2(5H)-furanone (MX) is a genotoxic compound that induced DNA damage in the brain and caused cancer at multiple sites in laboratory animals (McDonald & Komulainen 2005; Verschaeve et al., 2006; Komulainen et al., 1997), while results from another showed that iodoacetic acid caused developmental abnormalities and induced neural tube closure defects in mouse embryos (Hunter et al., 1996).
Human exposure to DBPs in drinking water does not occur from single compounds but combinations of them. An in vivo study showed that mixtures of bromochloroacetic, dichloroacetic and dibromoacetic acid at elevated concentrations caused adverse reproductive and developmental effects in rat embryo culture (Andrews et al., 2004) while another
reported that combinations of THM4 and HAA5 induced pregnancy loss in rats (Narotsky et al., 2011). The effect of the DBP mixture in the Andrews et al. (2004) study had
14
lesser concentration of HAA5 (615 µmol/kg) and THM (613 µmol/kg), the same effect was comparable to that of HAA5 (1231 µmol/kg).
The results from these animal studies have been complemented by those from various epidemiological studies which suggested that the presence of some species of
trihalomethanes in drinking water caused spontaneous abortion, low birth weight, intrauterine growth retardation (IUGR), and still births (Dodds et al., 1999; Gallagher et al., 1998; Waller et al., 1998; Wright et al., 2003; Savitz et al., 1995; Kramer et al., 1992; Bove et al., 1995; Swan et al., 1992). Other epidemiological investigators associated long term exposure to DBPs in drinking water with increased risk of cancer (Chevrier et al., 2004; Cantor 1997; Koivusalo et al., 1997; Doyle et al., 1997; King & Marlett 1996). Most of these
epidemiological studies have focused on DBP exposure through ingestion of drinking water; however, a study comparing exposure routes through ingestion of drinking water,
inhalation/dermal absorption during showering, bathing and swimming in pools showed that the risk associated with bladder cancer is higher through dermal and inhalation route of exposure when compared to ingestion (Villanueva et al., 2007).
1.1.8 Limitations of Results from In Vivo and Epidemiological Studies
15
exposure and concentration of DBPs used in toxicological animal studies, the health effects associated with these compounds should be interpreted with caution especially when applied to humans.
Another limitation associated with epidemiological studies is in the use of routinely collected measurements of THMs leaving the treatment plant as an exposure index (Kramer et al., 1992; Bove et al., 1995; Gallagher et al., 1998; Dodds et al., 1999). There is no evidence to suggest that THMs represent all DBPs in drinking water. This approach fails to account for changes in concentrations as the water travels to the consumer’s tap or
consumption from other sources such as the workplace or bottled water. Such routinely collected THM concentrations may not adequately reflect what individuals in
epidemiological studies have actually been exposed to because DBP concentration varies with temperature, pH, disinfectant concentration, reaction time, and NOM concentration (U.S. EPA, 2005).
1.1.9 Mechanisms through which DBPs in Drinking Water can Cause Adverse Health Effects
The mechanisms through which DBPs cause adverse health effects have not been well investigated but some investigators have suggested oxidative stress,
genotoxicity/mutagenicity, and folate metabolism as possibilities (Kim et al., 2005; Scholl et al., 2001; Karowicz-Bilinska et al., 2002; Geter et al., 2005; Plewa et al., 2002; Plewa et al., 2007). Oxidative stress in the body generates reactive oxygen species (ROS) that reacts with DNA to cause damage (Hracsko et al., 2008) and malondialdehyde (MDA) and
16
biomarkers in the urine of 261 pregnant women collected during their first stage of labor were determined by using an in vitro enzyme- linked immunosorbent (ELISA) kit and high performance liquid chromatography (HPLC) during an epidemiological study (Kim et al., 2005). Results from the Kim et al. (2005) study that showed reduced neonatal birth weight after adjusting for confounding factors have been complemented by others that showed correlations between increased levels of 8-OH-dG and MDA with Intrauterine growth restriction (IUGR) and low birth weight (Prabhu et al., 2010; Scholl & Stein 2001). The exact mechanism for these adverse reproductive outcomes has not been well defined but it has been suggested that a contributing factor includes exposure to chemicals in drinking water (Kim et al., 2005).
Genotoxicity refers to DNA damage that includes strand breaks and formation of adducts that can be caused by different mechanisms such as increased oxidative stress, incomplete DNA excision repair and increased intracellular calcium (Halliwell & Aruoma 1991). An in vitro study using mammalian cells has demonstrated that certain DBPs such as haloacetic acids are genotoxic (Plewa et al., 2002), complemented by another study showing unregulated haloacetonitriles and halonitromethanes having the same property (Plewa et al., 2007). Results from the Plewa et al. (2002) study also highlighted that the
17
the unregulated DBPs in drinking water in addition to the regulated ones that have specified MCLs under the U.S. EPA DBP rules.
Folate metabolism is a mechanism through which DBPs have been suggested to cause adverse health effect such as cancer and studies have showed that aberrant crypt foci (ACF) are precursor lesions in the development of colon cancer (Konstantakos et al., 1996; Siu et al., 1997). Folate is one form of vitamin B that is involved in synthesis, repair and
functioning of DNA as well as cell production and maintenance (Kamen 1997) and it has an increased need in pregnant/lactating women, alcohol abusers, and individuals with liver disease. A deficiency in this vitamin can cause DNA strand breaks, chromosomal damage and cancer due to misincorporation of nucleobases during DNA synthesis (Reidy 1988). In vivo studies involving laboratory animals exposed to elevated concentrations of brominated THMs in drinking water showed induced formation of ACF (DeAngelo et al., 2002; Geter et al., 2004). This observation was also made in another study that exposed F344/N rats to tribromomethane at a concentration of 500 mg/L in drinking water, and significant
differences were recorded when the exposure was combined with a no folate diet (Geter et al., 2005). Apart from being carcinogenic, DBPs can also cause detrimental health effects when acting in combination with other factors such as diet as observed in the Geter et al. (2005) study.
1.1.10 Supporting Evidence of the Effect of Endocrine Disruptors in Wildlife and Humans
18
industry. According to the U.S. EPA, an endocrine disrupting compound is “an exogenous agent that interferes with the synthesis, secretion, transport, binding, action, or elimination of natural hormones in the body which are responsible for the maintenance of homeostasis, reproduction, development and/or behavior” (U.S. EPA, 1997).
A significant number of studies have shown that certain chemicals released into the environment have the ability to alter the function of the endocrine system in exposed species (Purdom et al., 1994; Barnhoorn et al., 2004; Jobling & Tyler 2003; Tyler et al., 1998; Panter et al., 1998; Balch et al., 2004; Brion et al., 2004; Kramer et al., 1998; Imai et al., 2005). Results from one study clearly demonstrated that lowered testosterone and increased 17- -estradiol (E2) levels observed in alligators residing in Lake Apopka in Florida were associated with exposure to the pesticide dicofol and herbicide
dichlorodiphenyltrichloroethane (DDT) (Guillette et al., 1994; Falconer 2006; Juberg 2000). Tributylin (a constituent in anti-fouling paints) used on boats for preventing the growth of barnacles on ships caused infertility, imposex and extinction of some mollusk species (Matthiessen 2003; Barlow et al., 1999; Ellis & Pattisina 1990) and its use in the U.S. has been restricted under the Anti-fouling System Control Act of 2007 due to its adverse environmental impact (U.S. EPA, 2007).
19
studies showed masculinization and inhibition of spermatogenesis in fish exposed to Kraft/pulp mill and sewage treatment plant (STP) effluent containing EDCs (Bortone & Davis 1994; Larsonn & Forlin 2002; Parks et al., 2001; Diniz et al., 2005). Vitellogenin is an egg yolk protein precursor that would normally be found in female fish due to the presence of estrogen; however, it has been well documented that the presence of natural and synthetic hormones in sewage effluent stimulates the endocrine system of this protein in different species of male fish and causes feminization (An et al., 2008; Liney et al., 2006; Nakari 2004; Gross-Sorokin et al., 2006).
The degree to which humans are affected by the EDCs is unknown. Studies have shown observations of uncommon vaginal adenocarcinoma and reproductive abnormalities in individuals whose mothers were treated with the synthetic estrogen diethylstilbestrol (DES) (Herbst 1981; Sharpe & Shakkebaek 1993; Mittendorf 1995). Reports have also associated EDCs with decreased sperm counts, increased incidences of certain types of cancer, and type II diabetes (Hodgson et al., 2004; Rozati et al., 2000; Lang et al., 2008; Glass & Hoover 1990). Despite these observations, some investigators have concluded that there is no evidence of risk from environmental sources of endocrine disrupting chemicals in humans (Kavlock et al., 1996; Solomon et al., 1998; Waddell 1998; Daston et al., 1997; Juberg et al., 2000; Cargouet et al., 2007).
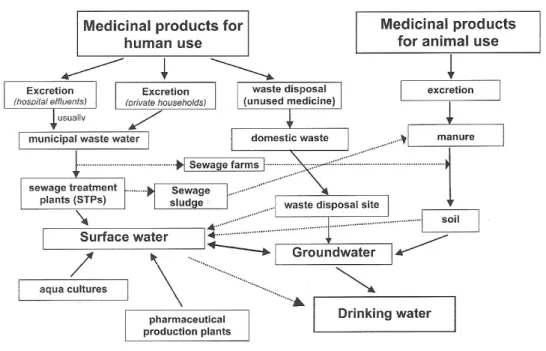
1.1.11 Pathways for EDCs into Drinking Water Sources
20
Figure 1.1: Pathways for EDCs in Drinking Water Sources (Herberer, 2002)
Excretion of hormones from living organisms represents one of these pathways and E2 is excreted at a daily rate between 2.3 and 3.5 µg per day by menstruating/menopausal women (Hu et al., 2003; Johnson et al., 2000). This rate is even higher for pregnant women with reported levels between 259 and 400 µg per day (Racz & Goel 2009; Hu et al., 2003). E2 found in urine is generally lower in men with reported levels of 1.6 µg per day (Johnson et al., 2000) while its metabolites estrone (E1) and estriol (E3) are excreted by
21
reconverted to parent compounds by bacteria in sewage treatment plants or aquatic environment (Racz & Goel 2009; Hu et al., 2003).
Improper disposal of unused pharmaceutical drugs is another pathway through which EDCs enter surface waters. Unwanted prescription drugs are often flushed down the toilet or disposed with household waste as trash. Such improper disposal methods cause drugs to end up in landfills and waste water treatment plants (WWTPs) (Heberer 2002). Pharmaceuticals such as atenolol, gemifibrozil, erythromycin, and ranitidine have been detected in streams and drinking water (Kolpin et al., 2002). A public health concern associated with detection of these compounds arises from an in vitro study that showed their estrogenic activity (Isidori et al., 2009) while another study reported positive estrogenic responses from pharmaceuticals such as paracetamol, fenofibrate, cimetidine, and furosemide (Fent et al., 2006).
22
usually having the highest concentration (Desbrow et al.,1998; Ternes et al., 1999; Belfroid et al., 1999).
Apart from incomplete removal, little is known about the possible transformation products produced during wastewater treatment processes. In vitro studies showed that chlorinated E2, bisphenol A (BPA), and 4-nonylphenol generated different transformation products with estrogenic activity. The estrogenic activity of chlorinated E2 solutions at 10, 30 and 60 minutes was similar but slightly lower than the unchlorinated parent compound (Hu et al., 2003) while 4-nonylphenol solution chlorinated for 10 minutes generated a reduced estrogenic response of 30 percent (Hu et al., 2002). BPA showed a different trend from E2 and 4-nonylphenol with its estrogenic activity slightly increased after an hour of chlorination (Alum et al., 2004). Results from these chlorinated EDC studies showed that increased chlorination time decreased the activity of the respective compounds. Such lengthy chlorination reaction time may not be practical for WWTPs but has been shown to decrease or completely remove the estrogenic activity of E2, BPA and NP after 24 hours (Lee et al., 2004).
1.1.12 Occurrence Levels of Steroid Hormones and EDCs in U.S. Streams and Drinking Water
23
urbanization and livestock production. Levels of steroid hormones and some EDCs found in drinking water sources from this study are summarized in Table 1.6.
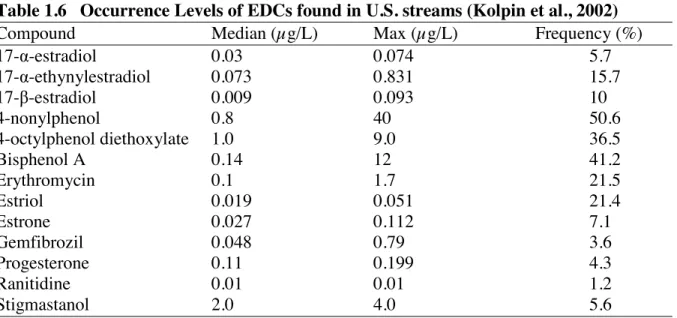
Table 1.6 Occurrence Levels of EDCs found in U.S. streams (Kolpin et al., 2002)
Compound Median (µg/L) Max (µg/L) Frequency (%)
17--estradiol 0.03 0.074 5.7
17--ethynylestradiol 0.073 0.831 15.7
17--estradiol 0.009 0.093 10
4-nonylphenol 0.8 40 50.6
4-octylphenol diethoxylate 1.0 9.0 36.5
Bisphenol A 0.14 12 41.2
Erythromycin 0.1 1.7 21.5
Estriol 0.019 0.051 21.4
Estrone 0.027 0.112 7.1
Gemfibrozil 0.048 0.79 3.6
Progesterone 0.11 0.199 4.3
Ranitidine 0.01 0.01 1.2
Stigmastanol 2.0 4.0 5.6
Among the identified EDCs, natural and synthetic hormones derived from human and animal release are more estrogenic than others normally found at higher concentrations in surface and groundwater as shown in Figure 1.2.
24 1.1.13 Source Water Quality Protection
Human waste, pesticides, and improperly disposed chemicals can contaminate drinking water sources. In order to protect public health, the Safe Drinking Water Act (SDWA) was established in 1974 and it regulates the nation’s drinking water except private wells that serve less than 25 individuals. The Act also authorizes the U.S. EPA to set standards for drinking water while working with states and water systems to ensure compliance (U.S. EPA, 1974).
One of the tools used by the SDWA is the National Primary Drinking Water
Regulations (NPDWRs) that limit the levels of contaminants found in drinking water and has well established enforceable standards or MCLs for microorganisms, disinfectants, DBPs, radionuclides, and organic/inorganic chemicals (U.S. EPA, 2009a). Unlike the MCL, Maximum Contaminant Level Goals (MCLGs) are not enforceable standards but are set at levels for which no adverse health effects are known to occur in humans. A regulated DBP such as chlorite has a MCLG/MCL in drinking water of 0.8 and 1.0 mg/L, respectively while that for bromate is 0 and 0.010 mg/L. THM4 do not have a collective MCLG but some individual species such as chloroform, dibromochloromethane and bromoform have one of 0.07, 0.06, and 0 mg/L, respectively, in drinking water. Haloacetic acid species such as trichloroacetic, monochloroacetic acid, and dichloroacetic acid also have a MCLG of 0.02, 0.07, and 0 mg/L, respectively, in drinking water (U.S. EPA, 2006b).
Apart from the NPDWRs, the U.S. EPA also uses the National Secondary Drinking Water Regulation (NSDWRs) to address 15 contaminants. Standards set under the NSDWRs are known as the Secondary Maximum Contaminant Levels (SMCLs) and are not
25
utilities in managing their drinking water for aesthetic considerations but exceeding their values does not pose any health risk to humans. Public water utilities with exceeded values usually have cloudy water with an odor and this discourages consumers’ consumption even though it is still safe (U.S. EPA, 1991).
Unregulated contaminants that may require drinking water regulation in the future are also identified by the SDWA and placed on the Contaminant Candidate List (CCL). There are currently 116 chemicals and microbial contaminants listed on the Contaminant Candidate List 3 (CCL3) and the U.S. EPA decides which ones would be regulated based on research and occurrence data. Unregulated estrogenic hormones such as E1, E2, E3, EE2 with
confirmed adverse health effects on aquatic organisms are listed on the CCL including DBPs such as nitrosodimethylamine (NDMA), nitroso-di-n-propylamine (NDPA),
N-nitrosodiphenylamine, N-nitrosopyrrolidine (NPYR) and N-nitrosodiethylamine (NDEA) (U.S. EPA, 2009b).
The Drinking Water Strategy (DWS) is another approach that was developed recently in 2010 by the U.S. EPA to protect the nation’s drinking water and its goals are to address contaminants found in drinking water as a group, foster development of new drinking water technologies, apply the authority of multiple statutes to drinking water, and provide a
network between states so that data on drinking water can be shared (U.S. EPA, 2010a). The agency hopes that these goals provide more public health protection and assist communities in identifying cost effective treatment technologies to provide water to consumers at a
26
1.1.14 The Endocrine System – A Master Regulator of Development
The endocrine system, also known as the hormone system, consists of glands, hormones, and receptors (Toppari 2008; U.S. EPA, 1998c). The glands are located
throughout the body and are responsible for synthesizing and secreting hormones. Hormones act as chemical messengers and are released into the bloodstream and their goal is to find compatible receptors in the various target tissues and organs. More than 50 hormones with different functions have been identified in the endocrine system of humans and other living organisms. The antidiuretic hormone is an example of a hormone produced by the pituitary gland that helps to stimulate water reabsorption by the kidney tubules. Others include adrenaline and noradrenaline produced by the adrenal glands to help the body react under stressful conditions. The endocrine system found in nearly all animals basically regulates a wide range of biological processes like metabolism, growth, reproduction, and development of the brain (U.S. EPA, 1998c). Disturbances of this system that may involve overactive and underactive hormone secretion can cause harmful effects in the body (Nilsson 2000; Toppari 2008; Lee et al., 2010; Henley & Korach 2006).
1.1.15 Genomic Mode of Action of Steroid Hormones
Steroids represent one of the major classes of hormones synthesized from cholesterol and consist of the sex hormones known as estrogen and androgen (U.S. EPA, 1998c).
27
Steroid hormones are involved in the genomic and non-genomic pathway in order to generate a biological response in the body (Sharma 1999; Beato et al., 1996). The former begins when the steroids are released into the bloodstream, and their goal is to find
compatible receptors in tissues and organs. Inactive steroid receptors are usually located in the cytoplasm of a cell and have complexes called heat shock proteins attached to them. When a steroid hormone diffuses across the cell membrane and gets into the cytoplasm of a cell, it binds to its compatible receptor. This action in addition to phosphorylation causes the receptor to become activated, thereby causing the dissociation of the heat shock proteins. The complex formed at this point (consisting of two receptors having a molecule of hormone) crosses into the nucleus of the cell and binds to hormone responsive elements on a gene. This action causes the gene to be activated and undergoes transcription to form messenger
ribonucleic acid (mRNA) that eventually gets transported into the cytoplasm. Ribosomes in the cytoplasm causes translation of mRNA to form protein and this final product can be a peptide hormone, growth factor or enzyme that plays major functions as part of the endocrine system (U.S. EPA, 1998c).
28
Figure 1.3: Genomic Mode of Action of the Steroid Hormone (Purves, 1998)
1.1.16 Mechanisms by which EDCs could Influence the Endocrine System
29
one that would be much stronger than that of the natural hormone. An example of such a situation may involve generation of growth factors at inappropriate time, thereby leading to increased muscle mass. A second proposed mechanism through which EDCs could influence the endocrine system is by acting as anti-estrogenic or anti-androgenic compounds
preventing the normal binding of the natural steroid hormone to its receptor. An action like this modifies the secretion, synthesis, binding action, transport, or elimination of the natural steroid hormone. Anti-estrogenic or anti-androgenic activities of EDCs could cause abnormal development due to improper synthesis of growth factors by the endocrine system (U.S. EPA, 2010a). A third proposed mechanism involves interaction with the enzymes that are responsible for synthesizing the steroid hormones. Aromatase (a cytochrome P450 enzyme) converts testosterone to E2. EDCs can interfere with the normal functioning of this enzyme, thereby causing overproduction or underproduction of E2.
1.1.17 Predicting Estrogenic Activity of Exogenous Chemicals
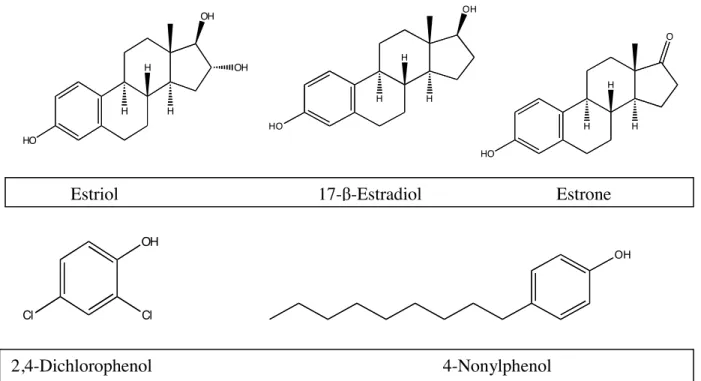
There are significant challenges in using structures to determine if chemicals are capable of disrupting the endocrine system. Structures of steroid hormones and other chemicals that have been shown to have a relative binding affinity to the estrogen receptor are shown in Figure 1.4. Structural similarities between steroids and compounds with confirmed estrogenic activity include the presence of two rings (one of them usually
30
The relative binding affinity of steroid hormones and other chemicals to the estrogen receptor is strongly enhanced by the presence of hydroxyl groups on the A and D rings (Bohl et al., 1987). The hydroxyl group of the phenolic A-ring is involved in binding with specific amino acids on the estrogen receptor (Fang et al., 2001). Modification of the steroid hormone structure and that of other chemicals by the addition of other functional groups reduces their relative binding affinity to the estrogen receptor, thereby causing reduced estrogenic activity. The addition of a hydroxyl group at position C-2, C-4, and C-16 of steroid hormones has also been shown to cause reduced estrogenic activity and this criterion explains why estriol has a lower activity when compared to estrone (Tanaka et al., 2001).
Figure 1.4: Structures of Hormones and other Chemicals with Confirmed Estrogenic Activity
While there appears to be some generalized common structural features among EDCs found in surface waters, the criteria described above cannot be applied to all chemicals in order to determine their estrogenic activity. As an example of this challenge, an in vitro study
HO
OH OH
H H
H
HO
OH
H H
H
HO
O
H H
H
OH
OH
Cl Cl
Estriol 17--Estradiol Estrone
31
using the yeast estrogen screen (YES) assay showed that the pharmaceutically active compounds erythromycin and cimetidine induced estrogenic activity (Isidori et al., 2009) while an in vivo study suggested that the drinking water DBP dibromoacetic acid may also have such activity (Goldman & Murr 2003).
As shown in Figure 1.5, the pharmaceuticals from the Isidori et al. (2009) study do not have the structural features described previously. Results from in vitro studies showed that the phenolic compounds shown in Figure 1.6 induced no estrogenic activity despite having structural similarities to 2,4-dichlorophenol and 2-chlorophenol (Nishihara et al., 2000; Olsen et al., 2002). Disinfection can cause transformation of chemicals into products that may be less estrogenic (Hu et al., 2003; Alum et al., 2004; Lee et al., 2004) but the inability to identify the chemical structure of all transformation products may become an issue when trying to predict estrogenic activity in drinking water.
Figure 1.5: Structures of Pharmaceuticals and DBPs with Suspected Estrogenic Activity
32
Figure 1.6 Structures of Phenolic Compounds Lacking Estrogenic Activity
1.1.18 Response to the Presence of EDCs found in the Environment
In 1996, the United States Congress responded to societal concerns by making amendments to the Food Quality Protection Act (FQPA) and the Safe Drinking Water Act (SDWA). These amendments gave the U.S. EPA authority to develop a screening and testing program by using validated test systems and scientific information to determine if pesticide chemicals and substances found in drinking water had the potential to cause effects that would normally be produced by human hormones. Based on these amendments, the agency also had the authority to screen other chemicals that could also affect other pathways of the endocrine system. In October 1996, the Endocrine Disruptor Screening and Testing Advisory (EDSTAC) was assembled to provide advice to the U.S. EPA on how to design a screening and testing program for endocrine disruptors. Recommendations from the EDSTAC required the U.S. EPA to evaluate both human and ecological (wildlife) effects, examine effects related to estrogen, androgen and thyroid hormone processes as well as testing both individual substances and common mixtures (U.S. EPA, 1998c). Among the EDSTAC recommendations, it was suggested that DBPs be included in the mixtures evaluated for endocrine disrupting activity based on suspected interference with the carefully regulated hormonal messenger system, a finding that has been confirmed by various studies (Brittebo
OH Cl
Cl Cl
OH
Br Br