Development
KC Egger [email protected]
Brian Ford [email protected]
Kyle Nagao [email protected]
Neal Sharma [email protected]
Donovan Zusalim [email protected]
Sponsored by:
Faculty Advisor: John Fabijanic Project Advisor: Dr. Joseph Mello
Mechanical Engineering Department
ii
This project was made possible by generous donations from companies and individuals alike. We would like to express our sincere gratitude to these sponsors, who have allowed our project to flourish by providing materials, services, and technical knowledge.
We would also like to thank the members of the 2019-2020 Cal Poly Racing team for their help. We hope that this report will help you succeed in future race seasons!
iii
was requested to improve subsystem integration, increase torsional stiffness, and reduce weight compared to the previous platform. Specifically, this senior project team focused on manufacturing process improvement and laminate design to meet these goals for the 2020 Formula SAE competition.
This report details the design and manufacturing of such a chassis. Specific emphasis was placed on the geometry, laminate, and manufacturing process design. The geometry was designed using subsystem input for satisfactory integration of all subsystem components while maintaining a high specific torsional stiffness. The team also developed numerous analysis tools including spreadsheets and finite element models to design the asymmetric laminate of the chassis. Modular, multi-piece tooling was designed to produce a single-piece chassis and to allow for easy geometric changes in the future.
iv
Table of Contents
Statement of Disclaimer
i
Abstract
iii
List of Figures
vii
List of Tables
xiv
Introduction
1
Background
3
Points Analysis
3
Carbon Fiber Sandwich Panel Laminae
4
Composite Chassis Laminate
5
Previous Chassis Designs
8
Manufacturing Methods
11
Existing Analysis Tool
14
Classical Laminate Plate Theory Model
14
Objectives
15
Problem Statement
15
Boundary Diagram
15
Customer Requirements
15
Specifications
15
Risk Analysis
17
Required Timeline
17
Design
19
Aerodynamic Concerns
19
Torsional Stiffness Concerns
20
Subsystem Integration
24
Geometry
27
v
Modeling & Laminate Design
44
Structural Equivalency Spreadsheet
44
3-Point Bend Models
47
Local Suspension Model - Lower Control Arm Boss
49
Local Suspension Model - Hardpoint Sizing
51
Torsional Stiffness Model
52
Thermal Warping Model
70
Chassis Weight Calculator
72
Cost Analysis
72
Manufacturing
74
Objectives
74
Manufacturing Concept
74
Baby Mold Proof of Concept
76
Plug and Mold Design
83
Male Plug
83
Flange Mating Between Molds
86
Female Molds
87
Draft Analysis of Molds
89
Mold Laminate
90
Mold Manufacturing
91
Plug Manufacturing
91
Mold Layup Test Samples
94
Mold Layups
96
vi
Assembly & Egg Crate
100
Mold Sanding & Finishing
101
Chassis Manufacturing
104
Test Layups
104
Chassis Layups
108
Design Verification
120
Geometry Verification
120
Structural Equivalency Testing and Summary
121
Chassis Performance Testing
127
Project Management
129
Roles and Responsibilities
129
Safety, Repair, and Maintenance
130
Cost Summary
130
Conclusions and Recommendations
131
Future Improvements
132
References
134
Appendix A: Chassis Architecture Decision Matrix
A-1
Appendix B: House of Quality
B-1
Appendix C: Material Technical Data Sheet Links
C-1
Appendix D: Local Failure Modes Spreadsheet
D-1
Appendix E: Chassis Weight Calculator
E-1
Appendix F: Expenses
F-1
Appendix G: Manufacturing Drawings
G-1
Appendix H: Design Verification Plan
H-1
Appendix I: Design Hazard Checklist
I-1
vii
competitions. ... 3
Figure 4. Example of a honeycomb core sandwich panel. ... 4
Figure 5.Figure from HexWeb ™ Honeycomb Sandwich Design Technology document supplied by Hexcel Corporation illustrating the analog between composite sandwich panels and a traditional I-beam. [2] ... 5
Figure 6. Representative excerpt of the Structural Equivalency Spreadsheet (SES). Each of the dimensions shown are the thicknesses of each material in mm. ... 6
Figure 7. Harness mount test panel. ... 6
Figure 8. Example drawing of an asymmetric sandwich panel laminate. ... 7
Figure 9. 3-point bend test setup for SES. ... 8
Figure 10. 2013 Formula Chassis Works partial monocoque chassis at competition. ... 9
Figure 11. 2015 Frame Engineering Associates cut-and-fold chassis. ... 9
Figure 12. 2017 Formula SAE car produced by Carbon Fiber Monocoque Chassis Platform for Formula SAE and Formula SAE Electric Race Cars. ... 10
Figure 13. Half spool, potted insert geometry (left) and testing the two hardpoint designs (right). ... 10
Figure 14. First iteration of the full chassis & rigid link suspension model. ... 11
Figure 15. Chassis torsional stiffness test rig. ... 11
Figure 16. Industry standard for the insert potting process. ... 12
Figure 17. Ecurie Aix front quarters of four piece molds. ... 12
Figure 18. University of Washington one-piece layup. ... 13
Figure 19. Flat panel properties for a single and multi-stage cure... 13
Figure 20. Mesh element of a laminate based on a given line load. ... 14
Figure 21. Boundary diagram describing relationship between team, vehicle, and senior project objectives. ... 15
Figure 22. Team and class critical dates for Fall and Winter 2019. ... 18
Figure 23. Preliminary undertray design mounted on the 2019 chassis. ... 19
Figure 24. Diffuser section preliminary design. ... 19
viii
Figure 26. Preliminary CFD analysis of chassis with diffuser section. Wheels are not shown for
clarity. ... 20
Figure 27. Simplified vehicle rigid link model including suspension links and chassis. The lower arrow points at the chassis as a torsion spring, and the upper arrow points at the quarter car suspension. ... 21
Figure 28. Lateral load transfer distribution as a function of roll stiffness distribution with varying chassis torsional stiffnesses. Non-linearity increases as torsional stiffness decreases. ... 22
Figure 29. Step steer response of lateral load transfer with varying torsional stiffnesses. As stiffness increases, the dynamic response time and oscillation magnitudes are decreased, lending to quick vehicle response. ... 22
Figure 30. Top view of the chassis modeled as a spring in series. Each geometric cross-section has a different stiffness value. ... 23
Figure 31. Torsional stiffness as a function of chassis dimensions. ... 23
Figure 32. 2017 rear suspension geometry showing aft mount. ... 24
Figure 33. 2019 suspension geometry with in-plane rockers and double shear mounts. ... 25
Figure 34. University of Washington rear packaging. ... 25
Figure 35. Preliminary chassis guide sketches including parting mold lines, template cross-sections, and rear bulkhead geometry. ... 26
Figure 36. Conceptual chassis geometry, including planar faces. ... 27
Figure 37. Preliminary iteration of the entire vehicle. ... 28
Figure 38. Iteration through chassis changes. ... 29
Figure 39. Preliminary geometry set by packaging and rules requirements. ... 29
Figure 40. Lower control arm mounting location. ... 30
Figure 41. Refined preliminary geometry. Note the lower control arm boss added to the lower front of the cockpit and the flat shock “shelf” at the rear. ... 31
Figure 42. Refined preliminary geometry. Rear step-down rocker chamfer, highlighted in red, added for suspension mounting. ... 31
Figure 43. Rear step-down rocker chamfer terminated with drafted cut to remove non-planar geometry. ... 32
Figure 44. Rear step-down angle increase to improve torsional stiffness. The step-up to the rocker shelf was also eliminated. Note that the sidewall height was also raised to improve the torsional stiffness. ... 32
Figure 45. Draft, chamfer, and fillets added to rear section... 33
Figure 46. Top of front of chassis made flat to allow for top-mounted shocks. The sidewall height was also raised according to the torsional stiffness study discussed later. ... 33
Figure 47.“Hump” or “swoop” in front of the front roll hoop to allow for steering wheel clearance per the rules. ... 34
ix
Figure 55. Rear suspension package. The rocker and shocks are mounted on the chamfered rocker
“shelf”. ... 37
Figure 56. Front suspension package. Lower control arm is mounted to boss, rocker is mounted to planar surface, and shock is mounted to a flat top. ... 38
Figure 57. Engine and drivetrain packaging in combustion car. ... 38
Figure 58. Battery box, motor, and drivetrain packaging in electric car. ... 39
Figure 59. Cockpit with 95th percentile male model. ... 39
Figure 60. Symmetric Test sample being checked against a micro-flat reference table. ... 40
Figure 61. Images of single-stage cured sample pieces after destructive testing. ... 41
Figure 62. Comparison between single-stage and dual-stage load versus displacements. ... 42
Figure 63. Test data from 2017 panel. ... 43
Figure 64. Resultant displacements after convergence study. ... 43
Figure 65. Steel tube baseline 3-point bend test setup. ... 46
Figure 66. Perimeter shear test setup. ... 47
Figure 67. 3-point bend strain energy. ... 48
Figure 68. Typical sandwich panel failure modes. ... 48
Figure 69. Chassis model and load paths. ... 49
Figure 70. Normal shear stress, Z direction. ... 51
Figure 71. Hardpoint sizing model. ... 52
Figure 72. Local hardpoint FEM. ... 52
Figure 73. CPFSAE 2019 main hoop bracing configuration. ... 53
Figure 74. Sample inboard boundary conditions. Vertices are constrained to the chassis using pinball regions (shown in blue). ... 54
Figure 75. Torsional stiffness full vehicle constraints to model ground. ... 55
Figure 76. Maximum principal stresses, no forward sweep. ... 55
Figure 77. Maximum principal stress. ... 56
Figure 78. Maximum principal stress distribution, chassis floors. ... 57
Figure 79. Total torsional deformation without a forward swept bracing. ... 57
x
Figure 81. Total torsional deformation with forward swept bracing. ... 58
Figure 82. Color coded preliminary laminate breakdown as specified in Table 9. ... 59
Figure 83. Initial torsional stiffness model with developed geometry, suspension points, and laminate. ... 60
Figure 84. Strain distribution of initial model. ... 61
Figure 85. Strain hotspots at the cockpit transition from the front bulkhead support. ... 61
Figure 86. Strain hotspots at the rear stepdown. ... 62
Figure 87. Strain at the monocoque floor height transition. ... 62
Figure 88. Strain hotspot at the rocker and control arm mounts. ... 63
Figure 89. Partitioned cockpit sidewall height. ... 63
Figure 90. Torsional stiffness as a function of cockpit sidewall height. ... 64
Figure 91. Rear stepdown angle sweeps. ... 64
Figure 92. Torsional stiffness sensitivity to stepdown angle. ... 65
Figure 93. Overhang at powertrain bay access hole added to provide additional stiffness. ... 65
Figure 94. Full vehicle energy. ... 66
Figure 95. Front suspension strain energy. ... 66
Figure 96. Final front suspension configuration. ... 67
Figure 97. Completed FEM with updated geometry. ... 68
Figure 98. Strain energy distributions. ... 69
Figure 99. Total deformation from cure cycle ramp down. ... 70
Figure 100. Second view of thermal deformation in the Z axis. ... 71
Figure 101. Thermal model with chassis and molds. ... 71
Figure 102. Vertical thermal deformation. ... 72
Figure 103.The geometry of the intended “baby chassis” on the left, andthe sliced “baby mold” plug with bottom flange on the right. ... 77
Figure 104. The machining of one of the baby mold plug quarters done on a 3-axis router. ... 77
Figure 105. Foam mold quarters with their added vertical flanges. Notice the machined registers in the bottom corner of the flange to align the parts for gluing. ... 78
Figure 106. The resin sealed foam plug with drill bushings (left). The orange bits are earplugs used to keep resin out of the drill bushing holes. The rough, undesirable resin surface is shown on the right. ... 78
Figure 107. Each of the baby mold quarters curing under vacuum. ... 79
Figure 108. Cured carbon molds not yet released from the plug. ... 79
Figure 109.“Releasing” the carbon mold from the plug. ... 80
xi
Figure 117. Rear RHS plug (left) and front RHS plug (right). Notice the large bosses at the centerline, harness bar line, and extending from the cockpit opening and the matching mating
holes on the harness bar bosses between the front and rear geometry. ... 85
Figure 118. Transverse flanges that may need to be machined separately. ... 85
Figure 119. Resin pin and steel bushing in male plug before layup of female mold. ... 86
Figure 120. Plasticine illustration. “Wax” refers to plasticine. ... 87
Figure 121. Female mold assembly. ... 87
Figure 122. Front RHS female mold inside view (left) and outside view (right). ... 88
Figure 123. Rear RHS female mold inside view (left) and outside view (right). ... 88
Figure 124. Front cutout for front access in mold. ... 89
Figure 125. Draft analysis of molds. Green indicates positive draft of 2 or more degrees. Flanges are hidden for clarity. Note that though not visible, the bottom surfaces are green. ... 90
Figure 126. PTM&W 2520 resin suggested post cure cycle ... 90
Figure 127. Locations to add core on the chassis mold... 90
Figure 128. 4 layer stock design concept (left) projected onto the master geometry (right). Order of machining: 2, 3, 4, 1. Notice that the flange surface at the bottom of the geometry does not align with the bond line between layers 2 and 3. ... 92
Figure 129. Large bond lines near important features (left) and delamination (right) only revealed after machining. ... 92
Figure 130. MCD team and CPFSAE team volunteer beginning to sand the FR foam plug. ... 93
Figure 131. Sealed and sanded PVC Lacquer layer on the FR plug. ... 94
Figure 132. MCD members moments after discovering the 3rd and 4th tests released. ... 95
Figure 133. Room temperature determined by measuring thermocouples inserted within the foam (left), warmer box temperature determined by measuring thermocouples inserted into the box (right). ... 95
Figure 134. Application of the surface coat in a thick layer. ... 96
Figure 135. Wetting out carbon and removing masking tape (left), applying wet carbon and squeegeeing out air (right). ... 97
Figure 136. FR mold inner skin being debulked. ... 97
xii
Figure 138. Closeout concept to increase durability and comfort. ... 98
Figure 139. Removal of the FR mold from the plug. Notice the severely damaged plug and adhered foam on the surface coat. ... 99
Figure 140. Surface coat cracking along the rearmost flange on the rear molds. ... 99
Figure 141. Voids in the surface coat crack along planar faces (left) as well as corners (right). .... 100
Figure 142. Egg crate structure (left) and female mold supported by egg crate (right). ... 101
Figure 143. Injecting structural adhesive between laminate(right) and curing under clamping pressure(left). ... 101
Figure 144. At first, voids were filled using PTM&W PT1995 (left) but PTM&W Poly Filler HT (right) was later favored for its ease of sanding and quick cure time. ... 102
Figure 145. Finding low spots on the normal face of the flanges between mating mold pieces. ... 102
Figure 146. Front bulkhead fill in procedure. Loctite 9396 was first applied and cured, then a mix of Loctite 9396 and chopped fiber was added for extra structure. ... 103
Figure 147. Coated FCLA boss. ... 103
Figure 148. Bonding in the FLCA insert. ... 104
Figure 149. Plasticine filled and unfilled mating lines (left) lie underneath the test layup (right). 105 Figure 150. Flash tape as a bridge between mating mold pieces (left), verifying function of the access holes during a layup (right). ... 105
Figure 151. Unmated seam between the front quarters (left) and attempt to apply flash tape under overlapping plies. ... 106
Figure 152. Attaching breather and release ply. ... 106
Figure 153. Donut bag feed direction through rear powertrain bay and out through hole in front bulkhead section. Though effective, the bag was difficult to manufacture and was an inefficient use of bagging material. ... 107
Figure 154. Donut bag through powertrain bay (left) and vacuumed bag (right). ... 107
Figure 155. Released single ply skin at the rear mold. ... 108
Figure 156. Carbon templates broken down by section. The cockpit floor (not pictured) consisted of three templates. ... 108
Figure 157. Core template example. ... 109
Figure 158. Localized vacuum bag on the inner surface. ... 110
Figure 159. Team members laying up a unidirectional ply in one of the quarters. ... 110
Figure 160. Pad-ups at suspension, engine, and harness mounts. ... 111
Figure 161. Film adhesive applied to one quarter. ... 111
Figure 162. Struggling to remove flash tape and interweave layers. ... 112
Figure 163. Front bulkhead/front bulkhead support corner before (left) and after (right) pulling the flash tape. Interweaving plies in corners was particularly difficult. ... 112
xiii
Figure 169. Wedging under the RL (left) and released surface (right). ... 116
Figure 170. Bondo stuck to chassis surface (left) and resulting void in mold surface (right). ... 116
Figure 171. Wedges stuck between monocoque and RR mold. ... 117
Figure 172. Dented chassis wall (left) and the outer skin removed (right) in order to perform a wet layup repair. ... 117
Figure 173. FBHS surface of combustion vehicle chassis. ... 118
Figure 174. Delamination between core and outer skin (left) and a portion of subsequent repair (right). ... 118
Figure 175. Seam down the centerline of the monocoque floor. ... 119
Figure 176. Cockpit opening template (left) and cross-section template (right) as specified in the 2020 Formula SAE rules. ... 120
Figure 177. Chassis cockpit opening template (horizontal grey plane). Template must be lowered to a height of 350mm above the ground plane (pictured) without interfering with the chassis or the roll hoops. ... 121
Figure 178. Chassis internal cross-section template (white). Template is allowed to move
vertically as needed but must not interfere with any vehicle components. ... 121
Figure 179. Breakdowns of different areas of the monocoque. Green contains FBHS, yellow contains SIS, blue contains driver harness mounting, purple contains main hoop mounting and fuel system protection (CP19C) and tractive system protection (CP19E). ... 122
Figure 180. 3-point bend results from initial layup iterations. ... 123
Figure 181. Perimeter shear test results for the initial layup iterations... 124
Figure 182. SES sheet showing FBHS compliance. Laminates can pass via flat panel or second moment of inertia. ... 125
Figure 183. Lower harness being tested. ... 126
Figure 184. Upper harness inverted 3-point bend test jig. ... 127
Figure 185. Chassis torsional stiffness test rig. Notice the scissor jack applying load to the FR jig, while a dial indicator measures the displacement of the FL jig. ... 128
Figure 186. The combustion car chassis being painted before campus closure... 131
xiv
List of Tables
Table 1: Team Point Sensitivities ... 4
Table 2: Parameters Developed using QFD ... 16
Table 3: Stage-cured Samples and Failure Modes Under Compression ... 41
Table 4: Model Summary ... 44
Table 5: SES Regulated Structural Areas and Equivalency Criterion ... 45
Table 6: Acceleration and Contact Patch Load Cases ... 50
Table 7: Link Loads Applied to Chassis Suspension Mounts ... 50
Table 8: Forward Bracing versus Rearward Bracing Weight Difference ... 54
Table 9: Preliminary Layup Schedule with Color Code ... 59
Table 10: Chassis Manufacturing Steps ... 75
Table 11: Comparison Between Target and Actual Completion Dates ... 91
Table 12: Test Sample Results ... 94
Table 13: SES Test Layups ... 122
Table 14: Final SES Layup Schedule ... 127
Table 15: Team Roles ... 129
1
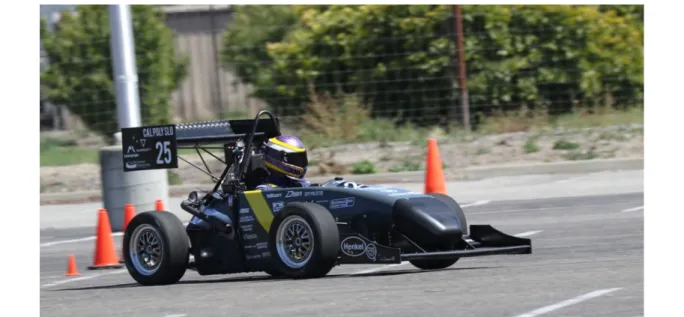
Chassis Development (MCD), sought to improve the team’s overall performance in both the static and dynamic events by creating an improved chassis platform for the 2019-2020 and future teams.
Figure 1. The 2018 CPFSAE combustion car pictured during Formula SAE Lincoln 2018.
2
3
of a monocoque chassis unappealing to many teams. However, if implemented successfully, a monocoque chassis can offer significant performance gains when compared to a traditional tube-frame chassis.
Points Analysis
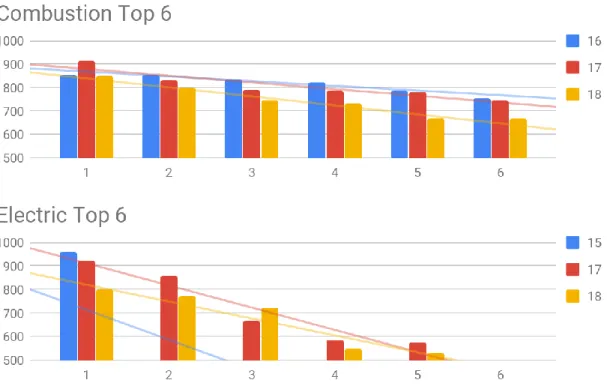
The 2020 team targeted a top-three finish. Based on historical data and the trendlines included in Figure 3, this would require obtaining over 800 points with the combustion car and 750 points with the electric car.
Figure 3. Historic points obtained per position in 2016, 2017, and 2018 Formula SAE Lincoln competitions.
4
Table 1: Team Point Sensitivities
Goal
Car
Sensitivity
Cut weight
Combustion - Losing 33.4 lbs: 5 pts gained in endurance, 4 pts in autocross ~ 9 pts total
Electric -Losing 22.7 lbs: 3 pts gained in endurance, 2 pts in autocross ~ 5 pts total
Decrease dynamic
times
Combustion
-Acceleration event: (47 pts/sec gained) -Skidpad event: (33 pts/sec gained) -Autocross event: (4.9 pts/sec gained)
-Endurance event: (6.6 pts/sec gained each lap)
Electric
-Acceleration event: (47 pts/sec gained) -Skidpad event: (41 pts/sec gained) -Autocross event: (4.5 pts/sec gained)
-Endurance event: (5.5 pts/sec gained each lap)
Carbon Fiber Sandwich Panel Laminae
To produce a high stiffness to weight ratio, carbon fiber honeycomb sandwich panels are typically used in the design of monocoque chassis. Honeycomb sandwich panels like the specimen shown in Figure 4 are also widely used in the aerospace industry due to the high specific stiffness that can be achieved with proper laminate design.
Figure 4. Example of a honeycomb core sandwich panel.
5
Figure 5. Figure from HexWeb ™ Honeycomb Sandwich Design Technology document supplied by Hexcel Corporation illustrating the analog between composite sandwich panels and a traditional I-beam. [2]
Since the bending strength and stiffness is highly dependent on the lamina and orientation chosen for use in the sandwich panel’s skins, panels can be designed to produce the desired material properties in specific directions, which is more efficient than the standard behavior of an isotropic material. The benefits of this and the methods of manipulation will be discussed later in the report.
The benefits gained from using a fiber composite honeycomb structure entail their own specific design criteria. Since the materials are just many different elements bonded together, numerous modes of failure can occur in this type of composite laminate. Some of the failures that can occur with a composite sandwich panel laminate are skin failure, skin buckling, panel core shear, skin wrinkling, intracell buckling, and local compression and skin delamination. While the expected behavior of a sandwich panel can be modeled using plate theory, it is important to physically test all sample laminate designs with design loads as the failure modes of each panel vary greatly on the loading conditions and manufacturing quality.
Composite Chassis Laminate
6
Figure 6. Representative excerpt of the Structural Equivalency Spreadsheet (SES). Each of the dimensions shown are the thicknesses of each material in mm.
Each of the sections has a specific set of requirements to pass, such as a minimal strength, minimal energy absorption, or minimal tear out strength. Representative panels with the same layup schedule are tested via 3-point bend and perimeter shear. However, the harness mounts have a specific test configuration, shown in Figure 7, where the harnesses are used to load the panel in tension to determine pullout strength. The motivation behind each test is to prove structural equivalency, ensuring the safety of the driver for any possible collision event.
7
Figure 8. Example drawing of an asymmetric sandwich panel laminate.
8
Figure 9. 3-point bend test setup for SES.
Previous Chassis Designs
9
Figure 10. 2013 Formula Chassis Works partial monocoque chassis at competition.
Frame Engineering Associates [4] was a 2015 senior project group that utilized the Alternative Frame rules, which allow for materials other than steel to be used for the side impact supports provided that extensive analysis in the form of FEA is produced. The result was a cut-and-fold chassis for the electric car comprised of planar sandwich panels bonded together and reinforced with wet-layups and microballoons, shown in Figure 11. The team managed to save approximately 40 lbs. versus the previous steel-tube frame but achieved a torsional stiffness of only 1200 ft-lb/deg, well below their target of 1800 ft-lb/deg, a number that was never validated.
Figure 11. 2015 Frame Engineering Associates cut-and-fold chassis.
The Frame Engineering Associates team utilized Abaqus CAE for their FEA model, with shell elements comprising the main frame and wire elements representing the suspension and roll hoop. The shell bodies were then partitioned by laminate schedule. Even though the MCD team’s analysis was completed in ANSYS, the general FEA technique and process developed by the Frame Engineering Associates team is still utilized.
10
Figure 12. 2017 Formula SAE car produced by Carbon Fiber Monocoque Chassis Platform for Formula SAE and Formula SAE Electric Race Cars.
The 2017 team conducted an extensive study on chassis platform selection, quantifying the performance gains and losses of a monocoque, hybrid chassis, and steel tube frame, shown in Appendix A. In addition to designing the laminate and tooling, the team also performed detailed analysis on hardpoints and bolted joints connections to composite sandwich panels, developing potted inserts and pad-ups for increased localized stiffness.
Figure 13. Half spool, potted insert geometry (left) and testing the two hardpoint designs (right).
11
Figure 14. First iteration of the full chassis & rigid link suspension model.
This model is representative of how the chassis torsional stiffness is tested experimentally with three corners being supported by a steel I beam jig and a load applied at the free corner, shown in Figure 15.
Figure 15. Chassis torsional stiffness test rig.
In addition to developing several detailed analysis tools, the 2017 team also developed a robust manufacturing technique for producing tooling for a monocoque type chassis. The process and technique were used as a basis for the manufacturing of the 2020 chassis.
Manufacturing Methods
12
an industry standard commonly used for bolted joint connections to sandwich panels. By removing core and potting the section underneath the insert flange with structural adhesive, the localized area is reinforced for any shear load due to bending or normal load applied at a bolted connection, shown in Figure 16.
Figure 16. Industry standard for the insert potting process.
Improving localized reinforcement was beyond the scope of this project, and the 2017 configuration was successful. Therefore, the MCD chassis continued the same half spool insert design in the 2020 chassis. The MCD team also investigated the feasibility of a multi-piece mold and a single piece monocoque.
Figure 17. Ecurie Aix front quarters of four piece molds.
13
Figure 18. University of Washington one-piece layup.
In addition, the MCD team researched the performance benefits of a multistage cure. From Formula 1 Composites Engineering [5], a multistage cure allows one skin to remain flat against the mold during a cure cycle, whereas in a single stage cure the fibers get dimpled by the core under vacuum. The 2017 senior project did a study on this phenomenon with flat panel testing, shown in Figure 19. The 2020 MCD team did not pursue a staged cure since previous testing has shown the added manufacturing time outweighs the benefits of a staged cure.
Figure 19. Flat panel properties for a single and multi-stage cure.
14
Existing Analysis Tool
To tune the laminate to meet rules requirements, previous teams utilized a computational model based on classical laminate plate theory. With this model, a very coarse study can be conducted to eliminate a variety of layup configurations, thereby eliminating unnecessary manufacturing and testing time. Ideally, the desired layup performance can be narrowed down to a few options via analytical models, then further eliminated based on experimental data, determining the final panel layup schedule.
Classical Laminate Plate Theory Model
A MATLAB script was previously created to quantify the stresses and strains at each lamina due to line loads, moments, and thermal loads using classical laminate theory. In addition, it generates the shape of a single laminate element, shown in Figure 20.
Figure 20. Mesh element of a laminate based on a given line load.
15
A redesign of the Cal Poly Racing Formula SAE team’s carbon fiber reinforced polymer monocoque chassis was requested to improve subsystem integration, increase torsional stiffness, and reduce weight compared to the current platform. Specifically, the Formula SAE Monocoque Chassis Development team focused on manufacturing process improvement and laminate design to meet these goals. The team designed and manufactured a rules-compliant CFRP chassis, and its tooling, to compete in the 2020 Formula SAE competition.
Boundary Diagram
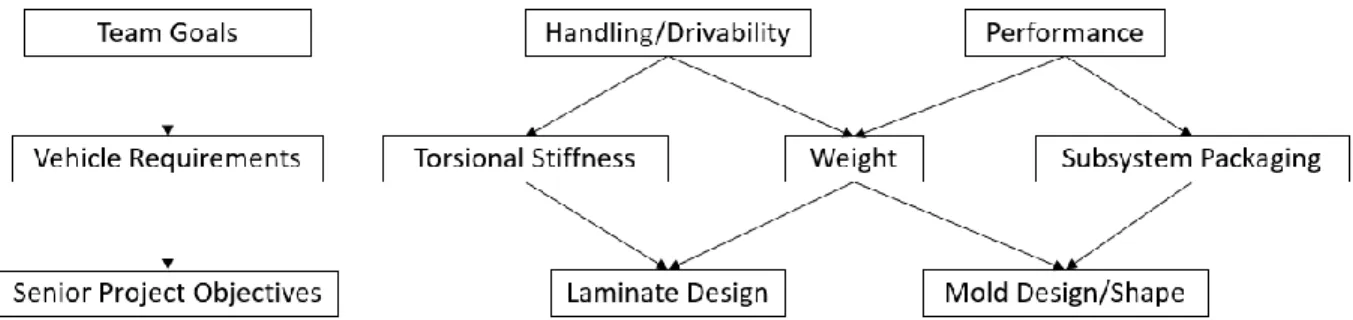
The 2020 CPFSAE team decided that two of the overall team goals were drivability and performance. These goals manifest in vehicle requirements, including increased torsional stiffness, decreased weight, and effective subsystem packaging. Based on these needs, the MCD team highlighted the key chassis parameters that could be improved to meet the team goals: laminate design and chassis shape. The relationship between the MCD and CPFSAE team is illustrated in Figure 21.
Figure 21. Boundary diagram describing relationship between team, vehicle, and senior project objectives.
Customer Requirements
The CPFSAE team and technical directors developed the specific project requirements necessary to obtain the points needed to achieve the desired podium finish at competition. The requirements include engineering specifications, a budget of $3000, and adherence to a strict timeline.
Specifications
16
Table 2: Parameters Developed using QFD
Spec # Design Parameter Target/Req. Tolerance Compliance Risk Notes
1 Torsional Stiffness 1700 ft-lbf/deg +/- 200 ft-lb/deg Analysis,
Test Medium See Note 1 Below
2 Weight 45 lb. +/- 5 lb. Analysis,
Test High See Note 2 below
3 Rear Packaging 3 ft3 +/- 0.5 ft3
Analysis, Inspection,
Similarity
Low See Note 3 below
4 Camber
Compliance 0.4 deg/g +/- 0.05 deg/g
Analysis,
Test Low See Note 4 below
5 Toe Compliance 0.02 deg/g +/- 0.005 deg/g Analysis,
Test Low See Note 4 below
6 Material Cost $2500 Maximum Analysis High See Note 5 below
7 Manufacturing Time
1000 man-hours
+/- 200
man-hours Analysis High See Note 6 below
8 Rules-Compliant Pass N/A Inspection Medium See Note 7 below
Note 1:
Torsional stiffness of the vehicle is measured with all suspension components on the car, and the target for torsional stiffness includes stiffness of the suspension members and mounting.
Note 2:
Chassis weight is measured after all post processing, including bonding joints (where required), all prep and paint work and reinforced mounting inserts.
Note 3;
Rear packaging accommodates the powertrain systems for both the combustion-powered car and the electric-powered car. While internal packing volume is a good indication of space, the difference in the geometry of the components to be packaged means that this is not a completely reliable metric for such a requirement.
Note 4:
17
The parameter “Rules-Compliant” encompasses any regulation required for the fielding of a CFRP chassis in a regulated Formula SAE competition. This includes SES regulations that may change from year to year, and any geometry restrictions such as template or any other geometry-based requirements.
Risk Analysis
The high-risk specifications were the weight of the chassis, cost of development and manufacturing, and manufacturing time. The chassis weight is very sensitive to other chassis parameters such as torsional stiffness. Generally, torsional stiffness and weight are proportionally linked since additional material may increase torsional stiffness. The weight is also sensitive to manufacturing processes, as lack of quality control can result in additional weight. The material cost is dependent on the sponsors and funding given to the club and is at the discretion of the 2020 CPFSAE Team Manager. If the CPFSAE team was not proactive with respect to procuring material and sponsors ahead of time, rushed shipping costs and the lack of availability could have driven up the price of otherwise free or discounted materials. The manufacturing time was also deemed high risk because it is reliant on the outsourcing of an already complex process. If a sponsor was forced to delay their involvement in the manufacturing process, alternatives would have been considered.
Required Timeline
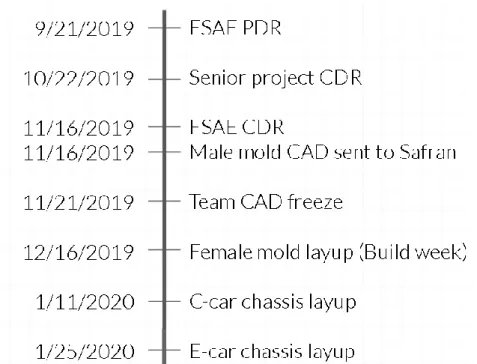
The chassis needed to be manufactured as early as possible so the team could meet overall vehicle manufacturing milestones during build season. Other subsystems required a complete chassis well before testing season to fit up their components and test their parts. Since manufacturing a new chassis with new tooling requires long lead times, an aggressive schedule, shown in Figure 22, was adopted.
The previous senior project team ran into numerous delays with the manufacturing of the plug, which was outsourced to Zodiac Aerospace (now Safran) in Santa Maria. Their overall timeline was pushed back 5 weeks, forcing drastic changes to the club’s timeline. Furthermore, the 2017 chassis mold failed to release from the plug, costing the team another 3 weeks to repair the mold surface. As a result, approximately 8 weeks of testing time was lost, and critical design validation data could not be acquired, resulting in the team dropping design points.
18
Figure 22. Team and class critical dates for Fall and Winter 2019.
19
Aerodynamic performance was factored into the design of the external geometry, but most of the aerodynamic design focused on improving the performance of the underbody aerodynamic devices (the “undertray”). An undertray, shown in Figure 23, creates a large low pressure region under the car, creating a net downward force. This is a very efficient way of producing more downforce with a lower drag penalty when compared to other aerodynamic devices such as wings. This downforce increases normal load on the tires, resulting in higher lateral force generation and faster lap times. The design of the aerodynamic components was beyond the scope of this project, but the senior project team worked with the relevant CPFSAE team members designing the components to ensure they performed as expected.
Figure 23. Preliminary undertray design mounted on the 2019 chassis.
To improve the performance of the undertray, two primary geometry changes were studied. The first is a diffuser section on the rear of the chassis. This allowed a larger, more aggressive undertray diffuser angle to fit with the chassis geometry, shown in Figure 24. A larger diffuser angle creates a stronger low pressure region under the car, increasing the net downforce created.
20
Second, the effects of a raised nose section like the model in Figure 25 were evaluated. This should allow more air to flow under the car and into the center section of the undertray. This increased mass flow would also increase the net downforce produced by the car.
Figure 25. Raised nose conceptual design.
The proposed geometry changes were analyzed using computational fluid dynamics (CFD) so performance predictions of the proposed changes could be evaluated without the need to develop models for physical testing. Required mesh settings and domain size needed for grid independence found from previous work completed by the CPFSAE were applied to the preliminary chassis study. All analysis was performed on simplified geometry consisting of the chassis outer mold line and the spinning wheels. Performance was evaluated at 35 mph, the average speed of the car.
Figure 26. Preliminary CFD analysis of chassis with diffuser section. Wheels are not shown for clarity.
CFD results from Figure 26 showed that there was minimal change in the net forces produced by the shape, so it was decided that aerodynamics would not be a driving design consideration for the geometry.
Torsional Stiffness Concerns
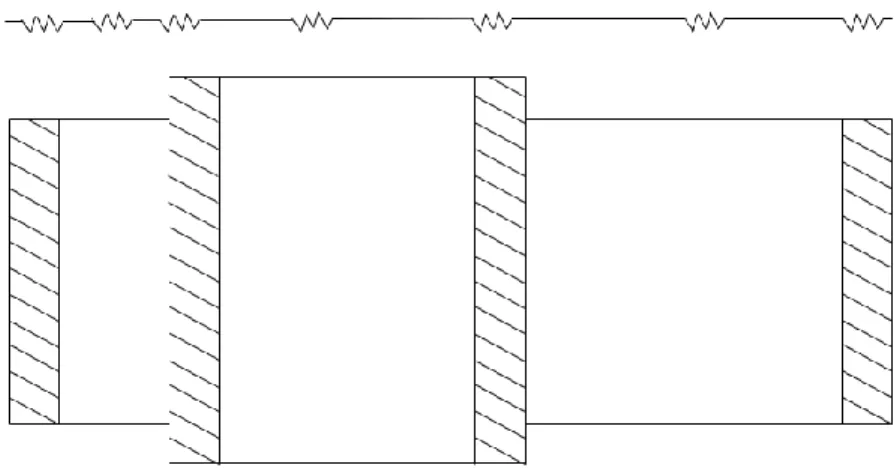
For optimal performance, the vehicles need to be predictable, respond quickly to driver input, and wield consistent handling throughout various operations. Chassis torsional stiffness, Kc, has a direct impact on vehicle handling, in both steady state and transient operating cases. Modeled as a spring in series, illustrated in Figure 27, the chassis acts as a torsional spring, deforming based on an equation where T is the torque applied, θ is the angular deformation, and J is the spring stiffness.
T = θ*J
21
Figure 27. Simplified vehicle rigid link model including suspension links and chassis. The lower arrow points at the chassis as a torsion spring, and the upper arrow points at the quarter car suspension.
22
Figure 28. Lateral load transfer distribution as a function of roll stiffness distribution with varying chassis torsional stiffnesses. Non-linearity increases as torsional stiffness decreases.
Beyond lateral load transfer sensitivities as a function of roll stiffness distribution, torsional stiffness has a quantifiable effect on the transient response of the vehicle. Using preliminary 2020 vehicle parameters, a quasi-static four wheel vehicle model was created. Sweeping through Kc values, a step steer input was utilized to quantify the dynamic response of the vehicle. As shown in Figure 29, an increase in torsional stiffness decreases the peak oscillation of front lateral load transfer.
23
Figure 30. Top view of the chassis modeled as a spring in series. Each geometric cross-section has a different stiffness value.
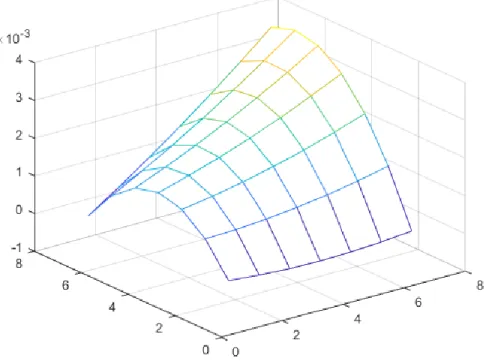
Using the 2019 chassis dimensions as a base metric, parameter sweeps were conducted to quantify general trends of stiffness, displayed in Figure 31.
Figure 31. Torsional stiffness as a function of chassis dimensions.
24
controls, engine, and accumulator. Dimension sweeps were normalized with the minimum value in the swept range to compare relative trends. Based on the study, the length of the powertrain bay had the largest effect on torsional stiffness.
Subsystem Integration
Another chassis requirement sensitive to the overall geometric design was subsystem packaging. Previously, the team had serviceability and packaging issues that stemmed from inadequate geometry. In 2017, when the overall shape of the chassis was being designed, the rear suspension architecture was designed with single shear rockers that mounted to the diagonal flats on the rear powertrain bay structure, shown in Figure 32. However, this geometry resulted in low torsional stiffness and poor load paths for the A-arms and pushrods, leading to heavy rockers, rocker mounts, and pushrods. Furthermore, the aft control arm mounts and tie rod inboard pick up points were limited by the end of the chassis, resulting in compound angle mounts, also shown in Figure 32.
Figure 32. 2017 rear suspension geometry showing aft mount.
25
Figure 33. 2019 suspension geometry with in-plane rockers and double shear mounts.
However, the 2017 chassis geometry was only designed for that year’s powertrain iteration, which has since been overhauled with major changes for both vehicles, specifically to the intake plenum, electric motor mounts, and motor controller location. Because of the chosen cutout locations with a small area at the top of the engine bay and a large cutout in the rear bulkhead, the powertrain components were very difficult to service and install, with assembly times of more than 2 to 3 hours. After gathering benchmark data from other teams at the 2018 competition and subsystem lead qualitative feedback, a large cutout located at the top of the chassis is more beneficial for accessibility. One example, shown in Figure 34, is the University of Washington rear packaging area, with a closed rear bulkhead and large cutout at the top for subsystem serviceability.
26
Furthermore, the previous chassis CAD was not easily editable, as most of the surfaces were generated by compound lofts and fillets. Whenever a subsystem wanted to interface with the chassis, a representative surface plane must be created, which is not accurate to the actual chassis. Because of this issue, the team had multiple subsystem assembly issues, including component to component interference and misalignment.
To improve iterative design, the chassis geometry was constructed with several front cross-sectional sketches a parting line, illustrated in Figure 35.
Figure 35. Preliminary chassis guide sketches including parting mold lines, template cross-sections, and rear bulkhead geometry.
27
Figure 36. Conceptual chassis geometry, including planar faces.
Geometry
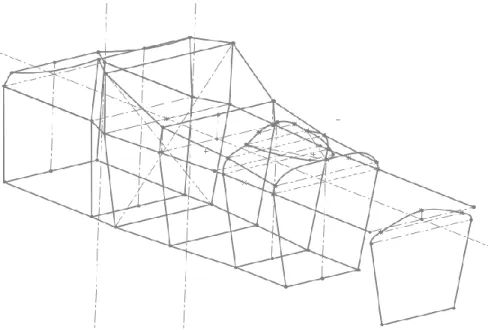
Two phases of design occurred for the monocoque, namely a preliminary iteration based on global vehicle requirements and a detailed iteration cycle in conjunction with detailed subsystem design.
Preliminary Iteration: Vehicle Requirements
The preliminary shape of the chassis was created using multiple loft sections, starting with the cockpit area, as this could be determined without any subsystem input. The cockpit width, length, and approximate sidewall height were all designed around a 95th percentile male, as dictated by the Formula SAE rulebook and general ergonomic design practices. At this point, the rest of the chassis was arbitrarily sized to get a reference point for subsystem input.
28
Figure 37. Preliminary iteration of the entire vehicle.
Detailed Iteration
29
Figure 38. Iteration through chassis changes.
After the first few weeks of the quarter, subsystems understood their packaging requirements, and the chassis was modified to the shape shown in Figure 39 to suit their preliminary needs. Among these initial changes included raising the front cockpit section height for steering and electronics packaging, adding front cutouts to improve access, and reducing the rear engine bay height to improve engine, drivetrain, and electronics access.
30
One of the major considerations of chassis design was suspension packaging. There are several considerations, namely packaging feasibility, kinematic targets, link loads, and chassis loads. With respect to chassis, the optimal load path is in-plane loading, as sandwich panels are strongest in-plane relative to the fibers. The rear of the chassis was extended to allow suspension A-arm angles to widen, lowering loads. The aft A-arm mounts were moved further back along the chassis, reducing loads by 20% relative to the previous year’s swept A-arm configurations.
For the front suspension, the change to 16” tires resulted the A-arm pickup points lowering by about 1” in Z. This resulted in an unideal mounting location, as the lower control arm pickup mount would have to mount to the lower chassis fillet, shown in Figure 40.
Figure 40. Lower control arm mounting location.
31
Figure 41. Refined preliminary geometry. Note the lower control arm boss added to the lower front of the cockpit and the flat shock “shelf” at the rear.
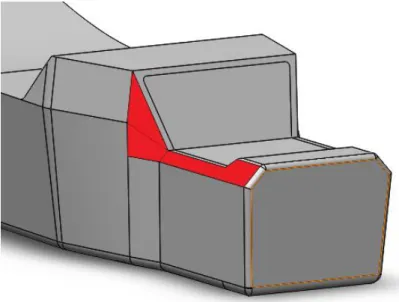
To lower shock CG height and to improve the shock load path into the chassis, a lowered shock mounting “shelf” was created, shown in the rear of Figure 41 and Figure 42. This allows for a low shock angle, resulting in better load path for torsional stiffness due to higher in-plane loading. However, the placement of the shocks on the “shelf” requires the use of suspension rockers. To produce a mounting surface for the rockers, a chamfer was added to the sides of the “shelf”.
Figure 42. Refined preliminary geometry. Rear step-down rocker chamfer, highlighted in red, added for suspension mounting.
32
Figure 43. Rear step-down rocker chamfer terminated with drafted cut to remove non-planar geometry.
After this change, the torsional stiffness model was run and produced a stiffness well below the target. Most of the stiffness loss occurred due to the sharp step-down angle. After speaking with subsystems that require rear access, the MCD team decided to increase that angle. This step-down angle needed to be kept low so as not to hinder engine bay access. A study, detailed in the torsional stiffness analysis portion of this report, found the smallest rear step-down angle that produced the desired torsional stiffness. The result is pictured in Figure 44.
Figure 44. Rear step-down angle increase to improve torsional stiffness. The step-up to the rocker shelf was also eliminated. Note that the sidewall height was also raised to improve the torsional stiffness.
33
Figure 45. Draft, chamfer, and fillets added to rear section.
Following the CPFSAE team CDR, the suspension team decided to go from a front pull-rod setup to a push-rod setup. Not only would this improve suspension kinematics and vehicle handling, but it would greatly improve the overall torsional stiffness. However, this meant that the front shocks would need to be mounted on the top of the chassis along the vehicle centerline. Therefore, the top of the chassis was flattened to simplify suspension mounting, shown in Figure 46.
Figure 46. Top of front of chassis made flat to allow for top-mounted shocks. The sidewall height was also raised according to the torsional stiffness study discussed later.
34
envelope [7]. This would have required the roll hoop to extend beyond the top of the chassis, adversely affecting aero and overall design aesthetics. The solution to this involved adding a “hump” or “swoop” in front of the front roll hoop as in Figure 47 to allow for the roll hoop to protrude slightly higher and cover the steering wheel. The 2017 chassis had a similar feature for the same reason.
Figure 47. “Hump” or “swoop” in front of the front roll hoop to allow for steering wheel clearance per the rules.
Final Geometry
After all iterations were made, the geometry was finalized for a manufacturability check. This included a symmetry check, draft study, and near complete re-ordering of the features used to create the preliminary model. The preliminary chassis model included many fillets that were either not necessary or created geometry that would not be feasible to layup in, especially when considering core. To better understand the implications of creating a mold, SolidWorks models were created to mirror the actual manufacturing process. A final rules check (discussed later) produced the finalized geometry shown in Figures 48-53.
35
Figure 49. Chassis front and rear views, respectively.
Figure 50. Chassis top view.
36
Figure 52. Chassis cross-section side view.
Figure 53. Cross-section isometric with edges shown.
Full Car Model
37
Figure 54. Full-car assembly with final chassis design.
38
Figure 56. Front suspension package. Lower control arm is mounted to boss, rocker is mounted to planar surface, and shock is mounted to a flat top.
39
Figure 58. Battery box, motor, and drivetrain packaging in electric car.
40
Analysis
In addition to the high-level geometric choices described in “Design,” the final chassis was designed using the following detailed analysis models. Preliminary tests explored asymmetric laminates as well as staged cures. Seven analytical models were created to define chassis laminate and specific shape. Torsional stiffness and energy absorption of the laminate were predicted and drove design decisions. Laminate strength and energy absorption predictions were tested using Formula SAE structural equivalency tests. Thermal analysis of the chassis during a cure cycle was done to predict manufacturability. Finally, cost and weight estimations were completed to set production goals for the chassis.
Preliminary Testing & Modeling
Early in the design process, test pieces were manufactured and tested for both warping and strength. This testing was conducted early-on to assess the physical feasibility and performance of asymmetric and stage-cured laminae. If the results were promising, they would warrant more computational analysis.
Warping in an asymmetric laminate occurs due to an imbalance in thermal stresses during the curing process. To mitigate this, the laminate can be cured in stages. In addition to studying the effects of stage curing, samples were also tested for strength and stiffness properties while loaded.
For the first test, an asymmetric laminate was cured using two separate cure stages. The geometry chosen for these panels was one corner of the pre-existing 2017 chassis molds. This was chosen to check an asymmetric laminate’s behavior in a fileted corner. These pieces were then checked against a control symmetric laminate cured in a single stage, shown in Figure 60. The maximum deformation in the single stage cure sample was 0.345”. The dual stage cure significantly reduced this deformation to 0.094”.
Figure 60. Symmetric Test sample being checked against a micro-flat reference table.
41
Figure 61. Images of single-stage cured sample pieces after destructive testing.
The samples manufactured using the multi-stage method were then compared to samples created using a traditional single stage cure, where the outer and inner skins were cured all at once along with the core and the core adhesive. The chosen method of testing for these samples was a standard compression test, where the geometry of the test created a loading scenario like a 3-point bend test, as pictured in Figure 61. By looking at the samples after they had failed under the compression test, the failure modes of each were found and compared to one another in Table 3.
Table 3: Stage-cured Samples and Failure Modes Under Compression
Sample Failure Mode
Single-stage sample 1 Core failure
Single-stage sample 2 Core failure, inner skin delamination
Dual-stage sample 1 Core failure, outer skin delamination
42
Figure 62. Comparison between single-stage and dual-stage load versus displacements.
From Figure 62, the single-stage cure pieces tended to have a larger failure load, with similar values for stiffness. However, the dual-stage samples were able to sustain loads at around 50% of their ultimate load for much longer after peak loading had been accomplished. The load carried by the single-stage samples tended to drop off significantly and dramatically after the peak loading was achieved. This follows the failure modes observed for each part, since the single-stage cure samples saw core shear failure issues far before the skins delaminated from the core, but the dual-stage samples experienced outer skin delamination first, and the core and inner skin laminate was still left intact enough to support a load after the initial failure. Though the structural benefits of multi-stage curing are evident, the MCD team decided that the added manufacturing time associated with additional cures threatened the project timeline. Instead, the MCD team decided to further investigate the use of a single-stage cured asymmetric laminate.
Finite Element Model
43
Figure 63. Test data from 2017 panel.
A line load was then applied to the center of the panel depending on the load requirement of the specific section. To validate the model within a certain tolerance, the model was compared to tested panel data from 2017, shown in Figure 63.
Figure 64. Resultant displacements after convergence study.
44
Modeling & Laminate Design
To evaluate all the geometry changes and ensure high specific stiffness and strength, several global and local models were made to predict the stresses within the monocoque. In addition, models to predict panel performance for SES compliance were also created. A summary of each model and its purpose is included in Table 4.
Table 4: Model Summary
Model Purpose Model Number
Full chassis, rigid suspension model (ANSYS)
Quantify torsional stiffness Select ply angles
Select roll hoop bracing orientation
(1)
3-point bend model (ANSYS)
Predict load capacity Predict displacement Predict energy absorption
(2)
3-point bend local failure modes (Excel)
Predict SES testing mode of failure (3)
3-point bend CLT (MATLAB)
Predict panel properties (4)
Local suspension: FLCA (ANSYS)
Characterize stresses at FLCA mounts (5)
Local suspension: Hardpoints (ANSYS)
Size hardpoint puck for stiffness, strength (6)
Full monocoque (ANSYS) Predict thermal stresses during cure cycle (7)
However, not all models were used due to material property inaccuracies for the T700 and HTS40 composite, namely (2), (3), and (5).
Structural Equivalency Spreadsheet
45
Front Bulkhead Support (FBHS) directional stiffness, peak 3 point bend force, maximum deflection, minimum EI
Front Bulkhead (FBH) Buckling modulus, ultimate tensile strength, minimum EI, maximum deflection
Main Hoop Brace Supports Buckling modulus, ultimate tensile strength, minimum EI, maximum deflection
Upper Harness Mounts Buckling modulus, ultimate tensile strength, minimum EI, maximum deflection, peak 3 point bend load, representative panel test (with harness attachment)
Lower Harness Mounts Buckling modulus, ultimate tensile strength, minimum EI, maximum deflection, peak 3 point bend load, representative panel test (with harness attachment
General Composite Strength, stiffness, directional stiffness
46
Figure 65. Steel tube baseline 3-point bend test setup.
47
Figure 66. Perimeter shear test setup.
As previously mentioned, each 3-point bend section must pass tailored requirements based on tube properties qualified via ASTM standard 3-point bend testing. Using the resulting test data and panel dimensions, the SES spreadsheet calculates the properties of the panel and determines if it meets the requirements necessary. In addition to the physical tests, every chassis section must also pass a directional stiffness and strength requirement, stating that the fibers in the 0 degree direction of a panel must have at least 50% fiber in the 90 degree direction, evaluated by areal weight.
3-point bend models were made because panel performance can be predicted. This helped minimize the amount of time and resources required to develop a suitable sandwich panel layup as the team did not need to rely on excessive physical testing.
3-Point Bend Models
Test panel manufacturing consumes significant resources and time. To reduce time spent making panels, several 3-point bend models were made to predict panel performance and tune laminates for SES efficiently. A MATLAB script was made using Classic Laminate Theory (CLT) to quantify panel performance. The inputs included material properties, layup schedule, and an applied line load. However, this script calculates overall panel deflection and strength. It does not model local contact stresses, so typical 3-point bend failure modes cannot be predicted with this model. Instead, this model was used to eliminate most panels via SES stiffness and strength criterion, narrowing down test panel manufacturing to less than 10 individual panels per section.
48
Figure 67. 3-point bend strain energy.
The load applicator was modeled as an infinitely stiff tube, and the load was applied to the applicator itself, resulting in a translated load from the applicator to the top facesheet. For the edge conditions, the panel was simply supported on both ends, as boundary conditions that included contacts was not needed at those areas. Most of the 3-point bend panels had local contact failures near the load applicator, usually due to the simultaneous core compression and transverse facesheet buckling, illustrated in Figure 68.
Figure 68. Typical sandwich panel failure modes.
49
facesheet dimpling, and facesheet wrinkling. This model was fully correlated to past test data, matching expected failure index criterion based on 2017 panel testing, which had known material properties. A snapshot of the most recent version of the spreadsheet used to predict local failure modes is included in Appendix D for reference. In the future, this script could be used as a quick method for predicting panel performance instead of a FEM, which requires significant effort to meet minimum accuracy for usable results. Additional failure mode criteria can be added to predict other modes of failure like core crushing, increasing versatility of the spreadsheet.
Local Suspension Model - Lower Control Arm Boss
With the new chassis geometry changes, stress concentrations can potentially be induced through small fillet radii and drastic angle changes needed to meet subsystem packaging. To meet the lower control arm suspension requirements, a boss was made, resulting in tight fillets and angle changes at the lower front bulkhead support corners. A local finite element model was created to quantify the laminate stresses in this section, as those are highly loaded areas due to suspension mounting, illustrated in Figure 69.
Figure 69. Chassis model and load paths.
50
chassis surface was modeled using shell elements, with the suspension mounts modeled using solid elements. The front and rear edges of the chassis were fixed in space, spaced far enough from the loaded area such that their effects do not interfere with the stress distribution in areas of interest. An Excel-based steady state contact patch load calculator was used to define peak acceleration load cases, including braking, acceleration, cornering (lateral acceleration), and combined loading (braking and cornering), shown in Table 6.
Table 6: Acceleration and Contact Patch Load Cases
Operating Case Acceleration
Contact Patch Load (lb)
Front Rear
Fx Fy Fz Fx Fy Fz
Braking -2.3 long -507 0 262 -118 0 58
Acceleration 1.7 long 163 0 79 471 0 241
Cornering 2.23 lat 0 474 276 0 487 285
Combined 1.8 lat, -1.0 long -574 514 299 -426 374 217
Link loads were calculated using a MATLAB solver based on these contact patch loads and applied to the respective suspension mounts. A summary of the resulting link loads for the combined braking and cornering case is shown in Table 7.
Table 7: Link Loads Applied to Chassis Suspension Mounts
Link
ForcesX ForcesY ForcesZ MAGforcesFore Lower A-arm -748.24 -1662.44 -163.65 1830.40 Aft Lower A-arm -430.19 893.03 188.00 1008.91 Fore Upper A-arm 512.06 668.90 89.34 847.13
Aft Upper A-arm 261.91 -385.40 -109.01 478.55 Tie Rod 23.16 254.47 27.58 257.01 Push/Pull Rod -3.71 -104.56 161.73 192.62
51
Figure 70. Normal shear stress, Z direction.
To analyze the panel using maximum strain criteria, strain magnitudes would need to be evaluated for each ply in the longitudinal and transverse directions, then compared to the material properties derived from in house tensile testing.
Local Suspension Model - Hardpoint Sizing
52
Figure 71. Hardpoint sizing model.
The panel components and inserts were constrained via bonded contacts, while the suspension mount was constrained via bushing joints to the inserts. To size these pucks, a representative suspension load was applied to the mount holes, as shown in Figure 71. A sweep through various puck diameters was performed to size the puck. However, this model did not utilize valid material properties, so no discrete conclusions could be made. Once the material properties are accurate, this model can be evaluated using maximum strain energy failure criterion to get safety factors for suspension loads. To further increase fidelity, representative volumes of the insert potting should be added to the model, as the structural adhesive plays a significant role in the subsequent load path from mount to global laminate. The ESA insert design handbook [10] can be referenced for statistical approaches to modeling adhesives. Additionally, stiffness can be evaluated via deflection distributions, as shown in Figure 72.
Figure 72. Local hardpoint FEM.
Torsional Stiffness Model
53
Figure 73. CPFSAE 2019 main hoop bracing configuration.
54
Table 8: Forward Bracing versus Rearward Bracing Weight Difference
Forward Swept Bracing [lbf] Rearward Swept Bracing [lbf] Percent Difference [%]
10.51 10.04 4.5%
Due to this minimal difference, weight was also removed as a factor for consideration. Forward swept bracings would lend to easier accessibility in the rear for engine, differential, and other powertrain components, as the main hoop bracings in the past have typically hindered any access from the top of the chassis.
Furthermore, a finite element model was created to evaluate the performance of the forward swept main hoop bracing. In this model, the monocoque, main hoop with bracings, and suspension geometry were modeled. The hoops and suspension links were modeled using beam elements, and the monocoque was modeled using shell elements. For simplicity and solver speed, composite materials were not applied to the chassis, as that was not the focus of this model. Instead, the chassis and suspension were modeled using structural steel.
Figure 74. Sample inboard boundary conditions. Vertices are constrained to the chassis using pinball regions (shown in blue).
55
Figure 75. Torsional stiffness full vehicle constraints to model ground.
In addition, the main hoop was fixed in all three degrees of translation and rotation relative to the monocoque. After doing a coarse mesh convergence study, the model results matched predictions, with the forward swept bracings improving torsional stiffness and load distribution along the length of the chassis. Shown below, the principal stresses are less evenly distributed throughout the monocoque geometry without a forward swept bracing.