Proceedings of the Workshop on the
Layout of (Software) Engineering Diagrams
(LED 2007)
Properties of Euler Diagrams
Gem Stapleton, Peter Rodgers, John Howse and John Taylor
15 pages
Guest Editors: Andrew Fish, Alexander Knapp, Harald St ¨orrle
Managing Editors: Tiziana Margaria, Julia Padberg, Gabriele Taentzer
Properties of Euler Diagrams
Gem Stapleton1, Peter Rodgers2, John Howse3and John Taylor4
1[email protected],3[email protected]
www.cmis.brighton.ac.uk/reseach/vmg
University of Brighton, UK
University of Kent, UK
Abstract: Euler diagrams have numerous application areas, with a large variety of languages based on them. In relation to software engineering, such areas encompass modelling and specification including from a formal perspective. In all of these ap-plication areas, it is desirable to provide tools to layout Euler diagrams, ideally in a nice way. Various notions of ‘niceness’ can be correlated with certain properties that an Euler diagram may or may not possess. Indeed, the relevant layout algorithms developed to date produce Euler diagrams that have certain sets of properties, some-times called well-formedness conditions. However, there is not a commonly agreed definition of an Euler diagram and the properties imposed on them are rarely stated precisely. In this paper, we provide a very general definition of an Euler diagram, which can be constrained in varying ways in order to match the variety of defi-nitions that exist in the literature. Indeed, the constraints imposed correspond to properties that the diagrams may possess. A contribution of this paper is to provide formal definitions of these properties and we discuss when these properties may be desirable. Our definition of an Euler diagram and the formalization of these prop-erties provides a general language for the Euler diagram community to utilize. A consequence of using a common language will be better integration of, and more accessible, research results.
Keywords:Information visualization, software specification, Venn diagrams
1
Introduction
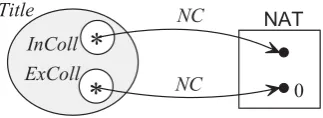
example the arrows are both labelledNC, for ‘number of copies’. The diagram thus asserts that all elements in the setExColl (ex-collection) have no associated copies; all other titles are ‘in-collection’ and are associated with some number of copies distinct from zero. The four closed curves in this diagram constitute and Euler diagram.
T i t l e N C N A T
E x C o l l N C
I n C o l l
*
*
Figure 1: A constraint diagram.
Constraint diagrams fulfil a similar role to that of the Object Constraint Language, the only non-visual part of the UML; see [HS05,KC99] for examples of software modelling using con-straint diagrams. A well studied fragment of the concon-straint diagram language, called spider diagrams [HST05], which are also based on Euler diagrams has been used in a variety of ap-plication areas; see, for example, [Cla05] where they are used in a safety critical environment. The relationship between spider diagrams, regular languages and finite state machines has also been investigated [DS07]. Euler based diagrams have numerous other application areas; for example [DES03,HES+05,KMGB05,Lov02,SA05,TVV05].
Thus, there are a whole range of languages based on closed curves that find applications in, or related to, software engineering. A collection of closed curves can be viewed as an Euler diagram but there are a host of differing views of what constitutes such a diagram which will be discussed later in the paper. In all of the application areas mentioned above, the automatic layout of diagrams has the potential to be important and in some cases could be considered essential. For example, when using constraint diagrams to specify operations it might be necessary to prove that the postcondition of one operation implies the precondition of another. In such situations the reasoning may be automated; see [SMF+07]. To display the results of that reasoning to the software engineer, the automatic generation of the diagrams in the proof is needed.
Titles
InColl
ExColl
Titles
InColl
ExColl
Titles
InColl
ExColl
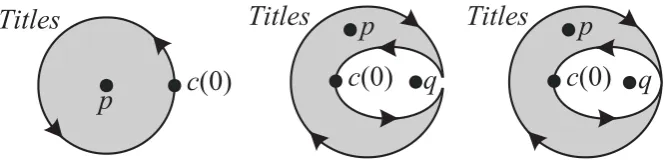
Figure 2: Three Euler diagrams.
Euler diagrams are used to make statements about sets. For example, given the setsTitles= {x,y,z},InColl={x,y}andExColl={z}, we can draw any one of the Euler diagrams in figure2
the ideal is that an Euler diagram can be found that represents the given collection of sets and has nice visual qualities, allowing the diagram to be interpreted by the user with ease; in figure2, the lefthand diagram would probably be considered to be the nicest of the three because one can easily differentiate the curves. To this end, most of the generation algorithms developed to date draw Euler diagrams that have certain properties, sometimes called well-formedness conditions. In general, the generation problem is to find an Euler diagram that possess some given properties and represents some specified collection of sets. So, the generation problem can be broken down into a collection of subproblems, one for each set of properties.
Various methods for generating Euler diagrams have been developed, each concentrating on a particular class of Euler diagrams; see, for example [CR05b,CR03,FH02,KMGB05,VV04]. Ideally, such generation algorithms will produce diagrams with desirable properties in an effi-cient way. The generation algorithms developed so far produce Euler diagrams that have certain sets of properties. However, within the generation community, there is not a commonly agreed definition of an Euler diagram and the properties imposed on them are rarely stated precisely. Such precision is vital if we are to fully explore how to generate Euler diagrams effectively and to answer various related questions such as whether an Euler diagram exists that represents a certain statement and possesses certain properties. In section2, we provide a general definition of an Euler diagram and formalize various concepts which are necessary for the remainder of the paper. Section3provides a formalization of a variety of properties that have been imposed on Euler diagrams, either in existing layout work or in related application areas. Finally, section4
concludes and discusses implications for layout that imposing these properties brings.
2
Euler Diagram Syntax
There are various definitions of Euler diagrams, most of which start with a set of closed curves and proceed to state that these curves have certain properties. For example, in [FH02] an Euler diagram is a finite set of simple, labelled, closed curves, no pair of which have the same label or meet tangentially, and no point inR2 is in the image of more than two curves (that is, there are no triple points). By contrast, [VV04] allows curves to have the same label. Exceptions to the curved based definitions include that in [LP97], where an Euler diagram is viewed as a set of connected regions in the plane. In this section, we give a very generic definition of an Euler diagram and build up the necessary language required to formulate certain properties that Euler diagrams may possess. To begin, we recollect the definition of a closed curve.
Definition 1 Acurveis a continuous function defined on an interval[x,y]⊂R. Letcbe a curve with domain[x,y]. Ifc(x) =c(y)thencisclosed[Bla83].
From this point, we assume that all curves are closed, have domain[0,1]and have codomain R2unless stated otherwise. We further assume that all curvesc: [x,y]→R2can be defined by
c(t) = (f(t),g(t))where f andg are continuous; this allows us to utilize various topological
concepts necessary for the formalization of the properties Euler diagrams may possess. In an Euler diagram, all curves have a label; we assume that their labels are drawn from a fixed setL.
1. Curveis a finite collection of closed curves each with codomainR2,
2. l:Curve→L is a function that returns the label of each curve.
In our figures, we sometimes draw a rectangle around Euler diagrams to delineate them; such rectangles are not formally part of the diagram. Given an Euler diagram, we need to be able to identify the interior of the curves, since these diagrams make statements about set inclusion and disjointness by representing these relations in an isomorphic way; for example, to express
InCollis a subset ofTitles, a curve labelledInCollis placedinterior to a curve labelledTitles; see figure2. Given a curve that does not self-intersect, one can easily identify the interior: by the Jordan Curve Theorem, such a curve splitsR2into two pieces, the bounded piece which forms the interior and the infinite face which is exterior. However, the case for non-simple closed curves is not so obvious; see [FS06] for a discussion on this issue. In the case of any simple closed curve,
c, we observe that any point, p∈R2, is insidecwheneverc ‘winds’ exactly once around that point. For example, in figure3, the leftmost curve is simple and the pointplies in its interior; here,c(0)denotes where we ‘start drawing the curve’ and the arrows indicate how we traverse the curve. For all three curves, the pointpis interior and the curve winds aroundpexactly once; the shaded regions represent the interiors of the curves. In the middle and righthand curves, the pointqis in the exterior; the middle curve does not wind aroundqat all whereas the righthand (non-simple) curve winds exactly twice around q. We use this insight to formally define the interior (and exterior) of general closed curves.
Titles
c(0)
p
Titles
c(0)
p
Titles
c(0)
p
q
q
Figure 3: Identifying the interior: winding numbers.
Definition 3 Letcbe a closed curve and letpbe a point inR2−im(c). The point pisinterior tocif the winding number ofcwith respect to p, denotedwind(c,p)is odd, with the set of all such points denotedint(c). All points inR2 that are not interior tocareexteriortoc, with the set of all such points denotedext(c).
For any simple closed curve the winding number around any point in the bounded face is one, thus the definition of interior just given agrees with the intuitive notion interior in such cases. Given an Euler diagram, there may be more than one curve with a given label, such as
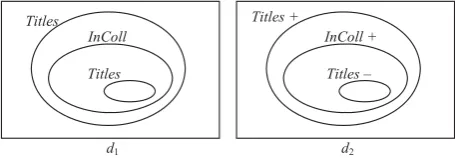
d1 in figure 4. In [VV04], an Euler diagram is permitted to have curves with common labels,
In [VV04], any curve, c1, with the same label as another curve,c2, is only placed inside c2 as
Titles
Titles InColl
d1
Titles +
Titles – InColl +
d2
Figure 4: Diagrams with common labels.
a result of their generation algorithm ifc2 is augmented with a plus andc1is augmented with
minus. As a consequence, the augmentation is redundant because the placement of the curves implicitly provides the sign; the diagram d1 in figure 4can be considered as having the same
meaningd2.
In [Joh05], an Euler diagram may also contain two curves with the same label. In general,
curves with the same label are referring to the same set. Just as with closed curves, we need to be able to identify the interior and exterior of curves with the same label. For example, d1 in
figure4contains two labels:Titles, which labels two curves, andInColl. The ‘interior’ ofTitles
is the set of points interior to the curve labelledTitleswhich contains the other two curves but not those points interior to the other curve labelledTitles. This notion is consistent with our definition of interior for curves, using winding numbers.
Definition 4 Let(Curve,l) be an Euler diagram and letCur(L)be the set of all curves in d
with the labelL. A point pisinteriortoCur(L)if the sum of the winding numbers of the curves inCur(L)with respect to pis odd; more formally, the sum ∑
c∈Cur(L)
wind(c,p)is odd. The set
of interior points is denotedint(Cur(L)). All points inR2 which are not interior toCur(L) are
exteriortoCur(L), the set of which is denotedext(Cur(L)).
For any singleton set of curves of the formCur(L), we immediately see that the points interior toCur(L) are the same as those interior to the single curve whichCur(L) contains. A set of curvesCur(L)represents a set and the spatial arrangement of the curves in a diagram provides information about the relationship between those sets. Thus it is useful to identify how the sets of curves of the formCur(L)partition the plane into pieces.
Definition 5 Letd= (Curve,l)be an Euler diagram and letCur⊆ {Cur(L):L∈im(l)}. If the set
z= \ Cur(L0)∈Cur
int(Cur(L0))∩ \
Cur(L0)∈{Cur(L0):L∈im(l)}−Cur
ext(Cur(L0))
is non-empty thenzis azoneofd, with the set of such zones denotedZ(d).
3
Formalizing Properties
Typically, generation techniques for Euler diagrams aim to produce a layout that possess certain properties deemed desirable, possibly related to the understandability of the resulting diagram or appropriate for the application area. For example, a diagram with a certain property may be more understandable than one without that property. For each of the properties below, we provide examples to motivate their usefulness and discuss where they have been used in the related literature.
3.1 Simplicity Property
Many definitions of Euler (based) diagrams stipulate that the curves must be simple [BR98,
CR05b, CR03, Ham95,HST05,SA04, VV04] but others do not [BH96, CC04, DC05,SK00,
Shi94, SA05]. Indeed, the layout work in [CR05b,FH02,VV04] assumes that all curves are
simple. To recall, a simple curve is one that does not self-intersect. In figure5, there are two diagrams with the same meaning and the lefthand side one contains a non-simple curve, labelled
Vinnie Jones.
Guy Richie UK Gangster
Movies
Vinnie Jones
A diagram with a non simple curve.
Guy Richie UK Gangster
Movies
Vinnie Jones
A diagram with a duplicated curve label.
Vinnie Jones
Figure 5: Simplicity of curves.
Definition 6 A curvecissimpleif for allx,y∈[0,1],c(x) =c(y)impliesx=yor|x−y|=1.
Definition 7 An Euler diagram,d, possesses thesimplicity propertyif and only if all of the curves indare simple.
Euler diagrams that possess the simplicity property are highly desirable due to the potential difficulty users may meet when interpreting diagrams whose curves are not simple.
3.2 Unique Labelling Property
The definitions of an Euler diagram given in [BH96,BR98,CC04,CR05b,CR03,DC05,Ham95,
HST05,SK00,SA05,SA04] allow labels to occur at most once in any Euler diagram. Thus, the
Definition 8 An Euler diagram, (Curve,l), possesses the unique labelling property if the functionlis injective.
3.3 Connected Zones Property
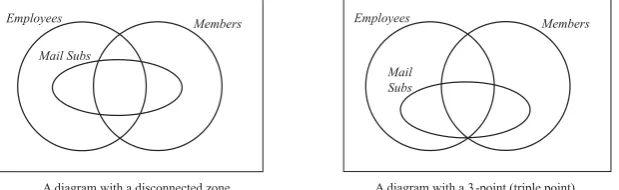
The lefthand diagram in figure 6 contains a zone (that inside both Employees andMembers) which consists of two parts. Such a zone is said to be disconnected. Frequently, zones are required to form connected components ofR2, as in [FH02,VV04, CR05b]. It can be hard to interpret Euler diagrams with disconnected zones under some circumstances, for example when items are placed in zones. Such a collection of items might be split up in two or moreminimal regions, thus not allowing an immediate interpretation about the number or distribution of items.
Employees Members
Mail Subs
A diagram with a disconnected zone.
Employees Members
Mail Subs
A diagram with a 3-point (triple point).
Figure 6: Disconnected zones and multiple points.
Definition 9 Letd= (Curve,l)be an Euler diagram. A non-empty set of points,m, inR2is a
minimal regionofdprovidedmis a connected component ofR2− S c∈Curve
im(c)with the set of such minimal regions denotedM(d).
Definition 10 An Euler diagram,d, possesses theconnected zones propertyif all of the zones ofdare also minimal regions ofd, that isZ(d) =M(d).
3.4 Zone Area Property
It is often desirable to visualize some value associated with the zones such as the cardinalities of the sets they represent. This motivates the need for generatingarea proportionalEuler diagrams, which are characterized by using a weight function to measure zone area. Thus we introduce a zone area property that Euler diagrams may possess. To satisfy this property, the zones in an Euler diagram must have the area specified by a weight function. As an example, figure7
shows an area proportional diagram providing information about the number of films in different categories. The weight function does not assign an area to the zone which is not inside any curves. In figure7the zone sizes are proportional to the weights within them.
Definition 11 Letdbe an Euler diagram and
w:Z(d)− { \
Cur(L0)∈{(Cur(L)):L∈im(l)}
Thrillers
Comedies
Romances
45
15 9 4
32 28
35
Figure 7: An area proportional diagram.
be a function. The diagramdpossesses thew-zone area propertyif and only if all of the zones,
zin the domain ofwhave areaw(z).
There are obvious variations of this property; for example, when drawing bounding rectangles around Euler diagrams, rather than embedding them in the whole of R2, one can stipulate the area of all of the zones.
The work on laying out area proportional Euler diagrams typically produces diagrams that have connected zones [CR03,CR05b,KMGB05]. Furthermore, some approaches to layout at-tempt to find area proportional diagrams with unique labelling and the property that each curve is a circle [CR05a, KMGB05]. Exact area proportional layouts under these conditions is not always possible. The desirability of utilizing circles and getting an approximate result has also led to the notion of relative size, so that more diagrams can be drawn where the size of one zone is specified to be bigger than another [CR05a].
3.5 Connected Diagram Property
A diagram is said to beconnectedif the (images of) the curves form a connected set, such as that in figure7. Any collection of sets can be represented by a connected diagram: intuitively, any dis-connected diagram can be made dis-connected by creatingbrushingpoints (defined later); [Cho07] uses this result in the generation process. For example, figure8shows a disconnected diagram (left) which is ‘made connected’ by moving the curve labelledGames upwards, shown in the middle diagram. All of the diagrams in this figure contain concurrent curves, but they have been slightly pulled apart for visual clarity.
Definition 12 An Euler diagram, d= (C,l), possesses theconnected diagram property if S
c∈C
im(c)is connected.
Films
DVDs Tapes
Games
A disconnected diagram.
Films
DVDs Tapes
Games
A diagram with two curves brushing.
Films
DVDs Tapes
Games
A diagram with partial concurrency.
Figure 8: Three diagrams with concurrent curves.
3.6 Multiple Point Properties
Given an Euler diagram that possesses the simplicity property, a point pinR2 is called an n -point if the number of curves that pass through pis exactly n. In the non-simple case, curves can pass through a point more than once and in such cases the number of times each curve passes through pcontributes to the value ofn. For example, the righthand diagram in figure6
contains a 3-point, also called a triple point. With non-simple curves, a triple point can be formed from a single curve. A diagram in which all points are at most 2-points can make a diagram easier to understand, but reduces the number of diagrams that can be drawn without introducing other undesirable properties, such as concurrency and non-simple curves. The layout method in [FH02] draws diagrams that have a most 2-points.
Definition 13 Letd= (Curve,l)be an Euler diagram and letpbe a point inR2. We say thatp is ann-pointindif ∑
c∈Curve
{x∈[0,1):c(x) =p}
=n.
Definition 14 An Euler diagram,d= (Curve,l), possesses then-point propertyprovided each point inR2is at most ann-point ind.
3.7 Curve Crossing Property
In an Euler diagram,d, two curves indmay cross at a pointp. Furthermore, the two curves might intersect atpbut not cross, in which case theybrushatp. It may well be the case that two curves brush and cross at a point. For example, all intersection points of the curves in the diagram in figure7 are crossing points whereas the middle diagram in figure8contains a brushing point, whereGamesandFilmsintersect. It is possible for a point to be both a crossing and a brushing point. We now proceed with a series of definitions that allow us to identify whether two curves cross at a point and whether they brush at a point. Some generation algorithms produce diagrams that only permit curves to intersect only at crossing point that are not brushing points [FH02].
regions, one for each of the four combinations of being ‘inside’ or ‘outside’c1andc2. However,
hadc1, say, been non-simple it need not have had an interior. Thus, we cannot use the notion of interior to define a crossing point. Givenc1,N(p)is cut into two pieces and we can arbitrarily
assign positive and negative to each of these two pieces respectively. The curves in the middle diagram brush atp. Here, the positive and negative regions do not correspond to each of the four combinations of being positive or negative to the two curves.
c1 c2
A diagram with a crossing point.
Pos(c1)
Pos(c2)
Neg(c1)
Pos(c2)
Neg(c1)
Neg(c2)
Pos(c1)
Neg(c2)
N(p) p
c1 c2
A diagram with a brushing point.
Neg(c1)
Neg(c2)
Neg(c1)
Pos(c2)
Neg(c1)
Neg(c2)
Pos(c1)
Neg(c2)
N(p) p
A B
A diagram with brushing and crossing concurrency.
C
Figure 9: Crossing and brushing curves.
Definition 15 Letc:[x,y]→R2, where the notation[x,y]denotes any closed interval of
R2. Letpbe a point inim(c)and letN(p)be a disc neighbourhood ofp. IfN(p)−im(c)consists of exactly two connected components thenN(p)is called asplitting neighbourhoodofpforc.
Definition 16 Letc1:[x,y]→R2andc2:[a,b]→R2be two curves such that there is a unique pointpinim(c1)∩im(c2). If there exists a disc neighbourhoodN(p)such that
1. N(p) is a splitting neighbourhood of p forc1; arbitrarily call one of the two connected
componentsPos(c1)and the otherNeg(c1),
2. N(p) is a splitting neighbourhood of p forc2; arbitrarily call one of the two connected
componentsPos(c2)and the otherNeg(c2),
3. N(p)contains a point inPos(c1)∩Pos(c2),
4. N(p)contains a point inPos(c1)∩Neg(c2),
5. N(p)contains a point inNeg(c1)∩Pos(c2)and
6. N(p)contains a point inNeg(c1)∩Neg(c2)
thenc1andc2are said tocrossatp. Otherwisec1andc2brushatp.
Letc1:[0,1]→R2 andc
2: [0,1]→R2 be two closed curves such that there is a point p in
im(c1)∩im(c2). If there exist closed intervalsI1,I2⊆[0,1]such that
thenc1andc2crossatp. If there existsI1,I2⊆[0,1]such that
1. im(c1|I1)∩im(c2|I2)contains exactlyp, 2. the curvesc1|andc2|brush at p
thenc1andc2brushatp.
Definition 17 An Euler diagram,d, possesses thecrossing propertyif and only if whenever two curves,C1andC2, indintersect they cross but do not brush.
The concepts of crossing and brushing can be generalized to curve segments as well as being defined for points; see the discrete property below.
3.8 Discrete Property
The embedding methods of [VV04,CR05b] sometimes produce diagrams with concurrent line segments. If concurrency is permitted, along with either non-simple curves or multiple curves with the same label, then any collection of sets can be represented by an Euler diagram. More-over, many collections of sets can only be represented by Euler diagrams with concurrent line segments when certain properties are imposed. However, concurrent line segments can make it difficult to interpret a diagram; the generation algorithm in [FH02] only produces diagrams without concurrency; thus the curves in these diagrams intersect only at a discrete set of points.
Definition 18 A set of points,X ⊆R2, isdiscreteif for every point x∈X there exists
ε >0 such that
{p∈R2:d(p,x)≤ε} ∩X={x} whered(p,x)is the standard Euclidean distance between pandx.
Definition 19 An Euler diagram,d= (Curve,l), possesses thediscrete propertyif all pairs of curves inCurvedo not run concurrently:
{x∈R2:∃a,b∈[0,1]a6=b∧c1(a) =c2(b) =x}
is a discrete set of points.
So, any diagram that possesses the discrete property does not have concurrent curves. With non-simple curves, self concurrency is possible, so that the curve is concurrent with itself.
There are a number of variations of concurrency. Its possible to have ‘crossing’ or ‘brush-ing’ concurrency depending on whether the curves cross at the start and end of the concurrency segment. For example, the righthand diagram in figure9 A andB brush concurrently (where the concurrent line segments have been drawn slightly pulled apart for clarity) andAcrossesC
concurrently, as doesB.
For full concurrency the line segments of the two curves,c1 andc2, separate at a point which
is a crossing point or a brushing point for some pair of curves or a point where another curve separates from a concurrent line segment; any other concurrency is partial. It is thought that partial concurrency can always be removed from a diagram.
3.9 Curve Shape Properties
Curves may have the property of having a particular geometric shape, such as circle, oval, trian-gle, square or being n-gons; the work in [CR05a,KMGB05] generates Euler diagrams consisting only of circles and that in [CFW05] is concerned withk-gons with a particular focus on triangles. A weaker constraint may be to require that all curves are the same shape, even if it is not regular. Further, a curve may be smooth, in the sense that its function is differentiable. Sometimes there is a requirement that all curves are convex, so concave curves are not permitted, see, for exam-ple, [LP97]. In practice, most implemented diagram visualization methods restrict the shape of the curves to some extent, due to the restrictions on line visualization in software environments; for example, [CR05a,FH02,VV04] generates diagrams whose curves are polygons.
Definition 20 An Euler diagram,d= (Curve,l), possesses thesmooth propertyif all of the curves inCurveare smooth.
A curve,c, isconvexif it is simple and its interior is convex; that is, for each pair of points in the interior ofcthere is a straight line between those points that lies in the interior ofc.
Definition 21 An Euler diagram, d= (Curve,l), possesses the convex propertyif all of the curves inCurveare convex.
Definition 22 Let S be a set of shapes. An Euler diagram, d= (Curve,l), possesses the S-shapes propertyif all of the curves inCurveare one of the shapes inS.
4
Conclusion
In this paper, we have provided a very general definition of an Euler diagram and provided a formalization of many properties that such diagrams are frequently required to possess. This definition and formalization provides a common language for the Euler diagram community to utilize. A consequence of using this common language will be more accessible and better integrated research results. Given the wide variety of languages based on closed curves that are utilized in software engineering, the framework described here has the potential to bring many important benefits.
monotonic diagram relies on the notion of thedualof the Euler diagram, rather than the direct definition of a diagram. It is also possible to add zones to diagrams in order to ensure a dia-gram has certain properties. Here, the added zones might be shaded, as with the original work of Venn [Ven80] and the embedding process of [KMGB05] which does not guarantee that the initially specified zones are present. In this case a desirable property of a diagram might be that it has the smallest number of extra zones so as to possess certain other properties. One area of study in the Venn community is the notion of drawing a diagram in a symmetric manner. Although certain collections of sets can be represented by symmetric Euler diagrams, in the general case symmetry is not possible. It is also unclear how much an aid to user interpretation of a diagram is helped by symmetry. The context in which an Euler diagram is to be used is likely to influence those properties deemed desirable.
The generation work to date produces diagrams that have specified selections of properties we have formalized. Many difficult open problems remain to be solved. Given a collection of sets, it is unknown which properties can be possessed by Euler diagrams which represent those collections. For instance, classifying exactly which collections of sets can be represented by diagrams which possess the simplicity and unique labelling properties remains unanswered. We might also choose which properties a generated Euler diagram has, given a collection of sets that we wish to visualize. An algorithm that incorporates such user choice where possible has not yet been developed. Some collections of sets can be represented by an Euler diagram that possess exactly one of the discrete property and the 2-point property; under such circumstances these two properties areexchangeable. Further study into which properties can be exchanged needs to be performed.
Acknowledgements: This work is support by ESPRC grants EP/E011160/1 and EP/E010393/1 for the Visualization with Euler Diagrams project. Additionally, Gem Stapleton is supported by a Leverhulme Trust Early Career Fellowship. Thanks to Andrew Fish for discussing various aspects of this paper.
Bibliography
[BH96] J. Barwise, E. Hammer. Diagrams and the Concept of Logical System. In Allwein and Barwise (eds.). Oxford University Press, 1996.
[Bla83] D. Blackett.Elementary Topology. Academic Press, 1983.
[BR98] B. Bultena, F. Ruskey. Venn Diagrams with Few Vertices. Electronic Journal of Combinatorics5:1–21, 1998.
[CC04] L. Choudhury, M. K. Chakraborty. On Extending Venn Diagrams by Augmenting Names of Individuals.Proceedings of 3rd International Conference on the Theory and Application of Diagrams, Springer, pages 142–146, March 2004.
[Cho07] S. Chow. Generating and Drawing Area-Proportional Euler and Venn Diagrams. PhD thesis, University of Victoria, 2007.
[Cla05] R. Clark. Failure Mode Modular De-Composition Using Spider Diagrams. Proceed-ings of Euler Diagrams 2004Elsevier, ENTCS vol. 134, pages 19–31, 2005.
[CR03] S. Chow, F. Ruskey. Drawing Area-Proportional Venn and Euler Diagrams. Pro-ceedings of Graph Drawing 2003, Perugia, Italy, Springer, 466–477, September 2003.
[CR05a] S. Chow, P. Rodgers. Constructing Area-Proportional Venn and Euler Diagrams with Three Circles.Proceedings of Euler Diagrams 2005, 2005.
[CR05b] S. Chow, F. Ruskey. Towards a General Solution to Drawing Area-Proportional Euler Diagrams.Proceedings of Euler Diagrams, Elsevier, ENTCS vol 134, pages 3–18, 2005.
[DC05] H. Dunn-Davies, R. Cunningham. Propostional Statecharts for Agent Interaction Protocols. Proceedings of Euler Diagrams 2004, Brighton, UK Elsevier, ENTCS vol 134, pages 55–75, 2005.
[DES03] R. DeChiara, U. Erra, V. Scarano. A System for Virtual Directories Using Euler Di-agrams. Proceedings of Information Visualisation, IEEE Computer Society, pages 120-126, 2003.
[DS07] A. Delaney, G. Stapleton. On the Descriptional Complexity of a Diagrammatic No-tation. Accepted for Visual Languages and Computing, Knowledge Systems Insti-tute, 2007.
[FH02] J. Flower, J. Howse. Generating Euler Diagrams.Proceedings of 2nd International Conference on the Theory and Application of Diagrams, Springer, pages 61–75, April 2002.
[FHT04] J. Flower, J. Howse, J. Taylor. Nesting in Euler diagrams: syntax, semantics and construction.Software and Systems Modelling3:55–67, March 2004.
[FS06] A. Fish, G. Stapleton. Formal Issues in Languages Based on Closed Curves. Pro-ceedings of Distributed Multimedia Systems, International Workshop on Visual Lan-guages and Computings, Knowledge Systems Institute, pages 161–167, 2006.
[Ham95] E. Hammer.Logic and Visual Information. CSLI Publications, 1995.
[HES+05] P. Hayes, T. Eskridge, R. Saavedra, T. Reichherzer, M. Mehrotra, D. Bobrovnikoff. Collaborative Knowledge Capture in Ontologies. Proceedings of the 3rd Interna-tional Conference on Knowledge Capture, pp. 99–106, 2005.
[HST05] J. Howse, G. Stapleton, J. Taylor. Spider Diagrams. LMS Journal of Computation and Mathematics8:145–194, 2005.
[Joh05] C. John. Projected Contours in Euler Diagrams. Euler Diagrams 2004 Elsevier, ENTCS vol 134, pages 103–126, 2005.
[KC99] S.-K. Kim, D. Carrington. Visualization of Formal Specifications.6th Asia Pacific Software Engineering Conference, IEEE Computer Society Press, pages 102–109, 1999.
[Ken97] S. Kent. Constraint Diagrams: Visualizing Invariants in Object Oriented Modelling.
Proceedings of OOPSLA97, pages 327–341, October 1997.
[KMGB05] H. Kestler, A. Muller, T. Gress, M. Buchholz. Generalized Venn Diagrams: A New Method for Visualizing Complex Genetic Set Relations.Journal of Bioinformatics
21(8):1592–1595, 2005.
[Lov02] J. Lovdahl.Towards a Visual Editing Environment for the Languages of the Seman-tic Web. PhD thesis, Linkoping University, 2002.
[LP97] O. Lemon, I. Pratt. Spatial Logic and the Complexity of Diagrammatic Reasoning.
Machine GRAPHICS and VISION6(1):89–108, 1997.
[SA04] N. Swoboda, G. Allwein. Using DAG Transformations to Verify Euler/Venn Ho-mogeneous and Euler/Venn FOL Heterogeneous Rules of Inference. Journal on Software and System Modeling3(2):136–149, 2004.
[SA05] N. Swoboda, G. Allwein. Heterogeneous Reasoning with Euler/Venn Diagrams Containing Named Constants and FOL.Proceedings of Euler Diagrams 2004 Else-vier, ENTCS vol 134, 2005.
[Shi94] S.-J. Shin.The Logical Status of Diagrams. Cambridge University Press, 1994. [SK00] H. Sawamura, K. Kiyozuka. JVenn: A Visual Reasoning System with Diagrams
and Sentences.Proceedings of 1st International Conference on the Theory and Ap-plication of DiagramsSpringer, pages 271–285, 2000.
[SMF+07] G. Stapleton, J. Masthoff, J. Flower, A. Fish, J. Southern. Automated Theorem Proving in Euler Diagrams Systems.Journal of Automated Reasoning, June 2007. [TVV05] J. Thi´evre, M. Viaud, A. Verroust-Blondet. Using Euler Diagrams in Traditional
Library Environments.Euler Diagrams 2004Elsevier, ENTCS vol 134, pages 189– 202, 2005.
[Ven80] J. Venn. On the diagrammatic and mechanical representation of propositions and reasonings, Phil.Mag, 1880.