Australian Journal of Basic and Applied Sciences
2019 February;13(2): pages 1-11 DOI: 10.22587/ajbas.2019.13.2.1 Original paper AENSI Publications Journal home page: www.ajbasweb.com
Australian Journal of Basic and Applied Sciences ISSN: 1991-8178, EISSN: 2309-8414
Carbon Sequestration Potential of Traditionally Managed Forest:
Contributions to Climate Change Mitigation, Ethiopia
Samuel Tizazu Agidew1, Alemayehu Hailemicael Mezgebe2
1
MSC, Adama Science and Technology University,Adama, Ethiopia
2PH. D Arba Minch University College of Natural SciencesBiology Department, Ethiopia
Correspondence Author: Alemayehu Hailemicael Mezgebe, PH. D, Arba Minch University, Arba Minch, Ethiopia
Received date: 10 January 2019, Accepted date: 25 February2018, Online date: 28 February 2019
Copyright: © 2019Alemayehu Hailemicaael Mezgebe et al, This is an open-access article distributed under the terms of the Creative Commons Attribution License, which permits unrestricted use, distribution, and reproduction in any medium, provided the original author and source are credited.
Keywords: Carbon Stock, Climate Change Mitigation, Indigenous Knowledge, Shawo Forest.
INTRODUCTION
The response of forests to alarmingly increasing atmospheric carbon dioxide concentrations is crucial for climate change mitigation. Forest ecosystems contain from 62% to 78% of the total terrestrial carbon (Ullah and Al-Amin, 2012). Forests, as a
source and sink of carbon, form an important component in efforts to combat global climate change impacts (Calfapietra et al.,
2015). The world forest stores 289 Gt of carbon in their biomass alone (FAO, 2010). Tropical forests comprise the largest (44%) proportion of the world forest (FAO, 2010). The world tropical forests release approximately 425 million tons of carbon annually
(Pan et al., 2011). The tropical forests are subjected to severe degradation due to overpopulation, shifting cultivation and
expansion of agriculture (Chakravarty et al., 2012). Deforestation and degradation of tropical forests constitute the second largest
source of anthropogenic emissions of carbon dioxide after fossil fuel combustion (van der Werf et al., 2009).
The forest resources of Ethiopia store 2.76 billion tons of carbon (about 10 billion tons of CO2 equivalents) in the Above
Ground Biomass (AGB) (Moges et al., 2010). However, the forest resources in Ethiopia have experienced so much pressure due
to the increasing need for wood products and conversion to agriculture.
If the deforestation continues at the present rate of about 2%, the existing 2.76 billion tons of stored carbon will be
released to the atmosphere in 50 years (Ayalew et al., 2006).
Indigenous conservation practices of forest resources in Southern Ethiopia are traditionally well developed. Forest patches of diverse fauna and flora with several benefits as traditional medicinal, the source of food and ritual activities are some among many. Therefore, assessing and exploring indigenous knowledge of forest conservation practices is important to maintain and enhance the benefits of ecosystem service and to promote sustainable management of the forest ecosystem (UNDP, 2014). The
south-western part of Ethiopia accounts for 18% of the country’s forest cover (Menker and Rashid, 2012). Shawo forest is one of
the traditionally managed sacred forests. Assessment of carbon stocks and stock changes in forests are relevant to the world
climate change impacts to deal with the UNFCCC and Kyoto Protocol report (Green et al., 2007).
Abstract
Natural forests can sequester huge amount of carbon thereby contributing towards climate change mitigation efforts. The purpose of the study was to estimate the carbon sequestration potentials of traditionally managed Shawo sacred forest so that its role in climate change mitigation could be recognized and valorized. Both primary and secondary sources were used to achieve the objectives. The analysis of this study was carried out using both qualitative and quantitative techniques. Descriptive research design was employed. Systematic sampling method was used to collect data of biomass along transect lines having systematically established plots of different carbon pools. Results revealed the presence of 16 plant species in Shawo forest. The average Diameter Breast Height (DBH) and Height (H) value of the plants was 9.21 cm and 10.43 m, respectively. The total mean carbon density was 514.52 t/ha (1888.31 CO2 equivalents). Of the total carbon pools, plants share was 385.39 t/ha (1414.39 CO2 equivalents).
Litter, herbs and grasses (LHGs) account 1.69 t/ha (6.21 CO2 equivalents). The soil organic carbon (SOC) up to 30 cm
depth was 127.44 t/ha (467.60 CO2 equivalents). The overall forest area of the study site has sequestered an
estimated amount of 66,887.6 tons of carbon (245,254.53 CO2 equivalents). In conclusion, the community
No research has been conducted on Shawo forest. The forest has never been studied, recognized and valorized so far. This study bridges the data gap so that it can contribute to sustainable forest resource management.
Objectives:
The main objective of the study was to estimate the carbon sequestration potentials of traditionally managed Shawo sacred
forest so that its role in climate change mitigation could be recognized and valorized.
Specific Objectives: Specifically, the study was designed to:
Estimate how much carbon was sequestered in different pools of the forest.
Analyze the vegetation structure and diversity of Shawo forest
2. MATERIALS AND METHODS
2.1.Description of the Study Area
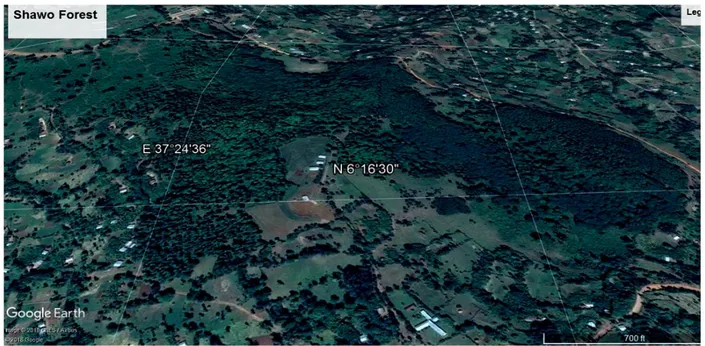
Location: The study was conducted in Shawo forest, located in Dita Woreda, Southern Nation Nationalities and Peoples Regional
State (SNNPRS). It is found between 37o 24’ 43” East to 6o 16’ 30” North. The altitude of the area ranges from 2185 m to 2278 m
asl.
Figure 1: Location of study area: Shawo Forest
Soil and landscape: The soils are primarily clay or clay loams which have been evolving from volcanic rocks (basalt) and volcanic tuff in the higher altitudes of the study area. The dominant soil color is reddish brown to dark brown (FAO, 1990). The principal soil types are cambisols and nitosols. These soils are very shallow and agriculturally unproductive.
Climate: Based on fifteen years (1999-2014) climate data obtained from Hawassa Statistical Agency, the study area experiences a
bimodal rainfall pattern. It has an average annual temperature of 16.7oC with a mean minimum daily temperature of the coldest
month and the mean maximum temperature of 8.0°C and 21.0°C respectively. The annual average rainfall of the study area is 1246 mm.
Vegetation: Shawo forest covers an area of 130 ha. It is a natural evergreen forest dominated by Syzygium guineense plant.
Population: According to the district administration data, the study area has a total population of 4199, of which 1973 are men and 2226 women. The majority of the inhabitants practiced Christianity, with 96.87% and 2.43% practiced traditional beliefs. More than 90% of the peoples spoke Gamo as a first language.
2.2.Data Collection and analysis
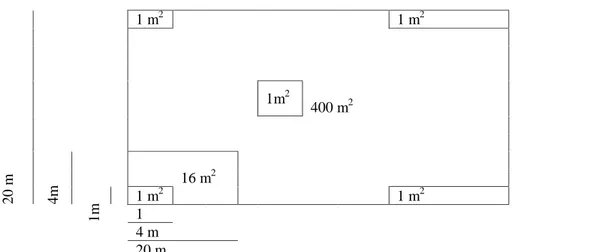
Site selection and sampling design: A systematic sampling method was used to take vegetation samples. Sample plots were laid along transect lines on the study area following reconnaissance. Fourteen parallel transect lines were laid to East direction with an interval of 150 m between the transect lines. The main sampling plots were laid on transect lines with 200 m interval each using the GPS navigation system and compass. The sample plots were laid 100 m away from the border to avoid edge effect. The first transect line and the first plot on each transect line were laid randomly. A total of 42 field plots were established on the
transect line within the Shawo forest. The main quadrant has a square shape and a dimension of 20 m × 20 m. Within the main
plot, dimensions of 4 m × 4 m (16 m2) for sapling data collection, and 1m × 1 m (1 m2) were nested to sample litters, grasses, and
20
m
1 m2 1 m2
1m2
400 m2
4m
1m
16 m2
1 m2 1 m2
1 4 m 20 m
Figure 2: Quadrat design for filed data collection: (a) 20m X 20m main quadrat for Plants DBH> 5 cm, (b) 4m X 4m Plot for saplings (c) 1m X 1m for Soil, Liter Grass and Herbs nested five plots four plots in corner and one plot in middle of the main
plots.
Field carbon stock measurement
Above ground biomass: All the plants in the main plots with a diameter at breast height (DBH) equal to or greater than 5 cm; and a height (H) greater than 1.3 m above the surface level was measured by using diameter tape and Suunto Clinometers, respectively (Lu, 2006). Plant DBH measurements were taken according to UNFCCC (2015) field manual recommendations. Plant specimen was collected, pressed and dried for further identification and checkup in Addis Ababa University. Sapling layer with a DBH less
than 5 cm and H greater than 1.3 m were measured by Vernier Caliper in all nested quadrats (4 m2) of the main plots.
Dead Leaf Litter, Herbs and Grass Sample Collection: The undergrowth layer, including seedlings, climbers, grasses, litter (twigs and leaves), were collected from five 1m × 1 m nested quadrats, at each corner and at the center of the main plot (Pearson
et al., 2005). The collected fresh weight of the litters, grasses, and herbs was recorded at the field. The collected sample from the five nested sub plots was evenly mixed and from that 100 grams was brought to the laboratory for analysis. Dead wood was not measured due to the nonexistence in sample plots.
Soil Sample Collection: Soil samples were collected from five points of the nested plot. Samples for bulk density and soil organic
carbon content analyses were taken from the main plot (from 0-10, 10-20 and 20-30 cm soil depth) (Powers et al., 2011). Core
sampler of height 10 cm and diameter 9.7 cm were used to sample for soil bulk density. The volume of the soil sample for each soil layer was determined from the height and radius of core sampler. A composite soil sample from the three-soil layer (0-10, 10-20 and 10-20-30) cm soil depth were taken to analyses soil organic carbon using soil Auger. All samples were placed in paper bags with the appropriate label.
Carbon Stock Biomass Estimation for Different Carbon Pools
Above ground biomass estimation: DBH and H values were recorded for all Plants (DBH value ≥ 5 cm) and saplings (DBH value < 5 cm) and H >1.3 m. The AGB was estimated using the regression equation developed for tropical forest and it has been used
successfully in tropical forests, which has similar vegetation characteristics to Shawo forest. The estimation of sapling AGB was
obtained from the regression equation (FAO, 2010). These equations are developed by considering tropical climatic zones (Chave
et al., 2014). Additionally, Xu et al. (2015) compared this model with other biomass estimation models and has observed better accuracy than other models.
AGB = 0.0673 x (pDBH2H) 0.976 ... (1)
Where, 5 cm < DBH and p= species wood density
The Saplings biomass (Bs) was estimated by allometric equation (2) shown below, which is DBH and H based having annual rainfall greater than 900mm (Visaratana and Chernkhuntod, 2004).
Bs = 0.0093 *DBH2 * H0.9403 ………... (2)
The undergrowth biomass (vegetation with H value < 1.30 m), including seedlings, climbers, grasses, and others, were estimated directly using the harvesting method. The fresh weight was measured, and the dry weight was determined by oven-drying at 70 °C for 48 hours in the lab before weighting. The total dry weight of the biomass was calculated from the fresh weight
using the equation below (Senpaseuth et al., 2009).
Where: DW = the dry weight and FW = the fresh weight.
The AGB was converted to carbon stock by multiplying 0.47 as a conversion factor (IPCC, 2007) using the equation below:
Above-ground carbon stock (AGCs) = 0.47 x AGB………...… (4)
Below Ground Biomass Estimation: it was made through a root-to-shoot ratio. For tropical rain forest, BGB is estimated about 20% of the ABG estimates (MacDicken, 1997).
Estimating of Litter, Herbs and Grass Biomass: The litter layer includes dead leaves, twigs, dead grasses, and small branches,
fragments of organic material and dead wood with a diameter of less than 10 cm (Girma et al., 2014). Biomass carbon stock was
estimated from sub-samples taken in the field. The total wet mass to oven dry mass was determined according to (Pearson et al.,
2005). The amount of biomass per unit area was calculated according to equation 5. LHGs Percentage of carbon was determined
bythe loss on ignition (LOI) method (Allen et al., 1986). The carbon density of LHGs was then calculated by multiplying biomass
of LHGs per unit area with the percentage of carbon determined for each sample.
LHGsB = x
x ……… (5)
Where:
LHGsB = Litter, herb and gasses (biomass of litter t ha-1);
W field = weight of wet field sample of litter sampled within an area of size 1 m2 in gm;
A = size of the area in which litter were collected (ha);
W sub-sample (dry) = weight of the oven-dry sub-sample of litter taken to the laboratory to determine moisture content (g), and
W sub-sample (fresh) = weight of the fresh sub-sample of litter taken to the laboratory to determine moisture content (g).
CLHGs = LHGsB × % C ………... (6)
Where, CLHGs is total carbon stocks in the dead litter, herbs, and grasses in the-1
% C is the carbon fraction determined in the laboratory
Soil Carbon: The collected soil samples were oven-dried at 105 0C for 24 hours to remove the soil moisture so as to determine
the organic matter and the bulk density (Gedefaw, 2015). To calculate Bulk density and soil carbon, the dried soil was washed and
2 mm sieve then the retaining builder dried again at 105 0C for 24 hours and subtracted from the dried weight of the soil. Then the
dried soil weight was obtained, and bulk density was calculated using Equation (5) (Grossman et al., 2002). Also, the amount of
soil carbon content (%C) of the sub-sample was measured in the laboratory using the Walkley-Black method. The soil carbon content was calculated by multiplying the volume percentage of the soil organic carbon in each soil horizon by the soil bulk
density value (g cm-3) and then multiplying the result by the soil depth (Black, 1965). Finally, the soil carbon content (the-1) was
calculated using Equation (5).
Soil carbon (t/ha) = Soil depth (cm) * soil bulk density (g/cm3) X %C ……… (6)
Total Carbon Stock
The total carbon density of the study area was determined by measuring and calculating carbon stock of all carbon pools in the Shawo forest and summing it up together.
Total Carbon Stock =AGB+LHGsB + BGB +SOC …... (7)
Data Analysis
Vegetation data analysis: The collected data was organized and recorded on the excel data sheet and analyzed using Statistical
Package for Social Science (SPSS) software version 20. The height and diameter data were arranged in classes for applying the appropriate model of biomass estimation equation. Analysis of variance (one-way ANOVA) was used to determine statistically significant differences (at 0.05 level) of carbon stocks along different DBH, height and soil depth. The analyzed data were presented using descriptive statistics using charts, percentages, Tables, and Figures.
Soil pH: Soil pH was determined in a 1:2.5 soil to water suspension following the procedure outlined in Sahelemedhin and Taye
3. RESULTS
3.1.Analysis of Structure and diversity of Shawo Forest
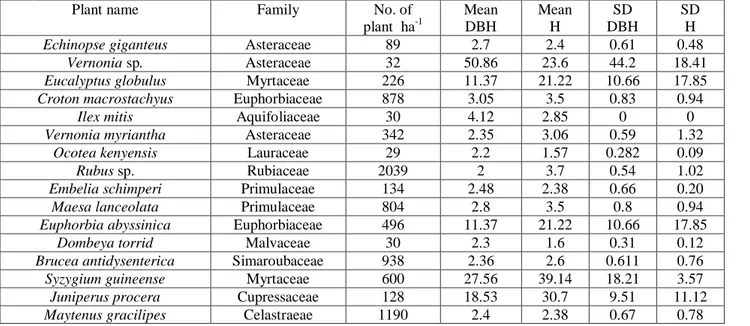
In the current study, an average plant density of 499 indv. ha-1 was recorded (Table 1). The average DBH and H value for
Shawo forest plants was 9.21 cm and 10.43 m respectively (Table 1). Out of the sixteen plant species, Vernonia sp. has an average DBH (50.86 cm) and H (23.62 m) (Table 1). The plant has stored the largest amount of average carbon density per individual
(27.03 t indv. -1) (Table 2).
Table 1: Species distribution of Shawo forest plants: Distribution and vegetation structure explained in terms of DBH Mean
Height
Plant name Family No. of
plant ha-1
Mean DBH
Mean H
SD DBH
SD H
Echinopse giganteus Asteraceae 89 2.7 2.4 0.61 0.48
Vernonia sp. Asteraceae 32 50.86 23.6 44.2 18.41
Eucalyptus globulus Myrtaceae 226 11.37 21.22 10.66 17.85
Croton macrostachyus Euphorbiaceae 878 3.05 3.5 0.83 0.94
Ilex mitis Aquifoliaceae 30 4.12 2.85 0 0
Vernonia myriantha Asteraceae 342 2.35 3.06 0.59 1.32
Ocotea kenyensis Lauraceae 29 2.2 1.57 0.282 0.09
Rubus sp. Rubiaceae 2039 2 3.7 0.54 1.02
Embelia schimperi Primulaceae 134 2.48 2.38 0.66 0.20
Maesa lanceolata Primulaceae 804 2.8 3.5 0.8 0.94
Euphorbia abyssinica Euphorbiaceae 496 11.37 21.22 10.66 17.85
Dombeya torrid Malvaceae 30 2.3 1.6 0.31 0.12
Brucea antidysenterica Simaroubaceae 938 2.36 2.6 0.611 0.76
Syzygium guineense Myrtaceae 600 27.56 39.14 18.21 3.57
Juniperus procera Cupressaceae 128 18.53 30.7 9.51 11.12
Maytenus gracilipes Celastraeae 1190 2.4 2.38 0.67 0.78
3.2.Carbon Stock Potentials of Individual Plant Species
From the study, Syzygium guineense has stored the largest amount of mean carbon density per hectare (357.65 tha-1) with
storing capacity of 13.49 tindv.-1) (Table 2). The plant was found to be the reservoir of 93.61% carbon density from the total
carbon stock of Shawo forest. Syzygium guineense has the highest total AGB and BGB carbon with 298.04 and 59.61 t ha-1
respectively.
Table 2: Above and below ground biomass and carbon stock of plant speciesin the forest: AGBC and BGBC- above ground and
below ground biomass carbon; TCS - total carbon stock; T. CO2- total carbon dioxide equivalent; indv- individual
Plant name x10-2 % of share
TCS of indv.
Plant. ha-1
AGBC
(t indv-1)
BGBC
(t indv-1)
TCS
(tindv-1)
T CO2
equivalent
% share of indv. plant
TCS of indv.
Plant. ha-1
Echinopse giganteus 0.78 0.16 0.94 3.46 0.0196 0.63 0.00
Vernonia sp. 2252.66 450.53 2703.2 9920.73 56.364 587.99 1.52
Eucalyptus globulus 109.01 21.8 130.81 480.09 2.7276 231.27 0.60
Croton macrostachyus 1.42 0.28 1.71 6.27 0.0356 13.52 0.04
Ilex mitis 2.13 0.43 2.55 9.37 0.0532 0.47 0.00
Vernonia myriantha 0.76 0.15 0.91 3.34 0.019 2.93 0.01
Ocotea kenyensis 0.38 0.08 0.45 1.67 0.0095 0.3 0.00
Rubus sp. 0.67 0.13 0.8 2.93 0.0167 11.86 0.03
Embelia schimperi 0.67 0.13 0.8 2.95 0.0168 0.84 0.00
Maesa lanceolata 1.21 0.24 1.45 5.32 0.0302 331.79 0.86
Euphorbia abyssinica 95.76 19.15 114.91 421.71 2.3959 331.79 0.86
Dombeya torrid 0.33 0.07 0.4 1.47 0.0083 0.3 0.00
Brucea antidysenterica 0.64 0.13 0.77 2.83 0.0161 5.48 0.01
Syzygium guineense 1124.06 224.81 1348.87 4950.34 28.125 35778.9 92.77
Juniperus procera 405.51 81.1 486.62 1785.89 10.146 1266.26 3.28
Maytenus gracilipes 0.62 0.12 0.75 2.75 0.0156 1.1 0.00
3.4.Distribution of plant species and their Carbon Stock Share
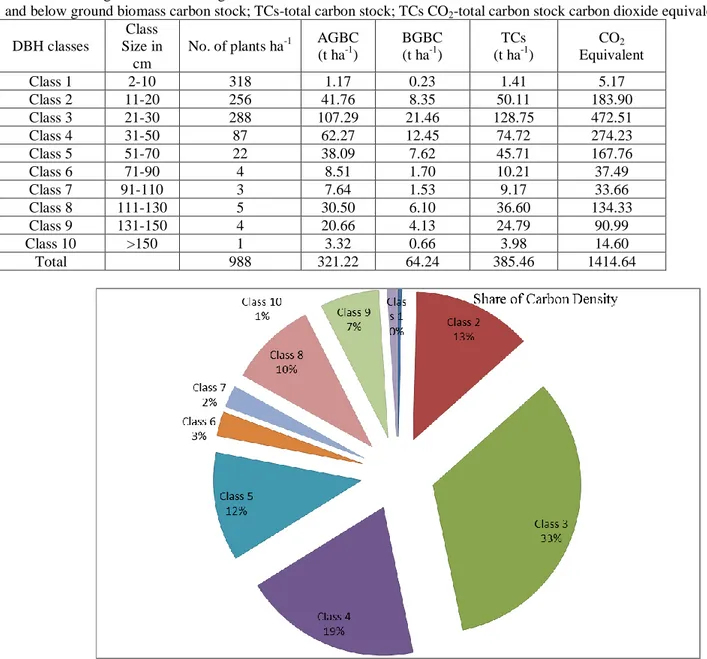
In the study area, plant species were categorized into ten DBH and H classes following (Healey et al., 2005; Bekele, 1994). From
the ten categories of plant DBH, class1 has the highest density with 318 plant ha-1 (32%) (Table 3). While class 10 (>150 cm) was
the least dominant, containing one plant ha-1 (0.10%). Unlike the highest plant density, the higher carbon stock was found in DBH
class 3 with 128.75 tha-1 (33.4%) (Figure 3), and the lowest carbon stock was found in DBH class 1 with 1.14 the-1 (0.24%) of the
total carbon stock density (Table 3).
Table 3: Above ground and below ground carbon stock variation within different DBH classes AGBC and BGBC- above ground
and below ground biomass carbon stock; TCs-total carbon stock; TCs CO2-total carbon stock carbon dioxide equivalent
DBH classes
Class Size in
cm
No. of plants ha-1 AGBC
(t ha-1)
BGBC
(t ha-1)
TCs
(t ha-1)
CO2
Equivalent
Class 1 2-10 318 1.17 0.23 1.41 5.17
Class 2 11-20 256 41.76 8.35 50.11 183.90
Class 3 21-30 288 107.29 21.46 128.75 472.51
Class 4 31-50 87 62.27 12.45 74.72 274.23
Class 5 51-70 22 38.09 7.62 45.71 167.76
Class 6 71-90 4 8.51 1.70 10.21 37.49
Class 7 91-110 3 7.64 1.53 9.17 33.66
Class 8 111-130 5 30.50 6.10 36.60 134.33
Class 9 131-150 4 20.66 4.13 24.79 90.99
Class 10 >150 1 3.32 0.66 3.98 14.60
Total 988 321.22 64.24 385.46 1414.64
Figure 3: Percentage Share of Carbon density of the classes
Out of the ten H category of plant species class 8 has the highest plant density with 344 plants ha-1 which accounts for 34.89%
of the total plant height class (Table 4). While plant height class 4 and class 5 were the least density with 2 plants ha-1 (0.415%).
But class 3 did not exist in the study area (Table 4). Like plant density, the highest carbon density was found in plant height class
Table 4: Above ground and below ground carbon stock variation within different height classes: AGBC and BGBC- above ground and below ground biomass carbon stock; TCs- total carbon stock; TCs- total carbon stock carbon dioxide equivalent. Carbon Stock in Different Carbon Pools of Shawo Forest.
Height classes
Class size in m
No. of plant
(plant. ha-1)
AGBC
(t.ha-1)
BGBC
(t.ha-1) TCs
CO2
equivalent
Percentage share (%) of
TCs
Class 1 (2-5] 287 0.72 0.14 0.86 3.15 0.22
Class 2 (5-10] 17 0.08 0.02 0.09 0.34 0.02
Class 3 (10-15] 0 0.00 0.00 0.00 0.00 0.00
Class 4 (15-20] 2 0.10 0.02 0.12 0.42 0.03
Class 5 (20-25] 2 0.13 0.03 0.16 0.58 0.04
Class 6 (25-30] 10 1.15 0.23 1.38 5.06 0.36
Class 7 (30-35] 80 19.31 3.86 23.18 85.06 6.01
Class 8 (35-40] 344 198.12 39.62 237.74 872.51 61.67
Class 9 (40-45] 189 87.99 17.60 105.59 387.53 27.39
Class 10 >45 33 13.68 2.74 16.41 60.23 4.26
In the study area, the mean carbon stock per plot for aboveground carbon pool was 321.22 tha-1 with CO2 equivalent of
1179.13 tha-1 (Table 5). The average belowground carbon stock was found to be 64.26 ± 65.3 t ha-1 with CO2 equivalent of 235.83
t ha-1 (Table 5).
Table 5: Mean biomass and carbon stock of AGB, AGC, BGB, BGC, LHGsB, LHGsC and SOC of Shawo forest: AGB & BGB –
above ground and below ground biomass; LHGsB- litter, herbs and grasses biomass; TB- total biomass; AGC and BGC- above and below ground carbon; LHGsC- total litter, herbs and grasses carbon; SOC- soil organic carbon; TC-total carbon
Total No. of plots Different Carbon pools
42 AGB BGB LHGsB TB AGC BGC LHGsC SOC TC
Mean value (t ha-1) 683.59 136.72 2.59 822.9 321.29 64.26 1.69 127.44 514.68
% share 83.07 16.61 0.31 100.00 62.43 12.49 0.33 24.76 100.00
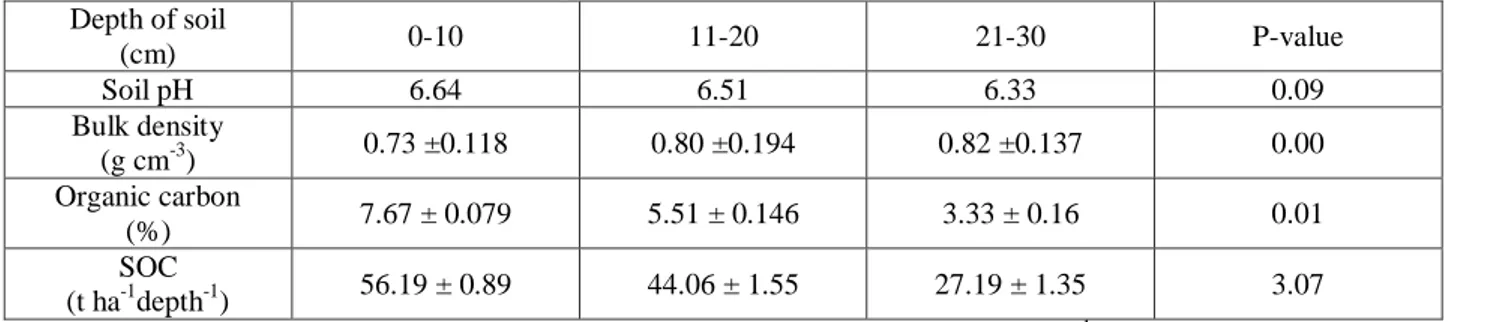
Soil organic carbon: The percentage of carbon content has decreased with increasing depth (Table 6). Similar to percentage
carbon, soil organic carbon share has shown variation at different soil depth 56.19 ± 0.89 tha-1 (0 - 10 cm),44.06 ± 1.55 (10-20
cm) and 27.19 ± 1.35 (20-30 cm). The total average Soil organic carbon of the forest was estimated to be 127.44 t ha-1. However,
the variation was not statistically significance (p=3.07) at a 95% confidence interval (Table 6).
Table 6: Soil carbon stock at different soil depth in Shawo forest
Depth of soil
(cm) 0-10 11-20 21-30 P-value
Soil pH 6.64 6.51 6.33 0.09
Bulk density
(g cm-3) 0.73 ±0.118 0.80 ±0.194 0.82 ±0.137 0.00
Organic carbon
(%) 7.67 ± 0.079 5.51 ± 0.146 3.33 ± 0.16 0.01
SOC
(t ha-1depth-1) 56.19 ± 0.89 44.06 ± 1.55 27.19 ± 1.35 3.07
The test was done at 95% confidence interval (α = 0.05) SOC - soil organic carbon: t ha-1
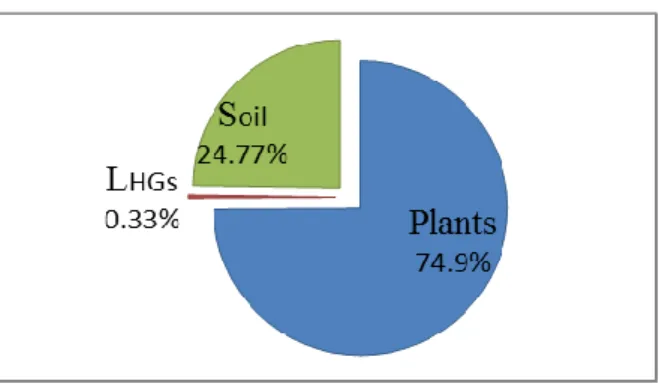
3.5.Carbon density in the three general carbon pools of Shawo forest
Total carbon stock density of plants, LHGs and organic soil were found to be 385.55, 1.69 and 127.44 t ha-1, respectively
(Table 5). The total carbon stock of Shawo forest which was 514.68 tha-1 (Table 5). Accordingly, maximum carbon stock was
found in plant species with a carbon reservoir of 385.55 t ha-1 (74.91%) of the total carbon of the forest (Figure 2). The soil
organic carbon stock was ranked as the second carbon reservoir (127.44 t ha-1 (24.77%)). LHGs biomass accumulated a small
Figure 4: Share of total carbon stock (%) in different carbon pools
4. DISCUSSION
4.1.Carbon Stored in Each Individual Plant Species
In Shawo forest, even if the species density is higher in the lower class (climbers and saplings), the higher DBH and H class plant was the larger carbon. For instance, Plant DBH >21 cm contains 86.64% of the total carbon density share of the total carbon stock (Figure 3). Similarly, plant H > 25 m has stored 99.75% of the total above ground carbon stock of the studied area (Table 4).
This shows that carbon stock density has a positive strong correlation with DBH (R2=0.72) and H (R2=0.63). As the DBH and H
value increase, carbon density increase. Within the plant species of the study site, 94% total above ground carbon stock was stored by Syzygium guineense.
According to different literature, the global pattern above ground biomass in tropical forests ranges between 213-1173 t ha-1
(Murphy and Lugo, 1986). The average carbon stock of Sub-Saharan Africa is 143 t ha-1 (Ullah and Al-Amin, 2012). Accordingly,
the Shawo forest carbon density iswithin the interval of tropical forest carbon stock interval. However, it was found to be above
one-fold of the reported value of Sub-Saharan Africa above ground biomass carbon (321.29 t ha-1). According to the total carbon,
the current study result was relatively greater than that of some of the reported carbon stock studies of Ethiopian forests; Mount
Zequalla forest (Girma et al., 2014) and Humbo forest (Chinasho et al., 2015) (Table 7). However, the present result is smaller to
that of Egdu forest (Yohannes et al., 2015) and Tara Gedam forest (Gedefaw, 2015) (Table 7). Nevertheless, the current study
carbon stock result was more or less similar toAdaba-Dodola and Danaba Community forest Bazezew et al.,2014; Bazezew et al.,
2015) (Table 7).The variation might be due to the variation of the age of the plants, existing species,and management of the
forests (Bazezew et al., 2015). The use of an allometric model for biomass estimation might also help to explain for the difference
in estimated value as explained that reliance on allometric equations could be one of the limitations resulting in large variations in such estimates (IPCC, 2003). Similarly, below ground biomass carbon stock in the studied area followed the same manner since it was a direct factor of above ground biomass (Brown, 2002).
Table 7: Comparison of carbon stock potential of the current result with other studies
Name T ha-1
AGBC BGBC LHGsBC SOC TCS
Adaba-Dodola CF Bazezew et al.,2014) 278.03 41.76 1.06 186.4 507.29
Danaba CF (Bazezew et al., 2015) 278.03 41.76 1.06 186.4 507.29
Egdu forest (Yohannes et al., 2015) 278.08 55.62 3.47 277.6 614.72
Humbo forest (Chinasho et al., 2015) 30.77 14.46 12.55 168.2 225.98
MauntZequalla forest (Girma et al., 2014) 273.2 47.6 6.5 57.6 348.8
Tara Gedam forest (Gedefaw, 2015) 306.66 61.52 0.9 274.3 643.11
Shawo forest (current study) 321.29 64.1 1.69 127.4 514.68
AGBC and BGBC- above ground and below ground biomass carbon stock; TCS-total carbon stock; LHDsBC- litter, herbs and grasses biomass carbon; CF- community forest
4.2.Carbon Stock in Different Carbon Pools of Shawo Forest
The mean carbon stock of leaf litter, herbs and grasses biomass was found to be less (1.69 t ha-1) as compared to other forests
such as Egdu forest (Yohannes et al., 2015), Mount Zequalla forest (Girma et al., 2014) and Humbo forest (Chinasho et al., 2015)
(Table 7). However, the result was more or less similar to evergreen forest (1.58 tha-1) (Mohanraj et al., 2011). This might be due
to the presence of dominant evergreen plants (Syzygium guineense) which do not shed their leaves in dry seasons. The result of
this study (1.69 tha-1) was within the interval estimated for the tropical and sub-tropical forest (1.4 - 4.8 t ha-1) (Chang et al.,
2010). the obtained result for LHGsBC result was nearly similar to that of Adaba-Dodola and Danaba Community forest
(Bazezew et al., 2015; Bazezew et al., 2014). The variation might be due to litterfall biomass accumulation that may be associated
with forest stand condition such as stand properties (Castilho et al., 2006). In the study site, the community uses the litter fall for fuel wood consumption this might be another factor for low LHGsB. From the LHGsB the majority was covered by litter falls in
most case the herbs and grasses were absents in the sampled site. According to Bazezew et al. (2014), the absence of herbs and
Soil Organic Carbon
About 32% of global soil carbon pool is in tropical soils (Lal, 2004). In the current study, the amount of soil organic carbon
was 127.44 tha-1) (Table 7). Though this is the second most stock of carbon in Shawo forest, it was found to be lower than other
studies in another Ethiopian forest, Egdu Forest (Yohannes et al., 2015), Adaba-Dodola CF Bazezew et al.,2014), Tara Gedam
forest (Gedefaw, 2015), Danab Community Forest (Bazezew et al., 2015), Humbo forest (Chinasho et al., 2015) (Table 7).
However, the result was also greater than MauntZequalla forest (Girmaet al., 2014) (Table 7). This might be rainfall and
temperature variation of the studied area Bazezewet al., 2014). Also, in undisturbed forest ecosystems, most of the variation in
SOC stocks could be significantly explained by variables (basal area, clay fraction and soil pH). Furthermore, SOC is strongly affected by ecosystem productivity, vegetation type, climate, clay mineralogy, soil pH, nutrient availability, soil aggregates and
texture (Don et al., 2011; Chaplot et al., 2010; Lal, 2004; Sixet al., 2002).
Soil pH and forest SOC stocks have a high relationship; reflect how the soil biochemical environment is critically important for
soil microbial communities that decompose organic matter (Hombegowda et al., 2016; Motavalli et al., 1995). The higher SOC
stocks found in the acidic and basic soils. Unfavorable biochemical environment retards microbial communities that decompose
the organic matter (Hombegowda et al., 2016; Six et al., 2002). At a near neutral soil pH, conditions were ideal for microbial
communities. Accordingly, decomposition rates were high, resulting in SOC accumulation (Hombegowda et al., 2016). In the
current study, a pH value of near neutral (6.64) was observed (Table 6). This might create a conducive condition for soil microbes to decompose effectively.
The bulk density of the soil in the current study was found to be 0.73 ± 0.12gcm-3, 0.80 ± 0.19 gcm-3 and 0.82 ± 0.14 gcm-3
for soil depth of 0-10 cm, 10-20 cm, and 20-30 cm, respectively. In the studied area, the presence of low bulk density in the soil indicates that the soil has a high potential to accumulate a large amount of organic carbon. The bulk density of the soil was increased with in increasing soil depth significantly (P=0.004**). This might due to the presence of plant roots and large soil
aggregates Bazezew et al., 2014; Yohannes et al., 2015; Lal, 2004; Six et al., 2002). Unlike bulk density, percentage carbon
decrease with increasing soil depth significantly (P=0.006**) (Table 6). Which was similar to Danaba Community Forest result, this might be due to the accumulation and decomposition of litter fall in the tope soil.
The recorded values of Egdu Forest (Yohannes et al., 2015); Adaba-Dodola Community Forest Bazezew et al.,2014),
MauntZequalla Forest (Girma et al., 2014), Tara Gedam forest (Gedefaw, 2015) and Danaba Community Forest studies showed a
similar pattern with the present study. However, Humbo Forest SOC is greater than all referred in table 7(Table 7).
Unlike the current result, the soil is the largest carbon reservoir in the terrestrial ecosystem (Chinasho et al., 2015; IPCC,
2003; Lal and Bruce, 1999). But forest management and the existing condition of the forest greatly affect soil organic carbon. SOC is influenced through land use and management activities that affect the litter input (for example how much-harvested biomass is left as residue and SOM output rates, tillage intensity affecting microbial survival) and the estimates depth to which carbon is accounted, commonly 30 cm (IPCC, 2003; Lal and Bruce, 1999). Hence, in the current study, the above-ground biomass
has two-fold greater than SOC. This might be due to the presence of mature Syzygium guineense (with better DBH and H value) in
good density. The use of litter as fuel also affects the SOC (IPCC, 2003).
5. CONCLUSION
The traditionally managed Shawo forest was found to sequester much of its carbon on above ground portion. The woody
nature of the dominant plant, Syzygium guineense, has the highest contribution to reserve the highest biomass of the total plant
species. With total area coverage of 130 hectares, a remarkable contribution was observed by community effort. Hence, possibilities in carbon finance programs and other related benefits need to be considered. The traditional forest management Knowledge that pass-through generations have to be recognized to enhance the global climate change mitigation efforts. Such interventions would contribute towards sustainable conservation of the forest resource and encourage climate change mitigation effort.
6. REFERENCES
Allen, S. E., H. M. Grimshaw, and A. P. Rowland, 1986. Chemical Analysis. In: Moore, P. D. and S. B. Chapman, (eds). 1986. Methods in plant ecology. Blackwell Scientific Publications, London, UK, 285-344.
Ayalew, A., Bekele T., and Demissew S., 2006. The Undifferentiated Afromontane Forest of Denkoro in the Centeral Highland of
Ethiopia: A Floristic and Structural Analysis. SinetEthiopia Journal of Science, 29(1): 45–56.
Bazezew, M.N., 2014. Carbon Stock in Adaba-Dodola Community Forest of Danaba District, West-Arsi Zone of Oromia Region, Ethiopia: An Implication for Climate Change Mitigation. MSc thesis, Addis Ababa University, Ethiopia.
Bazezew, M.N., Soromessa, T. and Bayable, E., 2015. Above- and Below-Ground Reserved Carbon in Danaba Community Forest
of Oromia Region, Ethiopia: Implications for CO2 Emission Balance. American Journal of Environmental Protection, 4(2):
75-82. doi: 10.11648/j.ajep.20150402.11.
Bekele, T., 1994. Phytosociology and Ecology of Humid Afromontane Forest in the Central Plateaus of Ethiopia. Journal of
Vegetation Science, 5(1): 87- 98. doi: 10.2307/3235642.
Black, C.A., 1965. Hydrogen-ion Activity. In Methods of Soil Analysis Part II: Chemical and Microbiological Properties;
America Society of Agronomy, 2: 771–1572.
Calfapietra, C., L. Barbati, B. Perugini, G. Ferrari, A.Guidolotti, A. Quatriniand P. Corona, 2015. Carbon stocks and potential carbon sequestration of different forest ecosystems, under climate change and various management regimes in Italy. Ecosystem Health and Sustainability, 1(8):1-9. doi: org/10.1890/EHS15-0023.
Castilho, C.V., Magnusson, W.E., Araujo, R.N.O., Luizao, R.C.C., Luizao, F.J., Albertina, P. and Higuchi, N., 2000. Variation in
aboveground plant live biomass in a central Amazonian Forest: effects of soil and topography.
JournalForestEcologyManagement, 234(2006): 85–96.
Chakravarty, S., K. Ghosh, C.P. Suresh, A.N. Dey, and G.Shukla, 2012. Deforestation: Causes, Effects and Control Strategies. In:
Clement, A. and Okia, (Edts.)., (2012). Global Perspectives on Sustainable Forest Management, 65:1-28.
Chang, C., Wang, C., Chou, C. and Duh, C., 2010. The Importance of Litter Biomass in Estimating Soil Organic Carbon Pools in
Natural Forests of Taiwan. Taiwan Journal of Science, 25(2), 171-80.
Chaplot, V., B. Bouahom, and C. Valentin, 2010. Soil organic carbon stocks in Laos: spatial variations and controlling factors, Global Change Biology16(4): 1380–1393. doi: org/10.1111/j.1365-2486.2009.02013.x.
Chave, J., M. Rejou-Mechin, Echain, A. Burquez, E. Chidumayo, M.S. Colgan, W.B.C. Delitti, A. Duque, T. Eid, P.M. Fearnside, R.C. Goodman, M. Henry, M. Martinez-Yrizar, W.A. H.C. Mugasha, Mullerlandau, M. Mencuccini, B.W., Nelson, A. Ngomanda, E.M. Nogueira, E. Ortiz-Malavassi, R. Pceisser, Ploton, P., M. C. Ryan, J.G. Saldarriaga, and G. V.
IeIlledent, 2014. Improved allometric models to estimate the above ground biomass of tropical Plants. Global Change
Biology.20(10): 3177-3190. doi: org/10.1111/gcb.12629.
Chinasho, A., T. Soromessa, and E. Bayable, 2015. Carbon stock in woody plants of Himbo forest and its variation along
altitudinal gradients: The case of Humbo district, Wolaita Zone, Southern Ethiopia.International journal of environmental
protection and policy, 3(4): 97-103. doi: 10.11648/j.ijepp.20150304.13.
Don, A., J. Schumacher, and A. Freibauer, 2011. Impact of tropical landuse change on soil organic carbon stocks a meta-analysis:
Soil organic carbon and land-use change. Global. Change Biology, 17(4): 1658–1670. doi:
10.1111/j.1365-2486.2010.02336.x.
FAO, 1990. The State of Food and Agriculture. World and Regional Reviews Structural Adjustment and Agriculture. FAO Agriculture Series 23, United Nations, Rome.
FAO, 2010. Global Forest Resources Assessment, Country Report Ethiopia. FAO forestry paper 163. FAO, Rome, Italy.
Gedefaw M (2015) Estimation of Above and Belowground Carbon Stocks of Forests: Implications for Sustainable Forest Management and Climate Change Mitigation: A Case Study of Tara Gedam Forest, Ethiopia. J Earth Sci Clim Change 6: 286. doi: 10.4172/2157-7617.1000286.
Girma, A., T.Soromessa, and T. Bekele, 2014. Forest carbon stocks in woody plants of mount Zequalla Monastery and its
variation along altitudinal gradient: implication of managing forests for climate change mitigation. Star journal, 3(2):132-140.
doi: 10.4314/star.v3i2.17.
Green, R., B.Tobin, and M. O’Shea, 2007. Above and below ground biomass measurements in an unthinned stand of Sitka spruce (Piceasitchensis(Bong) Carr.). European Journal of Forest Research,126(2): 179−188. doi 10.1007/s10342-005-0093-3. Grossman, R.B. and T.G. Reinsch, 2002. Bulk Density and Linear Extensibility: The Solid Phase: In Methods of Soil Analysis.
Soil Science Society of America Madison: Madison, WI, USA, 201–225.
Healey, S.P., W.B. Cohen, Z.Yang, and O.N. Krankina, 2005. Comparison of Tasseled Cap-based Landsat data structures for forest disturbance detection. Remote Sensing of Environment. 97(2005): 301-310.doi:10.1016/j.rse.2005.05.009
Hombegowda, H.C., O.V. Straaten, M. Köhler, and D. Holscher, 2016. On the rebound: soil organic carbon stocks can bounce back to near forest levels when agroforests replace agriculture in southern India, Soil, 2: 13–23. doi: 10.5194/soil-2-13-2016. IPCC, 2003. Good Practice Guidance for Land Use, land-Use Change and Forestry. In: Penman, J., M. Gytarsky, T. Hiraishi, D.
Kruger, R. Pipatti, L. Buendia, K. Miwa, T. Ngara, K. Tanabe, and F. Wagner, (Eds) (2003). Intergovernmental Panel on Climate Change (IPCC), IPCC/IGES, Hayama, Japan.
IPCC, 2007. Climate Change: The Physical Science Basis: Working Group I Contribution to the Fourth Assessment Report of the IPCC; Cambridge University Press: Cambridge, UK.
Lal, R. and J. Bruce, 1999. The potential of world cropland to sequester carbon and mitigate the greenhouse effect.
Environmental Science and Policy, 2(1999) 177–185.
Lal, R., 2004. Soil Carbon Sequestration Impacts on Global Climate Change and Food Security. Science, 304(5677): 623-1627. doi: 10.1126/science.1097396.
Lu, D., 2006. The potential and challenge of remote sensing-based biomass estimation. International Journal of Remote sensing,
27(7):1297–1328. doi: org/10.1080/01431160500486732.
MacDicken, K.,1997. A Guide to Monitoring Carbon Storage in Forestry and Agroforestry Projects. Winrock Internat ional, 1611 N. Kent St., Suite 600, Arlington, USA
Menker, H. and M.H. Rashid, 2012. Drivers of land-use change in the Southern Nations, Nationalities and People’s Region of Ethiopia. African Journal of Agriculture and Resource Economics,9(2): 148-164.
Moges, Y., Z. Eshetu, and S. Nune, 2010. Ethiopian Forest Resources: Current Status and Future Management Options in View of Access to Carbon Finances. Literature Review for Ethiopian Climate Research and Networking and the United Nations Development Program. Addis Ababa, Ethiopia.
Mohanraj, R., J. Saravananand S.Dhanakumar, 2011. Carbon stock in Kolli forests, Eastern Ghats India) with emphasis on aboveground biomass, litter, woody debris and soils. In: Elena, P. and Y.Serengil, (edts.), (2011). Biogeosciences and
Motavalli, P. P., C. A. Palm, W. J. Parton, E. T. Elliott, and S. D. Frey, 1995. Soil pH and organic C dynamics in tropical forest
soils: evidence from laboratory and simulation studies. Soil Biology and Biochemistry, 27(12): 1589–1599. doi:
org/10.1016/0038-0717(95)00082-P.
Murphy P. G., A. E. Lugo 1986. Ecology of Tropical Dry Forest Annual Review of Ecology and Systematics, 17: 67-88.
Pan, Y., A. R. Birdsey, F. Jingyun, H. Richard, P. E. Kauppi, A. W. Kurz, L.O. Phillips, 2011. A Large and Persistent Carbon
Sink in the World’s Forests. Science, 333(6045): 988-993.doi: 10.1126/science.1201609
Pearson, T., S. Walker, and S. Brown, 2005. Source book for land-use, land-use change and forestry projects. Winrock
International and the Bio-carbon fund of the World Bank. Arlington, USA, 19-35.
Powers, J.S., M.D. Corre, T.E. Twine and E. Veldkamp, 2011. Geographic bias of field observations of soil carbon stocks with tropical land-use changes precludes spatial extrapolation 108: 6318–6322.
Sahelemedhin, S. and B. Taye, 2000. Procedures for Soil and Plant Analysis. National Soil Research Center, EARO, Technical paper No.74, Addis Ababa, Ethiopia.
Senpaseuth, P., C. Navanugraha, and S.Pattanakiatron, 2009. The estimation of carbon storage in dry evergreen and dry
dipterocarp forest in Sang Khom District, NongKhai province, Thailand. Environment and Natural Resources Journal, 7(2):
1-11.
Six, J., R.T. Conant, E.A. Paul, and K. Paustian, 2002. Stabilization mechanisms of soil organic matter: implications for C-saturation of soils. Plant and Soil, 241(2): 155–176.
Ullah, M.R. and Al-Amin, 2012. Above- and below-ground carbon stock estimation in a natural forest, Bangladesh, Journal of Forest Science, 58 (8): 372–379.
UNDP, 2014. Social and Environmental standards, United Nations development program.
UNFCCC, 2015. Measurements for estimation of carbon stocks in afforestation and reforestation project activities under the clean. Development mechanism: a field manual.
Van der Werf G. R., D. C. Morton R. S. DeFries, J. G. J. Olivier, , P. S. Kasibhatla, R. B., Jackson, G. J. Collatz, and J. T.
Randerson, 2009. CO2 emissions from forest loss. National Goscience, 2: 737–738.
Xu, Y. J., S. B. Zhang, J. Franklin, P. Liang, Y. Ding, Z. Luo, D. Lu, Bao. and M. Jiang 2015. Improving allometry models to
estimate the above and belowground biomass of subtropical forest, China. Ecosphere, 6(12): 289. doi:
org/10.1890/ES15-00198.1.
Yohannes, H., T. Soromessa, M. Argaw, 2015. Carbon Stock Analysis Along Altitudinal Gradient in Gedo Forest: Implications
for Forest Management and Climate Change Mitigation. American Journal of Environmental Protection, 4(5): 237-244. doi: