Machine Learning Based Non-Invasive Vital Signs Analysis for Preterm Sepsis Risk Prediction
Işıl Güzey1
Trakya University, Computer Engineering Department
Edirne, Turkey
Özlem Uçar2
Trakya University, Computer Engineering Department
Edirne, Turkey
Abstract
There have been many promising vital sign analysis based research studies on earlier onset detection of late onset neonatal sepsis (LONS) in past decade. Timely and appropriate treatment is the most important factor to prevent mortality or lifelong neurodisability risks of sepsis especially for preterm neonates. Therefore advanced
predictive algorithms are highly required.Compared to mostly statistical based previous studies, comprehensive
machine learning based analysis are very few but important alternatives for better prediction performances. Considering this need, we devised a medical informatics system to analyze the distinction between healthy and with sepsis episodes of infants by means of machine learning methods. With approval of Edirne Clinical Research and Ethical Board, we collected daily patient based temporal non-invasive (heart rate, pulse-rate, oxygen saturation) data along with physicians’ patient status comments and diagnosis information from Trakya University Hospital Neonatal Intensive Care Unit (NICU) Center from February 2017 to October 2017. Using several machine learning methods, we analyzed seconds based daily vital sign time series data of 40 healthy and 30 septic episode samples of 16 premature infants with gestational age(GA)<33 weeks. Performance of Random Forest (RF) method with selected important features was better than Logistic Regression (LR), k-Nearest Neighbors (kNN), Support Vector Machine (SVM) methods with results of Accuracy: 0.833, Sensitivity: 0.800, Specificity: 0.857, AUC: 0.871 and Kappa:0.657. Before our planned model performance improvement studies on a larger dataset, we concluded that elaborate machine learning based analysis have significant potential to contribute to neonatal sepsis prediction performances.
Keywords: Machine Learning, Medical Decision Support System, Data Analytics
INTRODUCTION
Late Onset Neonatal Sepsis, a bloodstream infection, occurring after the third day of life causes fatal morbidity, mortality and increased healthcare costs among preterm babies. Spontaneous values of continuously monitored vital signs in Neonatal Intensive Care Units (NICUs) are not specific for diagnosis, early clinical signs are subtle and laboratory results can take up to a day before becoming available. Besides they are associated with false positive and negative results. On the other hand, early diagnosis is very important for appropriate and timely treatment in order to prevent mortality or lifelong neurodisability risks of sepsis (Fairchild and O’Shea, 2010) on preterm newborns.
by incorporating machine learning methods, such as kNN, RF and SVM in order to make use of non-linear class boundary opportunities during classification may contribute to healthy-sepsis classification performance.
Literature Review
After monitoring and analysing 4096 beats epoch of electrocardiogram voltage signal RR intervals histogram symmetry, characteristics of normalized heart rate (HR) time series before and after sepsis, sepsis-like illness,
or a random time in controls, Griffin and Moorman (2001)noticed that sepsis and sepsis-like illness groups had
abnormal HRC before clinical deterioration, as reduced baseline variability and short-lived decelerations, represented mainly by positive skewness of their histograms. Studies of (Fairchild and O’Shea, 2010) also depicted abnormal patterns of heart rate tracing histograms before sepsis, due to the inverse relationship between intervals and frequencies, this time as negative skew.
In addition to RR interval and HR frequency histograms asymmetry, there were several other measures used in these and similar studies (Beuchée, et al. 2009; Lucchini, et al. 2016; Bohanon, et al. 2015) such as Entropy, Fractal Exponents of HR characteristics and cross-correlation of HR-Spo2, which were sometimes used as inputs of predictive algorithms to calculate risk scores of sepsis occurrence in the next 24 hours.
The most common emphasize of all previous studies was, signs of sepsis can be predicted from vital signs analysis before the clinical signs of sepsis are recognized.
MATERIAL AND METHODS
a- Patients and Data Collection
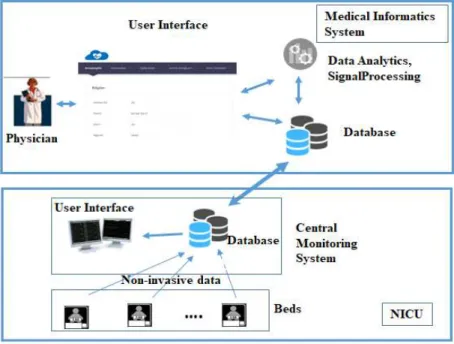
We targeted to get Heart Rate (HR) data with 500Hz sampling rate obtained from ECG leads, Pulse Rate (PR) and Oxygen Saturation (Spo2) data from pulse oximeter with 125Hz sampling rate. Study group was selected as preterms (GA<33 weeks) hospitalized in the NICU of our University Hospital from Feb 2017 to Oct 2017. Data collection periods were 2 one hour periods daily (11:00-12:00 and 16:00-17:00), when no care was given to babies. We transferred seconds based times series vital sign data of infants collected by Mindray iMec Patient Monitors from database of NICU Central Monitoring System to Mysql 5.7 Database on Intel Core i5-6200U CPU @ 2.3 GHz PC.
Fig -1: Infrastructure and its interaction with NICU modules
retained in a table of our database. Patient demographic information were also collected over this interface to another table.
In most of the similar studies, RR intervals extracted from electrocardiography (ECG) data were used, which is more sensitive than pulse oximeter based pulse rate (PR) data in terms of heart rate characteristic analysis. But due to mainly pulse oximeter based monitoring practice of our unit, ECG based HR data was missing most of the
time. By analyzing correlation coefficients of available HR data and corresponding PR with MATLAB corrcoef
function, we found a correlation of 0.9410, almost a direct positive correlation for each 154 available 30 minute HR and PR time series pairs. Therefore we considered PR data as surrogate of HR as some of previous researches
(Stanculescu, et al.,2014).
b- Data pre-processing and Feature Extraction Approach
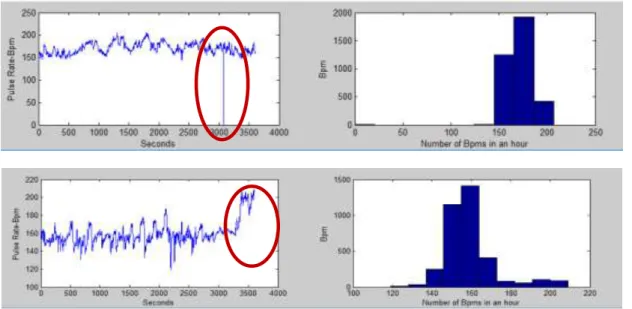
Collected vital signs time series data in NICUs are prone to deteriorations like missing and artifactual data. Causes of these may be various factors like parent or doctor visits, periodic care activities like feeding, cleaning, position corrections of nurses, probe drop out or even device based, such as oximeter reading errors. Examples of such missing and artifactual data are depicted in Figure 2 below.
Fig -2: Example of
a- Missing Data: Pulse Rate value of record of ‘0’
b- Artifactual Data: Non-normal Pulse Rate Trend, with very high variability
As the vital sign variability differences are the foundation of distinguishing a healthy patient from a septic one, elimination of these effects have utmost importance on the credibility and consistency of data analysis. Although daily data collection intervals were selected as when no care was given to babies, we came across such effects in our data and cleaned them, which caused elimination of approximately %28 of our total data.
By checking out a few representative patient vital sign trends, during transition from healthy to septic states, we confirmed variability decrease and decelerations in PR data before clinical deterioration in our data most of the time as stated in all the previous studies (Figure 3).
Fig -3: 30 minute Pulse Rate time series of
a- Healthy; 48 hours before sepsis suspicion. Skewness: 0.70342. b- 24 hours before sepsis suspicion. Skewness:-1.8973.
c- Time of sepsis suspicion and blood withdrawal for culture test. Skewness:-3.7592.
For healthy episode control group, we ensured that there were no ongoing previous disease treatment or available suspicion 3 days before and 2 days after the day when the vital sign data is obtained. For sepsis group, the date of blood withdrawal due to either clinical or hematological sepsis suspicion were selected.
As the number of healthy group was significantly more than sepsis group, in order not to face a class imbalance based problem in our analysis, for every sepsis sample, preferentially 2 or at least 1 sample from healthy group with same or close chronological age were selected. The composed data set after this process consisted 30 sepsis and 40 healthy samples of 16 infants.
We considered daily collected each 1 hour of data (between 11:00-12:00 and 16:00-17:00) as two 30 minutes epochs, totally 4 epochs daily. In case of presence of an artifact or more than 5 seconds of missing data, the epoch was eliminated. After feature extraction from each remaining epochs, the medians of the each daily feature were selected to represent the sample in the dataset. The features extracted from each daily available 30 minutes epochs to be included in our analysis were:
1. Skewness of seconds based PR time series histogram of a 30 minutes epoch.
2. Kurtosis of seconds based PR time series histogram of a 30 minutes epoch.
3. USG (Ultrasonography) based term of the infant at birth.
4. Bw (Birth weight).
5. CA (Chronological Age).
6. W (Weight) of infant at the chronological age of the sample.
7. Prm (PR Mean).
8. Hs (Hypoxia seconds), number of seconds which Spo2 was below %85.
9. Spo2m (Mean Spo2).
10.Brs (Bradycardia seconds), number of seconds which PR was below %85.
12.Ts (tachycardia seconds), number of seconds which PR was above180.
After selecting the relevant daily epoch data from Mysql Database, all data exploration, pre-processing, feature extraction, median selection and labeling the data with diagnosis information were carried out by MATLAB.
c- Machine Learning Analysis
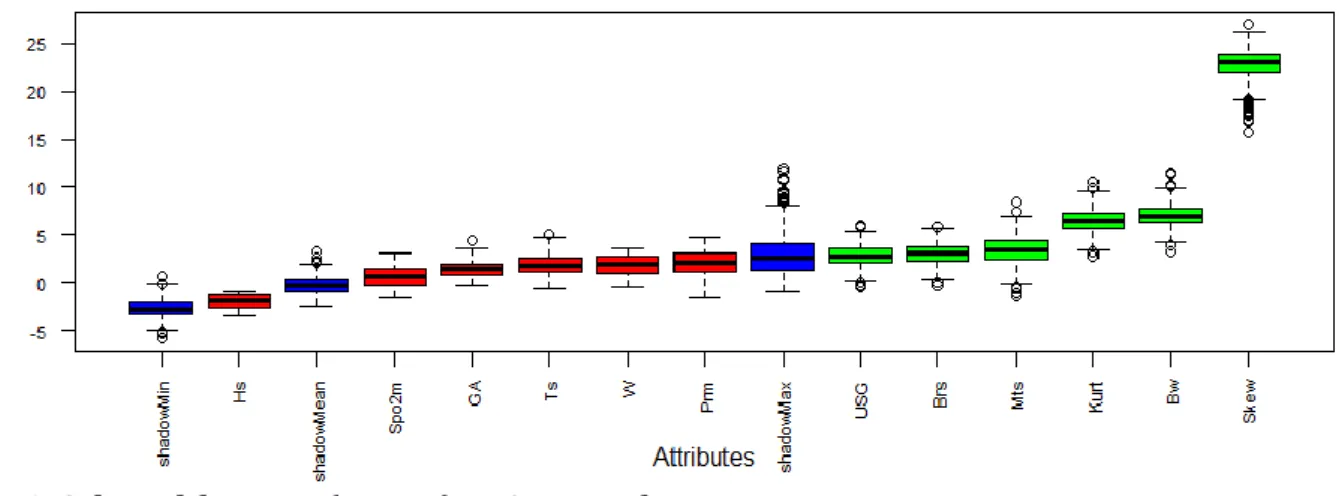
We used R v3.5.1 and R Studio v1.1.463 as IDE for machine learning analysis on our dataset. Machine learning algorithms exhibit a decrease of accuracy, when the number of variables is significantly higher than optimal (Kohavi and John, 1997). In order to reduce the dimension of our feature set while keeping relevant features, we used “Boruta” package (Kursa and Rudnicki, 2010). With Boruta, for each feature, a corresponding ‘shadow’ feature is created, whose values are obtained by shuffling values of the original features across objects. Consequently a classification using all features of this extended system is performed and the importance of all features are computed. Out of our 12 features explained in the previous section, using Boruta package and variable importance measure (VIM), 6 of the features (Skew, Bw, Kurt, Mts, Brs, USG) were selected as important. Output plot of Boruta with regard to our dataset is depicted in Figure 4. Selected, rejected and scores of (minimal, average and maximum) shadow features are colored as green, red and blue respectively.
Fig -4: Selected features (greens) as Output of Boruta
The other R packages used in our analysis were mlbench (Leisch and Dimitriadou, 2010), randomForest (Liaw
and Wiener, 2002), class (Venables and Ripley, 2002), caret (Kuhn et al., 2018) and ROCR (Sing et al., 2005). We
randomly sorted all the healthy and sepsis samples and normalized the feature values (by subtracting the minimum and dividing this to difference of maximum and minimum). In order to ensure that both training and test datasets will contain roughly the same proportion of class values as the full dataset, we used
createDataPartition function in caret package for stratified random sampling. We selected %65 of the dataset as
training and the rest as test dataset.
TABLE – 1: Machine Learning Analysis Results
Method Features Acc Sens Spec AUC Kappa
LR
All 0.750 0.700 0.786 0.821 0.486
Selected 0.708 0.600 0.786 0.804 0.391
kNN
All 0.750 0.600 0.929 0.779 0.455
Selected 0.750 0.600 0.857 0.790 0.470
SVM
All 0.660 0.583 0.750 0.826 0.330
Selected 0.750 0.600 0.857 0.864 0.471
RF
All 0.792 0.700 0.857 0.836 0.565
Selected 0.792 0.800 0.786 0.868 0.657
As seen from this table RF method with selected important features has the best performance and it is significantly higher than performance of LR which was the only used method in previous similar studies.
ROC Curves of all four methods can be seen in Figure 5 with different colors.
Fig-5: ROC Curves of SVM, kNN, RF and LR on Dataset
RESULTS AND DISCUSSION
due to skin sensitivity concerns pulse oximeter is the preferred method in many NICUs. Compensating the sensitivity gap of PR with predictive models with higher performance may be an opportunity for applicability and practicality of vital sign analysis based sepsis prediction for preterm newborns.
REFERENCE
Beuchée, A., Carrault, G., Bansard, J. Y., Boutaric, E., Bétrémieux, P., Pladys, P. (2009): Uncorrelated Randomness of the Heart Rate Is Associated with Sepsis in Sick Premature Infants. Neonatology, 96(2):109-14.
Bohanon, F. J., Mrazek, A. A., Shabana, M. T., Mims, S., Radhakrishnan, G. L., Kramer, G. C., Radhakrishnan, R. S.(2015): Heart rate variability analysis is more sensitive at identifying neonatal sepsis than conventional vital signs, The American Journal of Surgery, 210: 661-667
Fairchild, K. D., O'Shea, T. M. (2010): Heart Rate Characteristics: Physiomarkers for Detection of Late-Onset Neonatal Sepsis. Clinical Perinatology,.37(3):581-98.
Griffin, M. P., Moorman, J. R., (2001). Toward the Early Diagnosis of Neonatal Sepsis and Sepsis-Like Illness Using Novel Heart Rate Analysis. PEDIATRICS 2001, 107(1):97-104.
Kohavi, R., John, G. H., (1997): Wrappers for Feature Subset Selection. Artificial Intelligence, 97, 273-324.
Kuhn. M., Contr. from Wing. J., Weston. S., Williams. Andre., Keefr, C., Engelhardt, A.,Cooper, T., Mayer, Z., Kenkel, B., the R Core Team, Benesty, M., Lescarbeau, R., Ziem,A., Scrucca, L., Tang, Y., Candan, Y., Hunt, Tyler (2018): caret: Classification and Regression Training. R package version 6.0-81. URL: https://CRAN.R-project.org/package=caret
Leisch, F., Dimitriadou, E., (2010): mlbench: Machine Learning Benchmark Problems. R package version 2.1-1.
Liaw, A., Wiener, M., (2002): Classification and Regression by randomForest. R News 2(3), 18-22.
Lucchini, M., Fifer, W. P., Sahni, R., Signorini, M. G. (2016): Novel heart rate parameters for the
assessment of autonomic nervous system function in premature infants, Physiological Measurement, 37(9):1436-46.
Miron B. Kursa, Witold R. Rudnicki (2010): Feature Selection with the Boruta Package. Journal of Statistical
Software, 36(11), 1-13. URL http://www.jstatsoft.org/v36/i11/.
Sing. T., Sander. O., Beerenwinkel. N., Lengauer. T. (2005): “ROCR: visualizing classifierperformance in R.”
_Bioinformatics_ *21*(20), 7881. URL: http://rocr.bioinf.mpi-sb.mpg.de .
Stanculescu, I, Williams, C.K.I., Freer, Y. (2014): Autoregressive Hidden Markov Models for the Early Detection of Neonatal Sepsis, IEEE Journal of Biomedical and Health Informatics, 18(5):1560-1570.