20
Determining Ship Resistance Using
Computational Fluid Dynamics (CFD)
Yasser M. Ahmed a, c, O. B. Yaakoba, b,*, M. F. A. Rashid a, A. H. Elbatran a, d
a
Faculty of Mechanical Engineering, Universiti Teknologi Malaysia, 81310 Skudai, Johor, Malaysia
b Marine Technology Centre, Universiti Teknologi Malaysia, 81310, Skudai, Johor, Malaysia c Faculty of Engineering, Alexandria university, Alexandria, Egypt
d
Faculty of Engineering, Arab Academy for Science and Technology and Maritime Transport, Alexandria, Egypt
* Corresponding author: [email protected]
Abstract
The resistance of a hull is a consequence of force between air and water which act against the movement of ship or vessel. The ship resistance is an important issue for ensuring smooth propulsion. The traditional method to predict resistance on real hull is by using towing tank model running at corresponding Froude numbers, or called towing tank experiments. Disadvantages of this method are the associated cost and the limitation on the availability of physical tanks and models for every single design. These disadvantages can be overcome by using computational fluid dynamic, or numerical simulation. The objective of the study is to calculate the total resistance and simulate flow around Wigley and DTMB 5415 hull form using computational fluid dynamic. The result obtained from the numerical simulations were found almost similar with the experimental data. The highest percentage of error were only 5.94 percent for DTMB and 5.85 percent for Wigley hull. This result shows that the study had been done correctly and achieved its main objective.
Keywords: Wigley, DTMB 5415, Ship resistance
1. INTRODUCTION
Ship resistance is defined as the force required to tow or to move the ship in calm water at a constant velocity. The resistance of a ship depends on the velocity of the ship. Therefore, resistance is always specific at a particular velocity. The condition of the sea also affects the resistance by the sea. Ship resistance in calm water is different from in rough sea. Ship resistance is considered as one of the important factors in designing the ship. The ship
resistance can be determined by using
Computational Fluid Dynamic (CFD), an easy and less time consuming application. The accuracy of the CFD analysis is proven accurate, and most naval architects use this method instead of towing
tank experiment method which is tedious and time consuming.
According to Perez (2009), in order to obtain accurate results even in steady state simulations, every problem needs to be set-up carefully, and this includes having sufficient nodes within the boundary layer, correct mesh for high gradient
zones and suitable time step sizes [1].
Comprehensive efforts are vitally required to verify and validate computational data; however there might still be lack of consensus of suitable techniques [2].
21
pseudo-time step to solve equations as a means of under relaxation, was used. The under relaxation is necessary to stabilize some iterative processes for obtaining steady state solutions [3]. It could be said that smaller physical time steps are more robust that larger ones [4]. Nonetheless, convergence will require more CPU time.
2.COMPUTIONALMETHOD
The types of hull forms used in this study were Wigley and DTMB 5415 hull forms. The hulls were chosen because of the availability of the experimental data. The DTMB 5415 and Wigley hulls were selected as a benchmark to gain understanding in free surface simulations using CFX. The Wigley hull was generated by using a three variables parametric function in ANSYS ICEM, which is parabolic under the waterline and extends up vertically. Equation 1 describes the underwater hull shape.
(1)
where
x - Distance from mid-ship (positive FWD)
y – Half-breadth in point (x, z)
z – Distance measured from the base line (positive in the direction of keel)
Table 1. Wigley dimension [7]
The mesh for the model and domain was generated by using ICEM CFD. The mesh at the draft of the model needed to be of high quality and correct in order to obtain accurate results. The details of the
mesh for the Wigley hull are shown in Figure 1, Figure 2 and Table 2.
Figure 1. Mesh element of Wigley hull form
Figure 2. Domain for Wigley hull
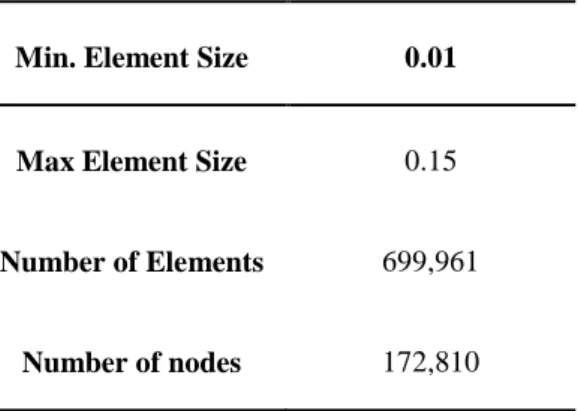
Table 2. Mesh element info for Wigley hull
Min. Element Size 0.01
Max Element Size 0.15
Number of Elements 699,961
Number of nodes 172,810
The other model was DTMB 5415 hull [3]. It is one of the hull form designs used as preliminary design for designing US Navy combatant. The hull geometry includes both a sonar dome and transom stern. Propulsion is provided through twin open water propellers driven by shafts supported by struts. This model had been used for many CFD
Length Between Perpendicular (Lpp)
1.00 (m)
Breadth (B) 0.1 (m)
Draft (D) 0.0625 (m)
22
analyses [2-4]. Figure below shows the grey scale image of the DTMB 5415.
Figure 3. Grey scale image of DTMB 5415 [3]
In this study, the model was designed similar to the dimension obtained from the data collected. The meshing technique used was similar to the technique used for meshing Wigley hull. Table 3 shows the dimensions for DTMB 5415 hull.
Table 3. Model dimension for DTMB 5415 [3]
Length Between Perpendicular (Lpp)
5.72 (m)
Breadth (B) 0.7242 (m)
Draft (D) 0.248 (m)
Density 998 (kg/m3)
Wetted Surface Area 4.861 (m2)
The meshing of for the DTMB 5415 hull andits domain were done separately. The meshing detail for the DTMB 5415 hull is presented in Table 4. At the draft of the model, prism mesh was used to obtain more accurate result.
Table 4. Mesh element info for DTMB 5415
Min. Element Size 0.01
Max Element Size 0.15
Number of Elements 6,399,587
Number of nodes 2,327,523
A physical domain with water and air in standard conditions was specified and a homogeneous coupled Volume of Fluid model was selected as it is recommended for free surface flows, where the free surface is well defined over the entire domain. A homogeneous model allows two different phases when the interface is distinct and well defined everywhere, as in the case of hulls riding on a free surface without breaking waves. For this initial simulation, the k-Ɛ turbulence model was used. The boundary conditions were imposed as follows: Inlet: normal free stream, outflow: hydrostatic pressure, Top: opening pressure, Mid plane: symmetry, Side and Bottom: free slip.
Figure 4. Initial Computational Domain for Wigley hull form
3.RESULTS AND DISCUSSIONS
From the analyses using ANSYS CFX software, the resistance for each model was obtained. The variable for the analysis was denoted Froude number (Fn). The values of the resistance were converted into dimensionless unit by using the total resistance coefficient formula.
23
Table 5. Result for resistance of Wigley hull
Table 6. Result for resistance of DTMB 5415
Figure 5(a). Experimental and numerical Ct results for Wigley hull form
Figure 5(b). Experimental and numerical Ct results for DTMB 5415 hull form
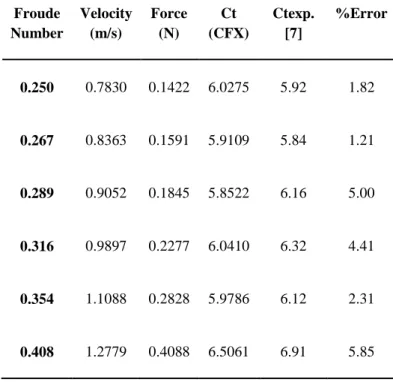
Figure 5(a) shows good agreement between the experimental and numerical results of Ct for the Wigley Hull at lower Fn (0.25 and 0.267), with error of less than 2% (over estimation), as shown in Table 5. From Fn of 0.289 to 0.408, the CFD code was always under prediction of the total resistance of the hull. However, the maximum error in the predicted numerical results was 5.85%, which is considered a good estimation for the resistance of such hull form. Finally, the humps and hollows in the Wigley hull experimental data curve were predicted by the CFD code, which were derived from the interaction between the hull wave systems.
For the DTMB 5415 hull, the numerical results were always less than the experimental results (Figure 5(b)) with a maximum error of 5.94%, as can be seen in Table 6. These differences were mainly due to the complication of the hull form in
Froude Number
Velocity (m/s)
Force (N)
Ct (CFX)
Ctexp. [7]
%Error
0.250 0.7830 0.1422 6.0275 5.92 1.82
0.267 0.8363 0.1591 5.9109 5.84 1.21
0.289 0.9052 0.1845 5.8522 6.16 5.00
0.316 0.9897 0.2277 6.0410 6.32 4.41
0.354 1.1088 0.2828 5.9786 6.12 2.31
0.408 1.2779 0.4088 6.5061 6.91 5.85
Froude Number
Velocity (m/s)
Force (N)
Ct(CFX) Ct
exp [3]
%
Error
0.276 2.0637 27.6966 5.5681 5.92 5.94
0.325 2.4345 41.1299 5.9418 6.24 4.78
0.371 2.7791 56.8557 6.3031 6.55 3.77
24
this case, which should have been provided with more mesh elements on the hull surface to accurately calculate the pressure and frictional resistance of the ship at various speeds.
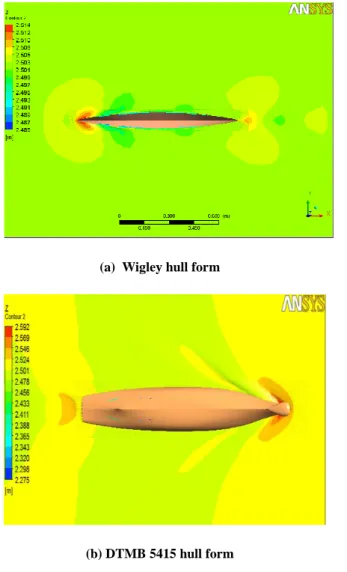
Figure 6 shows the total wave elevation around the Wigley and DTMB 5415 hulls. To analyze the wave field, we needed to deduct the height of the water, which was 2.5m. As can be seen, there was wave crest formed at the position forward of both hulls. The wave height at Wigley hull was 0.014m and was 0.092m at DTMB 5415 hull. It can be noted that the scattered waves dissipated quickly when moving away from the body. This is because wave absorption was artificially promoted during the calculation in order to avoid numerical artifacts generated by wave reflection at the edges of the computational domain.
(a) Wigley hull form
(b) DTMB 5415 hull form
Figure 6. Wave field around hull
4.CONCLUSION
The flow around the Wigley and DTMB 5415 hull form had been simulated using the finite volume code ANSYS CFX. Besides, the frictional and the pressure resistance or called as the total resistance for Wigley and DTMB 5415 hull form, had been calculated at different speed and Froude number. The results obtained from the calculation using computational fluid dynamic for both model had been compared with those of experimental result. It was found that the values of resistance obtained from the ANSYS CFX were almost similar with those of experimental data, as the biggest percentage of error was only 5.94 percent for DTMB 5415 model and only 5.85 percent for Wigley hull form. For future study, the predicted numerical results for the Wigley and the DTMB 5415 model hulls can be improved by using finer mesh elements on the surface of both units and by utilization of more advanced turbulence models such as Detached Eddy Simulation (DES).
KNOWLEDGEMENT
The authors would like to express their sincere gratitude to everyone who have supported them in this research work.
5. REFERENCES
[1] Larsson, L., Patel, V.C. and Dyne, G., (Eds.) (1990). “Ship Viscous Flow - Proceedings of 1990 SSPA-CTH-IIHR Workshop”, Flowtech
International Research Report, No 2,
Gothenburg, Sweden, 1991.
[2] Kodama, Y., Takeshi, H., Hinatsu, M., Hino, T., Uto, S., Hirata, N. and Murashige, S., (1994) “Proceedings of the 1994 CFD Workshop”, Ship Research Institute, Japan. [3] Larsson, L., Stern, F. and Bertram, V., (2003)
“Benchmarking of Computational Fluid Dynamics for Ship Flows: The Gothenburg 2000 Workshop”, Journal of Ship Research, 47, No.1, pp. 63-81.
[4] Hino, T. (ed.), (2005) “Proceedings of the CFD Workshop Tokyo 2005”, Tokyo, Japan. [5] Chen, C.Y. and Noblesse, F. (1983)
25
for the Wigley Hull. Journal of Ship Research, Vol. 27, No.4,
[6] Burg, C.O.E, Sreenivas, K., Hyams, D.G. and Mitchell, B., (2002) “Unstructured Nonlinear Free Surface Simulations for the Fully-Appended DTMB Model 5415 Series Hull Including Rotating Propulsors”, Proceedings
of the 24th Symposium on Naval
Hydrodynamics, Fukuoka, Japan, 8-13. [7] Kajitani, H et al (1983). The Summary of the
Cooperative Experiments on Wigley Parabolic Model in Japan. Tokyo University. Japan
[8] Thompson J.F., Soni B.K., Weatherill N.P. (1999). Handbook of Grid Generation. CRC Press.
[9] Montgomery, D. (2005) Design and Analysis of Experiments. John Wiley & Sons, Inc. [10] Leo Lazauskas, Cyberiad, First Draft: 16 Dec.
(2009), Resistance and Squat of Surface Combatant DTMB Model 5415: Experiments
![Table 3. Model dimension for DTMB 5415 [3]](https://thumb-us.123doks.com/thumbv2/123dok_us/8011622.2122962/3.892.474.785.407.594/table-model-dimension-dtmb.webp)